oil
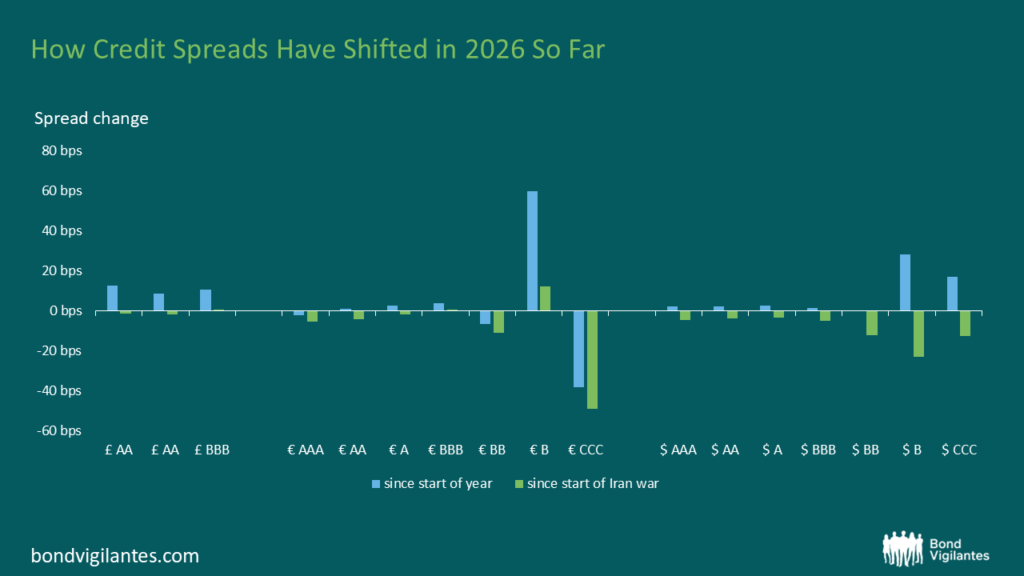
Not all oil-exporting countries are the cracking winners you think.
By Charles de Quinsonas
4 June 2026


Well the Mail and the Express can’t agree on the answer to this question, but official borrowing data released later this morning seem to suggest that it might be. Mortgage approvals (a good lead indicator of house prices) were at their lowest level for a year. The Nationwide house price index is also showing a weakening, if not yet price falls on a UK average level. There’s some good stuff in the Nationwide press release, comparing this rate hiking cycle with the 2003-2004 one. Then, activity in the housing market collapsed very quickly in response to the Bank’s hikes, whereas in this cycle we are only now seeing a response to the hikes which started in 2006. They suggest that this is because in the earlier cycle, market derived swap rates (from which fixed rate mortgages are priced) reacted much more aggressively, rising by more than – and earlier than – base rates. This time swap rates have tracked the Bank’s rate more closely, so demand has been slower to come off – but it looks as if monetary policy is finally working in slowing activity (consumer credit statistics today were also weak).
This doesn’t preclude further UK rate rises however – the Bank will remember its policy mistake in cutting rates in 2005 having seen the housing market cool slightly. Then, the housing market took this cut as a green light to reaccelerate, and the average UK house price has since put on another £25,000 in value (to £182,000). So not the end of the cycle – but perhaps the beginning of the end?
The big question facing the Bank of England is whether the recent high inflation numbers will be transmitted through the labour market in a vicious inflationary circle. According to the official figures, wage inflation has so far been restrained. However, should one always believe the official statistics?
An article in today’s Financial Times entitled ‘Fears for quality as statisticians scatter’, touches on the subject of the quality of data that economic policy decisions are made on. The thrust of the article relates to the problems faced by the Office for National Statistics (ONS), as it relocates from London to Wales. The interesting chart for us bond vigilantes is the one showing the “official” average earnings index and the experimental weekly earnings measure. The chart shows wage inflation to be significantly higher on the new experimental measure than on the traditional average earnings index.
Going back further in time, figure 3 of this ONS report, shows that this is not purely a natural bias but could well better reflect the state of the labour market, with the experimental measure turning down below the headline measure in 2002 as the economy weakened. As the FT points out, it may well be that wage inflation from 2005 to the present has been running at nearly 2% per annum higher than the Bank of England has been told. (subscription required), showed pricing pressure at eight year highs, and the Bank has failed to keep inflation within its target range. After all, if the statistics you base your decisions on are wrong, then the odds of hitting your target goals are reduced.
For anyone wondering what an experimental statistic is, the ONS describes them as “statistics that are in the testing phase and are not fully developed”. And for those of you wondering how the ONS determines when a statistic is no longer experimental, well this “is largely a matter of statistical judgement…….”. Quite!
With a less than satisfactory ‘I told you so’ look from Jim scant reward for my efforts in attending this year’s Champions League Final in Athens, I’ve taken more heart from the continued data flow (click the chart to enlarge) supporting my view of higher interest rates for Europe. In addition, I experienced first hand some inflationary gouging by the Greek taxi drivers – a temporary, and unofficial, cartel imposed supplement of 20 Euros for all Liverpool fans for any journey.
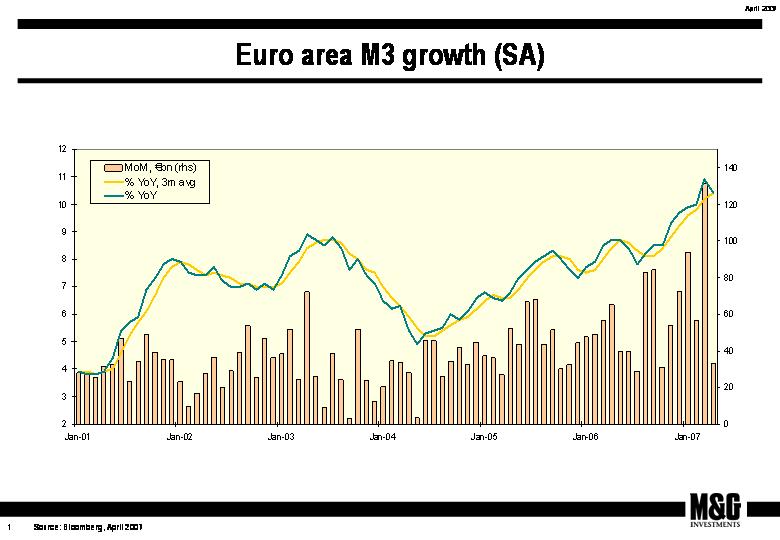
April’s money supply data released earlier today by the European Central Bank showed a slight deceleration from March’s reading of 10.9% YOY growth to 10.7% YOY, though these figures needs to be put into context. At 10.7% the growth in money supply remains well above the 4.5% level that the ECB considers non-inflationary and remains one of the key measures they will use to gauge future inflation. M3 money supply has remained above this 4.5% non-inflationary level since early 2001 with no real sign of abating, despite seven rate increases since late 2005. Indeed the ECB is extremely concerned that this excessive liquidity will drive prices up, pushing inflation above the 2% annual target.
At last month’s press conference, ECB President Trichet signalled a hike in June to 4% but since then, continued rises in oil prices, tight labour markets and strong capacity utilization data are likely to add further fuel to the fire. Indeed the futures market is already anticipating at least another hike to 4.25% by year end with ECB member Garganas stating today that they will keep their options “open” beyond June.
Whilst US rate cuts are looking less likely now – a long pause looks the best bet – I can’t see what (besides perhaps a stock market crash?) can stop the ECB from continuing to “normalise” European monetary policy. I’ll continue to run a short duration (bearish) position in the European Corporate Bond Fund in the face of such compelling data.
Sent by anonymous, 23 May 2007:
"As an IFA I am constantly reminded to adopt the principles of asset allocation and ensure that most clients have a spread of equities and bonds within client portfolios. However the outlook for bonds from most quarters is poor and many investors are suggesting that their bond allocation would be better off in cash where the capital value is secure and the yield much higher than gilt or bond funds.
What is your view and what advice could you give to IFAs struggling with this dilemma?"
First of all, thanks for the question. We want this blog to be interactive, and we’re happy to receive any questions, comments or market thoughts readers might have.
Whilst we are, of course, forbidden to offer investment advice, we can share your pain. With the UK yield curve inverted (yields on longer dated bonds yielding below the Bank of England rate) you have to believe that the price of these longer dated assets will rally simply to match the return on cash. And once you’ve paid management fees the hurdle is even greater. With some of the internet banks offering rates of 6% (virtually risk free as the deposits are largely protect by the government) it’s understandable that clients have found traditional corporate bond funds unattractive, especially if held outside a tax free ISA. As such we have seen that the most popular area for investors in our funds in recent months has been into money markets and other "cash plus" type products (including leveraged loans). These instruments pay a floating rate of return linked to base rates, plus a margin to reflect credit risk. So for example a Floating Rate Note (FRN) issued by AA rated Citibank might pay 3 month Libor (currently 5.78%) plus 9 bps, so 5.87% in total. A similar instrument issued by a sub-investment grade company like Saga Holidays might pay 8.28%, and in both cases if interest rates rise – as we expect them to – the returns will also increase. So if you agree with us, and expect higher interest rates, look for bond funds with high exposures to FRNs within their portfolios.
An alternative strategy would be to look at funds which can use the new UCITS3 wider powers; these funds may be able to take bearish views both on interest rates and on credit spreads, and thus can make positive returns even if bond markets are selling off. Richard Woolnough’s M&G Optimal Income fund, which has the ability to express such bearish views, has seen positive returns since launch in December last year, outperforming the average high yield fund, money market fund, corporate bond fund and gilt fund (the latter two asset classes having had negative returns over the period).
A final thought would be to think about the purpose of a diversified asset allocation, and the point of bonds. None of us has perfect knowledge, and whilst the global economy feels lovely right now, we do worry that a US recession could be a possibility in 2008. In that circumstance – or indeed in a world where terrorism, bird flu, and oil shocks are possibilities – bonds may perform very strongly. I’ve been involved in the bond markets since 1992, and I think that it’s true to say that fixed interest NEVER looks fantastically attractive! The yields available will always look meagre compared with "expected returns" on equities and other riskier assets – yet there have been many periods over those past 15 years when bonds have outperformed equities, sometimes significantly. Asset allocation models are there to help match the clients’ assets to their expected liabilities. These liabilities almost certainly involve the provision of a fixed income on retirement, or an annuity purchase, and in these circumstances to buy anything other than bonds is taking a bet – a bet which many FTSE companies took when they bought shares for their pension funds rather than bonds, and one that went very wrong in 2001-2003 and resulted in the pension fund deficits that persist to this day in many cases.
This is not me being fantastically bullish on fixed interest – you can see from our fund positioning that we are short duration compared to our peers, and also underweight in credit risk. But as long as central banks keep inflation under control (and that will involve at least one more UK rate hike), the interest rate environment could be very different next year, and bonds could start to rally in anticipation of weaker growth. Ten year gilt yields have nearly reached 5.25% (having been at 4% at the start of 2006) – a level that’s starting to look like good, if not compelling, value. But we think it will take a normalisation of the yield curve (with higher long dated bond yields than cash rates) before either we, or our clients, back up the trucks and go heavily overweight in the bond asset class. Sent by anonymous, 23 May 2007:
"As an IFA I am constantly reminded to adopt the principles of asset allocation and ensure that most clients have a spread of equities and bonds within client portfolios. However the outlook for bonds from most quarters is poor and many investors are suggesting that their bond allocation would be better off in cash where the capital value is secure and the yield much higher than gilt or bond funds.
What is your view and what advice could you give to IFAs struggling with this dilemma?"
First of all, thanks for the question. We want this blog to be interactive, and we’re happy to receive any questions, comments or market thoughts readers might have.
Whilst we are, of course, forbidden to offer investment advice, we can share your pain. With the UK yield curve inverted (yields on longer dated bonds yielding below the Bank of England rate) you have to believe that the price of these longer dated assets will rally simply to match the return on cash. And once you’ve paid management fees the hurdle is even greater. With some of the internet banks offering rates of 6% (virtually risk free as the deposits are largely protect by the government) it’s understandable that clients have found traditional corporate bond funds unattractive, especially if held outside a tax free ISA. As such we have seen that the most popular area for investors in our funds in recent months has been into money markets and other "cash plus" type products (including leveraged loans). These instruments pay a floating rate of return linked to base rates, plus a margin to reflect credit risk. So for example a Floating Rate Note (FRN) issued by AA rated Citibank might pay 3 month Libor (currently 5.78%) plus 9 bps, so 5.87% in total. A similar instrument issued by a sub-investment grade company like Saga Holidays might pay 8.28%, and in both cases if interest rates rise – as we expect them to – the returns will also increase. So if you agree with us, and expect higher interest rates, look for bond funds with high exposures to FRNs within their portfolios.
An alternative strategy would be to look at funds which can use the new UCITS3 wider powers; these funds may be able to take bearish views both on interest rates and on credit spreads, and thus can make positive returns even if bond markets are selling off. Richard Woolnough’s M&G Optimal Income fund, which has the ability to express such bearish views, has seen positive returns since launch in December last year, outperforming the average high yield fund, money market fund, corporate bond fund and gilt fund (the latter two asset classes having had negative returns over the period).
A final thought would be to think about the purpose of a diversified asset allocation, and the point of bonds. None of us has perfect knowledge, and whilst the global economy feels lovely right now, we do worry that a US recession could be a possibility in 2008. In that circumstance – or indeed in a world where terrorism, bird flu, and oil shocks are possibilities – bonds may perform very strongly. I’ve been involved in the bond markets since 1992, and I think that it’s true to say that fixed interest NEVER looks fantastically attractive! The yields available will always look meagre compared with "expected returns" on equities and other riskier assets – yet there have been many periods over those past 15 years when bonds have outperformed equities, sometimes significantly. Asset allocation models are there to help match the clients’ assets to their expected liabilities. These liabilities almost certainly involve the provision of a fixed income on retirement, or an annuity purchase, and in these circumstances to buy anything other than bonds is taking a bet – a bet which many FTSE companies took when they bought shares for their pension funds rather than bonds, and one that went very wrong in 2001-2003 and resulted in the pension fund deficits that persist to this day in many cases.
This is not me being fantastically bullish on fixed interest – you can see from our fund positioning that we are short duration compared to our peers, and also underweight in credit risk. But as long as central banks keep inflation under control (and that will involve at least one more UK rate hike), the interest rate environment could be very different next year, and bonds could start to rally in anticipation of weaker growth. Ten year gilt yields have nearly reached 5.25% (having been at 4% at the start of 2006) – a level that’s starting to look like good, if not compelling, value. But we think it will take a normalisation of the yield curve (with higher long dated bond yields than cash rates) before either we, or our clients, back up the trucks and go heavily overweight in the bond asset class.
We’ve talked a fair bit about the possibility of a significant US slowdown over the course of the next twelve months (see here). Now that we’ve cracked the dark arts of posting charts on our blog, I thought it’s worth showing you the simple yield curve analysis that lies behind both Greenspan’s, and the current Fed’s, thinking. History shows us that when long term bond yields in the US fall below the Fed Funds rate, the US economy slips into recession within a year.
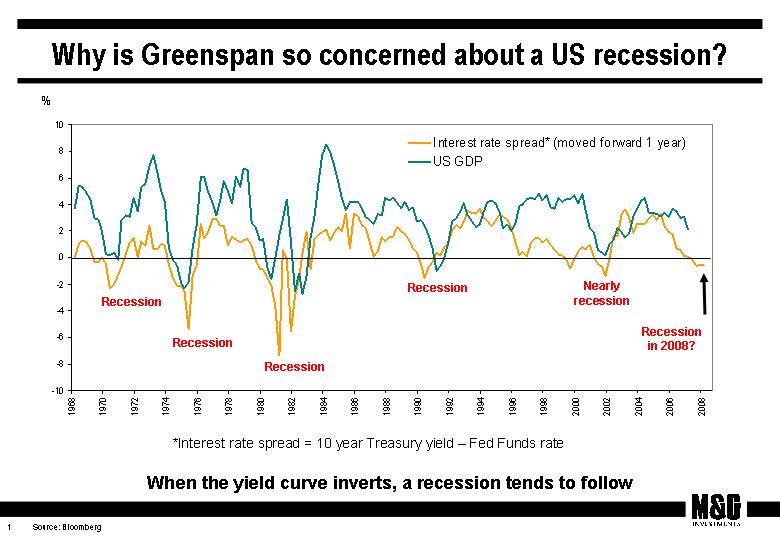
The chart above shows this happening in the early 1970s, mid 1970s, early 1980s, early 1990s, and in 2001 (marked as “Nearly Recession” on the chart – we didn’t see negative GDP growth, but US recessions are “declared”, like Port vintages rather than scientifically measured!). It’s been a very accurate predictor of economic weakness, and the bad news is that we’ve seen an inversion in the yield curve for several months now, implying that there will be a recession next year.
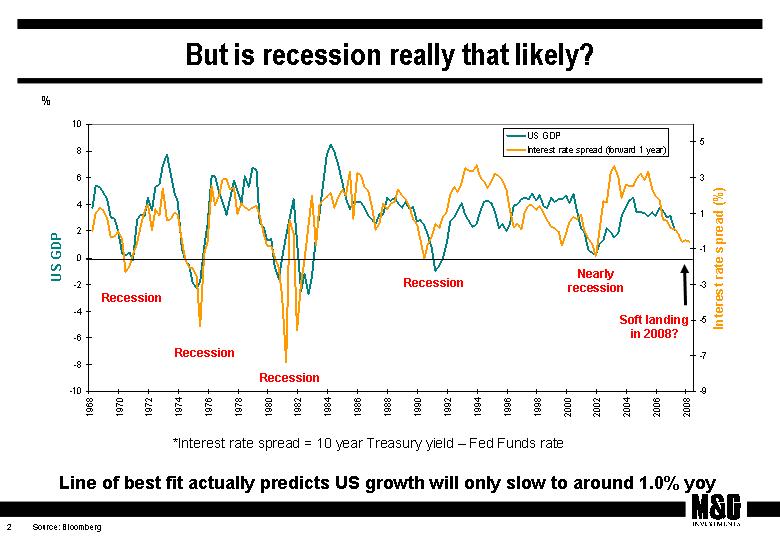
Our next chart is less pessimistic though – it plots the “line of best fit” for the relationship between growth and the yield curve. On this measure you might expect a soft landing in the US next year, with annual GDP growth of perhaps 1%. This is still way below trend growth though (3-4%?), and as such an output gap is opening up – we have already had almost a year of sub-trend growth in the States. In my view this growing output gap is disinflationary (actual growth being below the potential of the economy), and helps explain why core US inflation data have been well behaved lately, and should remain subdued going forwards. This is better news for government bonds, which have been in a bear market.
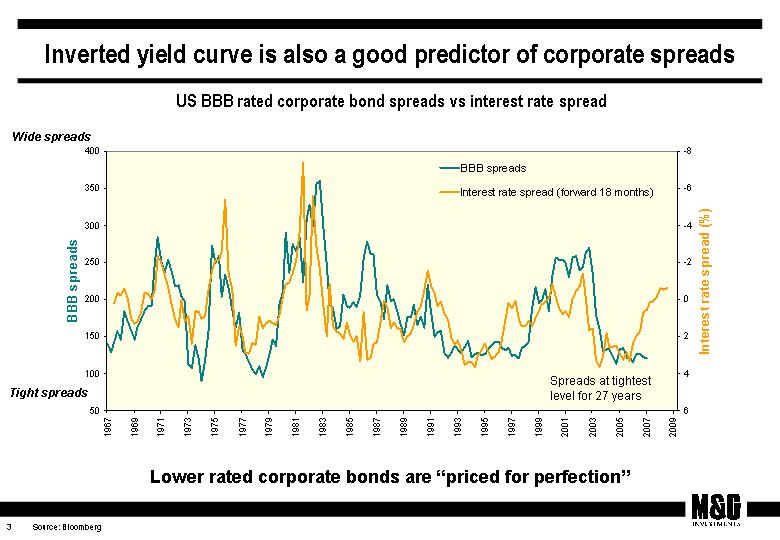
Where we worry most is in the yield curve’s predictive powers for credit spreads. Our third chart shows that BBB rated bonds (the lowest rated investment grade companies) are paying the lowest premium over government bonds for nearly 30 years. If we show the yield curve chart against this (and inverted) we can see that the historical relationship has broken down aggressively in the last couple of years. Given the yield curve is suggesting an economic slow down, we would expect credit spreads to have widened to reflect a riskier world and future higher default rates – but they haven’t done so. The simple model might predict that corporate bond yields should be around 200 bps more than government bond yields, rather than just over 100 bps as they are right now. As a result we think lower rated corporate bonds are expensive, perhaps simply reflecting an excess of demand (for example from the CDO market) in a period when we feel monetary policy has been too loose. Our funds are defensive in terms of our credit exposure – the yield curve has a good predictive track record, and it feels right to draw in one’s horns and take some chips off the table (to mix metaphors) at this time of the economic cycle.
Today’s Bank of England MPC minutes show that the Committee is at last speaking as one. All nine members voted for a quarter of a point hike in rates to 5.5%. It is interesting to see such a strong consensus emerging. This is presumably due to the clearness of evidence presented in the May Inflation Report with regard to the upside inflation risk posed to the UK economy, and maybe the realisation that in order to send a strong message they need to be united behind Mervyn King. Previously no such united front was achieved as the individual members were encouraged to express their individual views, but now with times beginning to get tough, a united MPC is critical to the successful heading off of the inflation threat. This is the first time the Committee has acted in unison to move policy rates since August 2004, a year they worked actively together as a team agreeing unanimously to push rates higher at four separate meetings. I would expect further rates hikes by a hopefully unified MPC as they face the inflationary threat posed by the worldwide loose monetary policy enacted following the turn of the century turmoil in equity markets. Indeed the parting shot from today’s May minutes pointed to further rate rises ahead.
This has not been a great footballing year for the bond team. There are glum faces all round as our seasons have ended in disaster, to an extent that surely cannot be explained by random bad luck. We have, somehow, displeased the gods of football.
Here’s how it finished for our teams:
– David Fancourt’s Watford – relegated from the Premiership
– Richard Woolnough’s Chesterfield – relegated from League 1
– Dan Gardner’s Leeds United – relegated from the Championship
– My Nottingham Forest – humilated by Yeovil in the League 1 playoffs on Friday night
Which just leaves Stefan, and Liverpool FC in the Champions League final on Wednesday, and explains why a betting man would back Milan this time round.
‘Takeover Tuesday’ was a phrase I came across describing several M&A deals announced earlier this week (Thomson & Reuters, Heidelberg & Hanson etc) and no doubt many more will follow in the coming weeks and months. I and other members of the team have written at length about this releveraging of corporate balance sheets, its implications for the corporate bond market and the implications for our funds (see links at bottom of this article).
As a brief reminder, the reasons for this releveraging are relatively low global interest rates, low market volatility, high risk appetite, ever more aggressive and cash heavy private equity funds. Looking forward, healthy corporate balance sheets and equity earnings yields above the real cost of corporate debt all support the continuation of this theme.
In fact a recent research piece by UBS suggests that we are merely mid cycle with a worldwide capacity for over $2 trillion in buyouts during 2007, and interestingly, what was once largely a US phenomenon is now far more balanced globally. But what if, as the data seems to suggest, much if not all of the low hanging fruit has now been picked?
The result is that we are likely to see ever more aggressive leveraged buyouts. Companies that no longer demonstrate many of the characteristics that have historically been considered a prerequisite of an LBO (be those size, positive cash generation, low leverage, defensive margin profiles to name a few) are now very much on the radar for private equity. In a corporate bond market priced to perfection this concerns me and accordingly I remain cautiously invested.
Other stories of interest:
– 26/04/07: Default rate is the lowest in 10 years, but the only way is up
– 30/03/07: Record global M&A activity in Q1
– 28/02/07: The long term effects of PE
– 11/12/06: Letter from New York Part II
– 16/11/06: Private equity continues to dominate the investment headlines
20 years after Gordon Gekko told us that “Greed is Good” in Wall Street, 20th Century Fox has announced that a sequel called “Money Never Sleeps” is in pre-production. Is this the top of the market for equities then? The last film was released just ahead of the 1987 crash.
You used to have to rely on a shoe-shine boy to give you a stock-tip to gauge if the markets were getting frothy, but more recently other sources have been quite good at providing clues. In 2000 Fox piloted “The $treet” and in November last year “Flipping Houses for Dummies” was published in the US.
After last month’s 3.1% print for UK CPI caused Mervyn King to write a letter to the Chancellor, there was a bit of relief today as it fell back to 2.8%, in line with the market’s forecasts. This is still higher than the Bank will be comfortable with, and inflation has now been above the 2% target level for a year. The “old” RPI number also fell back, from 4.8% in March to 4.5% in April. Food and non-alcoholic drinks prices remained strong, as did clothing costs. We’ve talked about this before, but it’s worth mentioning that milk prices are very strong at the moment – this is partly due to weak prices and discounting a year ago (this factor should persist until September), but in the medium term we have wider concerns about upwards pressure on agricultural produce. The high cost of oil makes biofuels more viable (especially as there are big subsidies to farmers to produce ethanol), which in turn makes corn prices rise for other uses (food for both humans and cattle feed), and also means that farmers are likely to turn land used by animals over to grain production – making the price of beef and milk rise too. Elsewhere, and more positively, the electricity price cuts are starting to feed through, and these reduced the CPI number by 0.2%.
Short dated gilts performed well this morning (yields down by 5 bps) , but the market still anticipates that we will get another rate hike in the next few months. Whilst Richard Woolnough (our corporate bond fund manager) thinks this is both inevitable and desirable, I’m a little more cautious. Wage settlements have continued to be subdued (and are below inflation, so real incomes look like they will fall for a second year), and the housing market (outside London at least) appears to be cooling down. Finally, we have had 3 rate hikes in the last year, and the full impact has yet to be felt (monetary policy typically acts with a lag of up to a year), and with a large volume of expiring fixed rate mortgage deals having to be refinanced at higher levels, I fear that the UK consumer is only just starting to feel the pain. So I’m left worrying about both inflation and growth – not a nice place to be.


Sign up to the Bond Vigilantes mailing list to ensure you never miss a great article from our expert Bloggers. We will email all new articles to your inbox, meaning you can stay on top of the world of Bonds.
I confirm that I would like to receive information about Bond Vigilantes and products and services from M&G Securities Limited.
We will use the email address and personal data you have shared with us to send you this information. For existing customers, submitting your contact details and requesting to receive this information from us, will replace any earlier choices you have made in respect of marketing information.
You can unsubscribe from marketing at any time, at which point we will not send any further marketing information to you, by selecting the unsubscribe link in all communications.