


Stagflation? Watch wages
The soaring oil price has meant that UK National newspapers and the trade press are rife with stagflation fears. The fears are understandable – following the 1973 oil crisis, UK inflation surged, reaching an all time high of 26.9% by August 1975. By the beginning of 1979, UK inflation had fallen below 10%, but the 1979 oil crisis helped propel UK inflation back up to 21.9% by May 1980. The oil price shock we are experiencing now is far more severe in nominal terms, and on a similar scale in real terms, so comparisons with the experience of the 1970s are inevitable.
Inflation was nasty in the 1970s because of what’s called a ‘cost-push inflationary spiral’. The surge in the oil price was a supply shock, and represented a jump in costs for companies. Producer prices surged. Companies then shunted these higher costs onto consumers by putting up prices. Consumer prices surged. The workers and trade unions reacted by negotiating higher wages. Higher wages formed another jump in costs for producers, producers prices rose higher, consumer prices rose higher, wage demands were increased, and so on.
Is something similar happening today? So far, it doesn’t appear so. We’ve had a major oil shock, and producer prices have risen sharply. UK Producer Price Inflation (PPI) was 2.4% in August 2007 and leapt up to 8.9% in the year to this May, the highest figure since March 1982. And yet companies are only having limited success in passing this onto consumers. The Bank of England’s official inflation measure of consumer prices is at 3.3% – worryingly high, but only 0.8% higher than a year ago. Inflation according to the Retail Price Index (RPI) was actually 4.3% in May, the same rate as a year earlier. The gap between RPI and PPI is now the biggest since 1975 (as an aside, if companies aren’t able to pass on costs, then it doesn’t bode very well for profit margins or credit quality).
Perhaps even more importantly, the moderately higher consumer prices don’t appear to be translating into higher wages either. Nominal wage growth has barely moved in the last year, and is a bit below the average rate for the last ten years. Real wage growth has in fact been negative in the UK since the second half of 2006. In other words, workers have generally failed to negotiate wages even in line with inflation, let alone in excess of inflation.
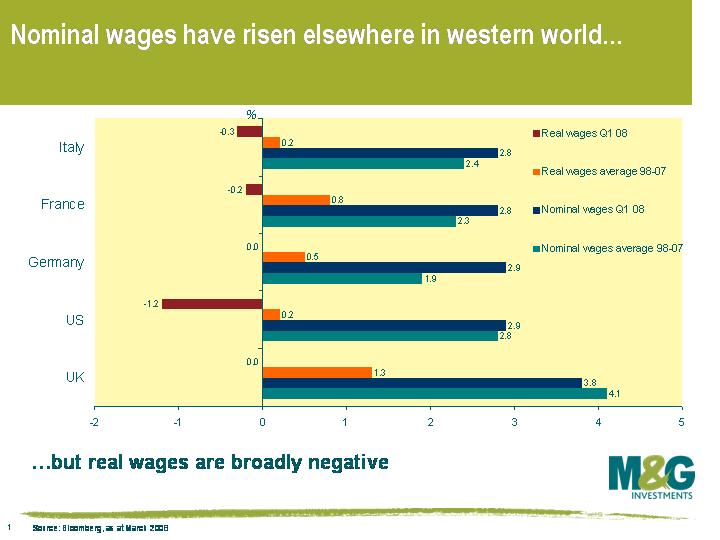
It’s a similar story in the rest of the western world. This chart illustrates that nominal wages have increased at a greater rate in the western economies than in the UK, but real wage growth is either flat or negative (all figures as at end Q1). The economic picture is hardly that of a 1970s style inflationary rout. Labour market reforms (eg reduced trade union power) have combined with greater worker mobility (eg Polish builders) to prevent this oil shock from turning into an inflationary spiral – so far. If long term inflationary expectations rise, which is probably the central banks’ biggest fear, then we may start to see wages creeping up. But for wages to rise from here, workers will need greater negotiating power. This scenario seems unlikely, given the financial deleveraging going on and the rapidly deteriorating UK and global economic outlook. If workers aren’t happy with their pay, there will be soon be quite a few people without jobs who are willing to work for less.
The value of investments will fluctuate, which will cause prices to fall as well as rise and you may not get back the original amount you invested. Past performance is not a guide to future performance.
19 years of comment
Discover historical blogs from our extensive archive with our Blast from the past feature. View the most popular blogs posted this month - 5, 10 or 15 years ago!


Bond Vigilantes
Get Bond Vigilantes updates straight to your inbox