oil
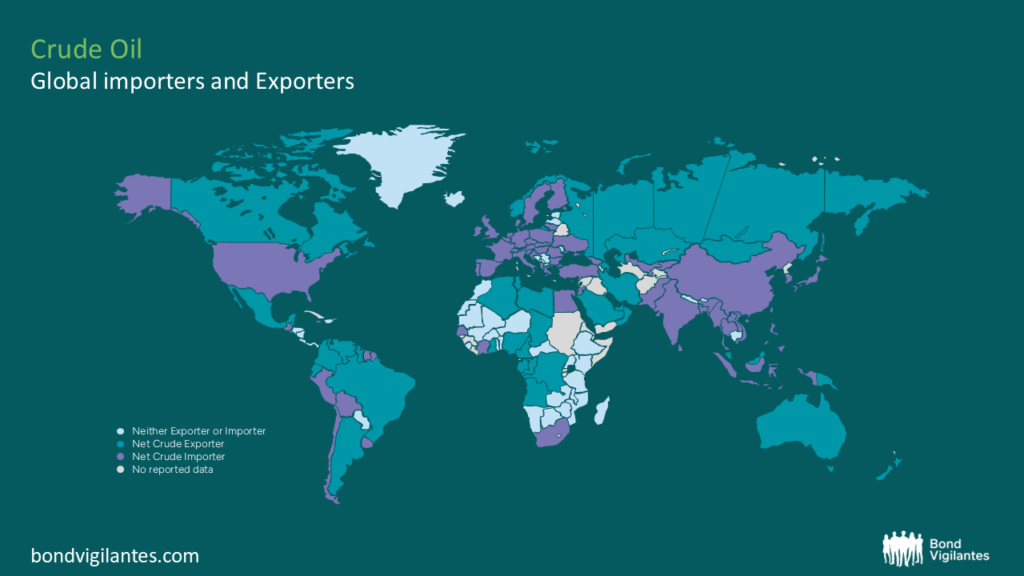
Not all oil-exporting countries are the cracking winners you think.
By Charles de Quinsonas
4 June 2026


Pound sterling is the weakest currency in the world today and we’ve seen a pretty big gilt rally, with 10 year gilt yields rallying 7 basis points to 3.1% at the time of writing, the lowest yield in seven months. The trigger was the minutes from the last Monetary Policy Committee meeting, where the crucial sentences were ‘current weakness of demand growth was likely to persist for longer than previously thought’ and ‘further asset purchases might become warranted if the downside risks to medium-term inflation materialised.’
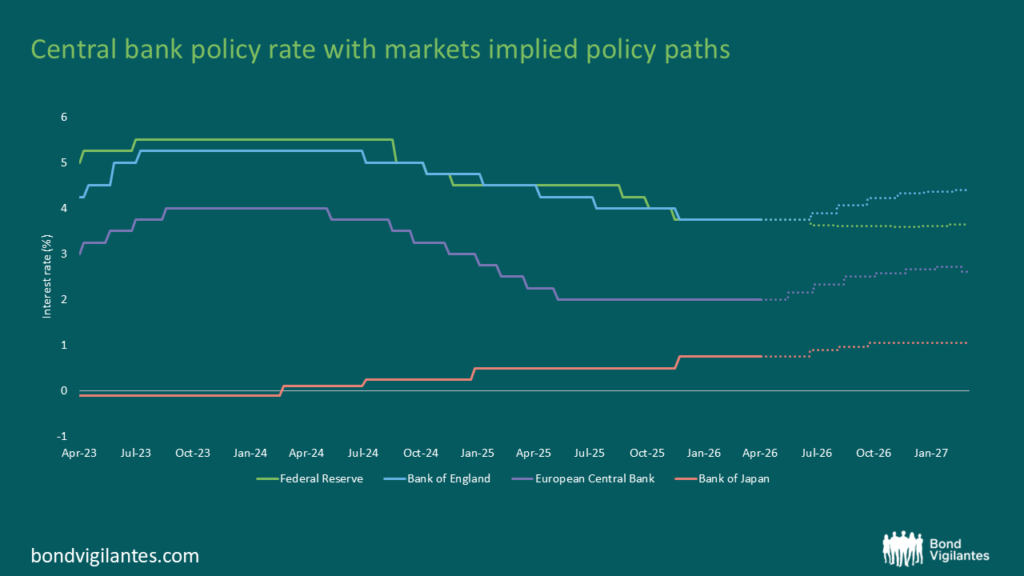
The markets are now pricing in a first rate hike in the UK for August 2012, which is quite incredible if you consider that back in January when I wrote this comment, the markets were pricing in three 0.25% rate hikes this year alone. The chart below shows just how violent things have been, where I’ve taken the market’s rate expectations for the month of August 2012 . Earlier this year the market was almost pricing in five rate hikes, now it’s just one. Anyone who’s been betting on a gilt sell-off or rate hikes will be in a world of pain.

On the subject of pain, and given the rain, we’re having a chuckle about Jim heading off to Glastonbury this afternoon. It turns out that Richard was at Glastonbury in 1983-1985, although he can’t quite remember who he saw or what year it was. I can empathise with what a wet Glastonbury is like, having been to one of the soggiest on record in 1997. Thankfully great music makes you soon forget about the weather though – I was lucky enough to see what’s been voted as the best gig ever, although was unlucky enough to be caught on camera doing a John Redwood, as the BBC kindly reminded me on Friday night when they aired a repeat of the gig (I’m the gormless 17 year old in yellow just after 52 mins).
Guest contributor – Tamara Burnell (Head of Financial Institutions/Sovereign Research, M&G Credit Analysis team)
The Bank for International Settlements (BIS) recently released some fascinating data on the country risk exposure of global banks. For the first time we got some insight into not only which banks own Greek and other peripheral European sovereign, bank and corporate debt, but also who is likely to have written credit default swap (CDS) protection on entities in those countries. We also got some information on the UK banks, including the fact that they currently have USD 1.15 trillion in counterparty exposure on non-credit derivatives, valued at positive replacement value, a whopping one third of the global total, but that’s a story for another day.
There are some uncertainties in the data. For example, CDS written on an obligor is included in the BIS data as a “guarantee extended” to that party, since the ultimate risk is that obligor defaults, but there could also be other types of guarantees such as trade finance letters of credit included within the total figures. And the data only includes CDS protection written by banks, so excludes all the CDS written by insurers, hedge funds and other counterparties.

But it does highlight a few interesting points. Firstly, European banks hold the bulk of direct (cash) exposure to peripheral European borrowers, whereas US banks have little direct exposure. But US banks appear to have written the majority of CDS contracts on peripheral European borrowers, up to three quarters of the total in most cases. The data doesn’t tell us who has bought CDS protection on peripheral European borrowers, but it would be reasonable to assume that EU banks have tried to hedge their direct exposures by buying CDS protection from US banks. Therefore if we get to the point where a peripheral European borrower restructures its debt you would assume that Europe in general would have an incentive to try and trigger CDS protection payouts, whereas the US would typically want to avoid an event of restructuring because its banks would then potentially have to make big payouts. On this issue, the general counsel of derivative industry body International Swaps and Derivatives Association (ISDA) David Geen said that a debt exchange that pushed out maturities would not typically trigger payment of CDS contracts.
This highlights how political any decisions over triggering events of default, in either the underlying bonds or the CDS contracts, will be in practice. No wonder there have been press reports that the US has put pressure on EU politicians to deal with Greece in a way that avoids triggering CDS at all costs.
But surely the triggering of sovereign CDS should be a “market issue” rather than a political one? Well, unfortunately, CDS contracts have proven impossible to draft in a watertight way, as it’s impossible to predict how events of default will happen in practice – and you can’t legislate for a change in legislation. Over the years we’ve seen numerous changes to ISDA CDS protocols, as individual restructuring events have shown up flaws in CDS contracts. And sovereigns, of course, are the ultimate writers of legislation, so it’s in their own hands whether they change their own laws in such a way as to trigger an event of default on either the CDS or the underlying debt. For example, if Greece changed its domestic laws in a way that it altered the maturity date of all its debt, would that be enforceable and would that trigger a CDS event of restructuring? How about if it gave extra security to new lenders, while leaving the old bonds unchanged? Or imposed a special tax on principal or interest payments on sovereign debt? The functioning of bank CDS has already been called into question by the way the Irish government has changed the terms of the underlying debt, extending the maturity date so that there are no longer any relevant bonds outstanding in the reference maturity buckets used in CDS contracts.
Unfortunately, not only did plenty of market participants think that sovereign CDS was a good idea, either as a way to take risk, or as a hedge against existing risks, but regulators also endorsed the idea that CDS could offer some sort of risk hedge, and therefore allow banks to reduce the amount of capital they held against their counterparty risk exposures. If we get any precedent cases that show CDS protection not to work in practice and provide the hedge it was expected to, potentially the solvency of the banking system comes under question all over again.
The last thing that financial markets needed this morning was a wobbly Spanish auction, but that’s exactly what they got. Spain’s borrowing costs have soared, with 10 year Spanish government bond yields jumping a massive 20bps at one point. On the face of it the auctions looked OK with the 19s covered 2.13 times and 26s covered 2.57 times, but despite the much higher yields on offer, the Spanish treasury only managed to shift €1.5bn of the 2026s with the market looking for between €1.75bn and €2bn. One bank reported zero buying interest from their clients, and with the auction not well placed, dealers have been selling into the market.
It’s difficult to focus on the long term when there’s such a big short term risk of a horrible air shot as the authorities collectively try to kick the proverbial can, but attached is an updated chart from a previous blog showing Spain’s long term borrowing costs versus its nominal growth rate. Spain’s long term borrowing costs greatly exceed its current nominal growth levels. Its potential long term real growth rate may now be as little as 1%, and with the ECB desperate to demonstrate its inflation fighting credentials, Spanish nominal growth potential could quite feasibly be below 3%. For Spain’s debt levels to stabilise, either Spain’s borrowing costs will need to halve or it will have to run a large sustained budget surplus to make up this gap.
Given that it’s exceptionally unlikely that Spain is in any position to run a sustained budget surplus (the Spanish regions are expected to report bigger deficits than previously forecast), Spain’s public debt/GDP ratio will steadily deteriorate. The firewall that markets thought existed between Greece, Portugal and Ireland and the much bigger and systemic economies of Spain and Italy is in danger of being an illusion.

Finally, Spanish 5y CDS finished May at 253.5bps according to Bloomberg, resulting in a tie for last month’s competition. Martin Price from Sarasin was the lucky fellow to be drawn out of the hat so a signed copy of Reinhart and Rogoff’s book is in the post to you. Incidentally, Spain 5y CDS has blown out to over 310bps as at today.
Don’t get me wrong, I am not sounding the death knell of the post QE (1) credit rally. But a couple of pretty important and recent developments have got me asking: should I be chipping away at some of the higher beta corporate bonds I own?
Let’s start with the good news. Companies broadly are in fantastic fundamental positions, having responded to the crisis by cutting costs and debt and building up cash, and then subsequently by taking advantage of ultra low interest rates by borrowing for the long term. These strong fundamentals have not only led to very low default rates, but also augur for continued low default rates in the future, on account of the very low financing costs many of them have for the next 5, 10 or even 30 years. (I am not, here, talking about banks!)
Along with the above strength in companies’ balance sheets though, we have witnessed unprecedented amounts of monetary and fiscal policy stimulus. Both of these combined have served deliberately, substantially and artificially to support aggregate demand and consumption. And let’s not forget that consumption still makes up close to a 70% share of our western economies. So, with companies in strong financial health, and with consumption supported by unheralded levels of low interest rates, tax breaks and handouts, it is little surprise that the result has been nothing short of a nirvana for corporate credit.
But is this set to change? Austerity measures are starting to bite here in the UK. And in Europe interest rates have begun their upward trajectory (and there looks, from where I’m sitting, to be a pretty good chance of another hike in July, or not long thereafter). All over the West the extraordinary policy stimulus is starting to be withdrawn, albeit rightly at an incredibly tentative pace. And even though we are only a few months into this process, economic data has turned negative, fast (see Mike’s blog). Government bond markets in the US, Europe and the UK have watched this data in horror, and have started to rally again as the growth picture worsens.
Corporate credit, though, has remained remarkably resilient, only moving a few basis points wider whilst the data has turned negatively, and whilst the government bond markets have rallied substantially. This is illustrated in the following chart, which maps the economic surprises index Mike blogged about recently over broad investment grade credit spread performance.

*our thanks go to Hans Lorenzen at Citi Investment Research and Analysis for this slide.
If, as I do, you worry about the macroeconomic picture in a world where interest rate rises, government spending cuts and higher taxes are all detrimentally impacting consumption and economic growth, then perhaps there is a good chance that investment grade credit has to start to react to the change in the economic releases? But which way? If credit is still too cheap and spreads too wide, then a worsening macroeconomic picture could see a flight to quality out of higher credit risk names into relative safe havens in the investment grade universe. However, if credit is not too cheap, there is a good chance a more bleak world order could see investment grade spreads sell off. In other words, it might not matter how strong companies are fundamentally, if people are not spending their money on their products or services anymore.
After Jim’s blog last week on rising food prices, I thought it might be interesting to have a quick look at the latest global “Food Outlook” report issued last week by the Food and Agriculture Organisation (FAO) of the United Nations. By the FAO’s own admission it is a “critical time to evaluate current developments in global food markets”. It does not make for comforting reading.
The FAO note that global food import bills are set to reach record levels in 2011. This is due to a rapid increase in prices for commodities (exacerbated by USD weakness), increased import volumes and solid economic growth. The chart below documents the FAO’s forecasts for the increase in food import bills by type.

It is forecast that the rising price of foodstuffs will lead to vulnerable countries spending around 18 percent of all their expenditures on imports, compared to a global average of around 7 percent.
The increase in food import bills to USD 1.3 trillion represents a 30 percent increase for less developed countries. This is a rise similar to that experienced in 2007-2008. During that period, Indonesia, Cambodia, Jordan, Bangladesh, Egypt and Haiti experienced mass protests and a number of countries introduced food export bans. From this, it is reasonable to assume that the political tensions that have buffeted international financial markets in 2011 will not let up if the FAO’s forecasts for food prices come to fruition. It is one thing if people cannot afford to run their cars because of high petrol costs, quite another if they can’t put food on the table.

Looking at food consumption prices, the FAO note that over the past twelve months, the cost of the typical food basket around the world has risen by 48 percent in real terms. The main cause of the increase has been a sustained increase in the price of grains and broad based increases in the costs of other commodities, especially livestock and vegetable oils. As well as an increase in demand from emerging market countries, supply constraints like environmental disasters such as floods in Australia, drought and hot weather across China and Europe, and the devastating earthquake in Japan have caused upward pressure on prices.
The report concludes that agricultural prices will be high and volatile for the remainder of the year and into 2012. This is not what the global consumer – developed or emerging – wanted to hear. The implications of rising food prices will present a real and significant challenge for governments, central banks and financial markets alike.
Why is UK inflation running at a much higher rate than European inflation? The UK’s CPI is 4.5% compared with 2.7% in Europe. One answer might be food inflation, a major portion of the overall CPI baskets (11% in the UK, 15% in the Eurozone – add in alcohol and both are a little higher).

The chart below shows that the UK rate of food inflation is systematically higher than that in Europe. At the moment the year on year increase is 4.7% compared with 2%, and at times the difference has been much higher. There are times when you might explain this through £ weakness feeding into imported food prices, but the chart includes periods of both currency strength and weakness. What else might explain structurally higher food inflation in the UK?

Well the chart below from Mark Capleton of SocGen might be at least part of the answer. It shows earnings per share (EPS) growth for UK and European food retailers. When food price inflation started to moderate post the last shock in 2008, European food retailers cut prices. In the UK the supermarkets realised that they had pricing power and kept raising them; this resulted in the strong relative profitability that they enjoyed. There might be other factors involved – the UK supermarkets have massively diversified into non-food goods (everything from clothing to DVDs to insurance), but it does look like UK consumers are being hit by the lack of competition in the food retail sector.

The BBC Watchdog survey from 2009 shows that only 2% of respondents were “very dissatisfied” with their supermarket (about half were actively “very satisfied”). Yet they claim that price is the most important thing in their choice of shop. Stockholm Syndrome is a “paradoxical psychological phenomenon wherein hostages express empathy and have positive feelings towards their captors”.
The last month has been a horror show for the world’s biggest economy, and things are getting even worse if data released today is anything to go by. It seems that almost every bit of data about the health of the US economy has disappointed expectations recently. US house prices have fallen by more than 5% year on year, pending home sales have collapsed and existing home sales disappointed, the trend of improving jobless claims has arrested, Q1 GDP wasn’t revised upwards by the 0.4% forecast, durables goods orders shrank, manufacturing surveys from Philadelphia Fed, Richmond Fed and Chicago Fed were all very disappointing. And that’s just in the last week and a bit.
The string of disappointing economic data can be captured in the Citigroup Economic Surprise Index for the United States. A reading above zero reflects a positive economic data surprise, while a reading below zero constitutes a negative surprise. The sharp swing from positive territory at the beginning of this year into negative territory is almost as bad as the collapse in economic data that began in October 2008.
I’ve overlaid the economic data surprise index with US 10 year Treasury yields (note that the surprise index data is as at the end of yesterday, so it doesn’t even include the pretty horrific ADP employment data and ISM manufacturing data from today). The correlation between the economic surprise index and Treasury yields is very close, so the lesson is that whatever your long term macro views are regarding hyperinflation vs deflation or the risk of the US defaulting (and I’m not denying any of these are possible), the reality is that if you want to have a view about government bond prices, the best thing you can do is look at the economic data to see what’s actually going on. And right now, the economic data is suggesting that however measly you may think a 3% yield is on a ten year treasury, the yield should probably be a fair bit lower given what’s going on in the US economy. You’ve also got to wonder at what point the markets for risky assets start noticing too.
QE3 anybody?


Sign up to the Bond Vigilantes mailing list to ensure you never miss a great article from our expert Bloggers. We will email all new articles to your inbox, meaning you can stay on top of the world of Bonds.
I confirm that I would like to receive information about Bond Vigilantes and products and services from M&G Securities Limited.
We will use the email address and personal data you have shared with us to send you this information. For existing customers, submitting your contact details and requesting to receive this information from us, will replace any earlier choices you have made in respect of marketing information.
You can unsubscribe from marketing at any time, at which point we will not send any further marketing information to you, by selecting the unsubscribe link in all communications.