
Will the Fed push EM over the edge?
We’ve been very worried about emerging markets for a couple of years, initially because of surging portfolio flows, better prospects for the US dollar and historically tight valuations (see The new Big Short – EM debt, not so safe, Sep 2011). But increasingly recently our concern has been driven by deteriorating EM fundamentals (see Why we love the US dollar, and worry about EM currencies, Jan 2013). A combination of miscommunicated and misconstrued Fed speak in May brought things to a head, and EM debt crashed in May to July (see EM debt funds hit by record daily outflow – is this a tremor, or is this ‘The Big One’? Jun 2013), although the asset class has since recovered roughly half of the losses. So where are we at now?
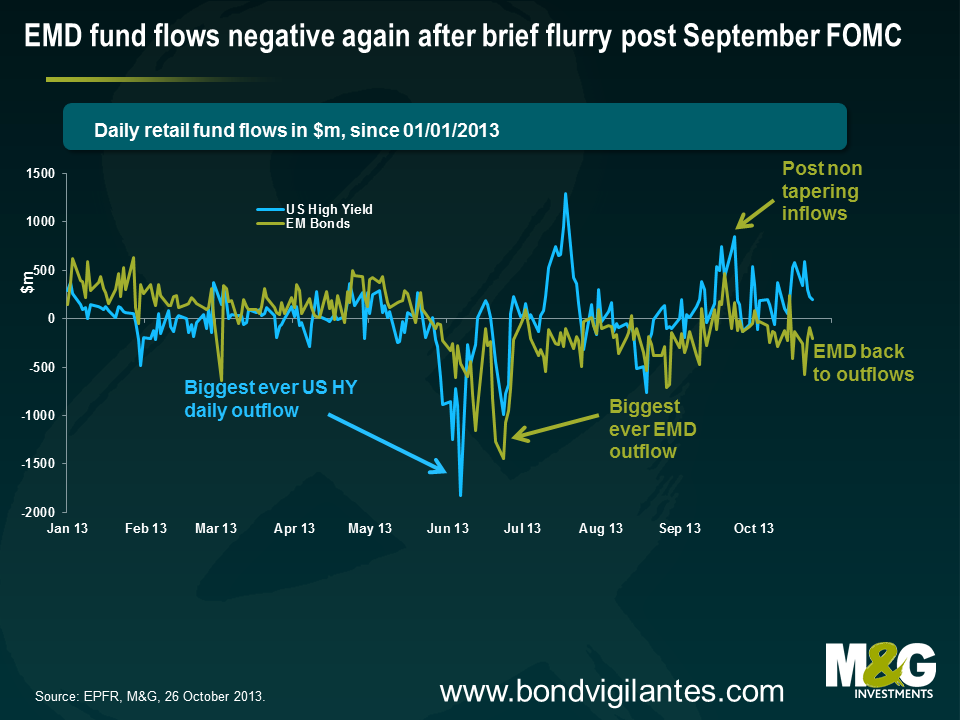
First up, fund flow data. Outflows from EM debt funds abated in July and August, briefly turned into inflows in mid September immediately following the non-tapering decision, but have since broadly returned to outflows (see chart below). Outflows from EM debt funds since May 23rd have been a very chunky $28bn, over $3bn of which have come since September 23rd.
However, as explained in the blog comment from June, EPFR’s now much-quoted fund flow data only apply to mutual funds, and while you get an idea of what the picture looks like, it’s only a small part of the picture. Just to emphasise this point, it has now become apparent that a significant part of the EMFX sell was probably due to central banks. The IMF’s quarterly Cofer database, which provides (limited) data on reserves’ currency composition, stated that advanced economy central banks’ holdings of “other currencies” fell by a whopping $27bn in Q2, where much of this ‘other’ bucket is likely to have been liquid EM currencies. Maybe half of this fall was driven by valuation effects, but half was probably dumping of EM FX reserves. Limitations of the EPFR data are also apparent given that there has been a slow bleed from EMD mutual funds this month, but that doesn’t really tally with market pricing given that EM debt and EM FX have been edging higher in October. An increase in risk appetite among EMD fund managers could account for this differential, although it’s more likely that institutional investors and other investors have been net buyers.
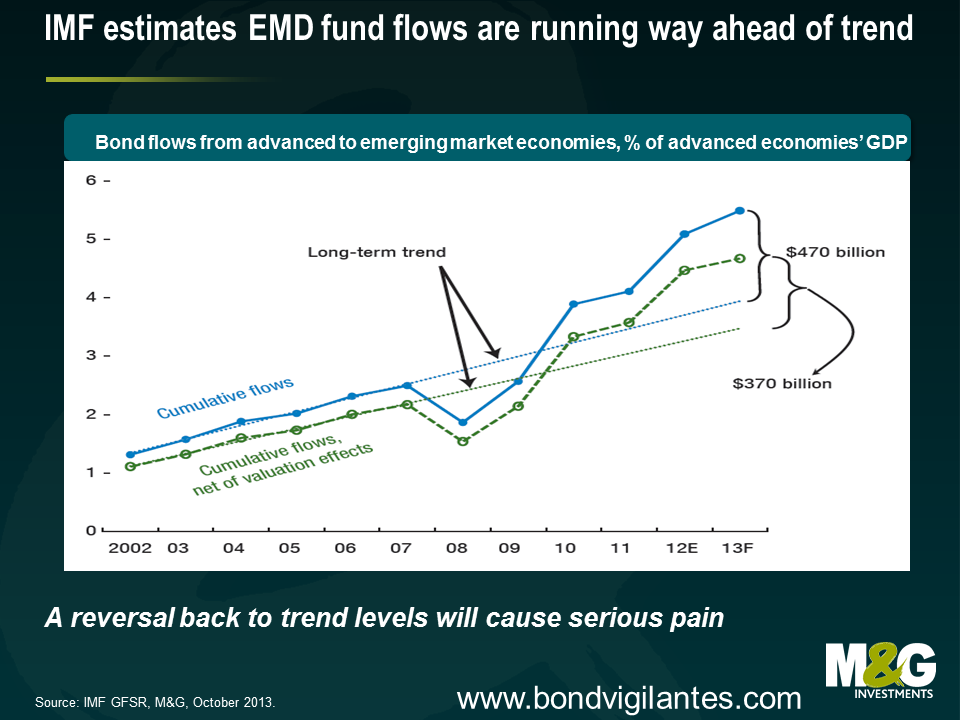
A relative stabilisation in fund flows doesn’t mean that planet EM is fine again. The recent IMF/World Bank meetings had a heavy EM focus, which followed on from the negative tone towards EM in the latest editions of the IMF’s flagship World Economic Outlook and Global Financial Stability Report (GFSR). The IMF again voiced concerns about the magnitude of the EM portfolio flows, and the chart below suggests that flows have deviated substantially from what the IMF believes is a gentle trend upwards in investors’ allocation to EM. A reversal of recent years’ inflows back towards the long term trend level would cause considerable pain, and while $28bn of outflows since May 23rd may sound like a lot, this is only equivalent to the inflows in the year up to May 23rd, let alone the inflows from the preceding years. As explained in Chapter 1 of the GFSR, which is highly recommended reading, foreign investors have crowded into local emerging markets but market liquidity has deteriorated, making an exit more difficult.
What now for EM debt? Your outlook will likely depend on how you weight and assess the different performance drivers for the asset class. There has been a heated debate in recent years on whether emerging market portfolio flows are driven primarily by so called ‘push factors’ (eg QE and associated negative developed country real interest rates pushing capital into countries where rates are higher), or whether flows are driven by ‘pull factors’ (eg domestic factors such as reforms or financial liberalisation). EM countries have tended to argue that push factors dominate, with Brazilian Finance Minister Mantega going as far as to accuse G3 policymakers of currency manipulation, while Fed Chairman Bernanke and future Chairman (Chairperson?) Yellen have argued that EM countries should let their currencies appreciate, although a recent Federal Reserve paper highlights both push and pull factors.
Number crunching from the IMF suggests that it is the EM policy makers who have the stronger arguments. In April’s GFSR, the IMF’s bond pricing model indicated that stimulative US monetary policy and lower global risk (itself partly attributable to the actions of advanced economy central banks) together accounted for virtually all of the 400 basis point reduction in hard currency sovereign debt from Dec 2008-Dec 2012, as measured by JP Morgan EMBI Global Index. Meanwhile, external factors were found to have accounted for about two thirds of the EM local currency yield tightening over this period. ‘Push factors’ therefore appear to dominate ‘pull factors’, something I agree with and have previously alluded to.
The relevance of external factors shouldn’t be a major surprise for EM investors given that the arguments are not remotely new. Roubini and Frankel have previously argued that macroeconomic policies in industrialised countries have always had an enormous effect on emerging markets. Easy monetary policy and a low global cost of capital in developed countries (as measured by low real interest rates) in the 1970s meant that developing countries found it easy to finance their large current account deficits, but the US monetary contraction of 1980-2 pushed up nominal and real interest rates, helping to precipitate the international debt crisis of the 1980s. In the early 1990s, interest rates in the US and other industrialised countries were once again low; investors looked around for places to earn higher returns, and rediscovered emerging markets. Mexico received large portfolio inflows, enabling it to finance its large current account deficit, but the Fed’s 1994 rate hikes and subsequent higher real interest rates caused a reversal of the flows and gave rise to the Tequila Crisis.
High real interest rates were maintained through the mid 1990s, the US dollar strengthened. Countries pegged to the US dollar lost competitiveness, saw external vulnerabilities grow and in 1997 we had the Asian financial crisis. In 1998, Russia succumbed to an artificially high fixed exchange rate, chronic fiscal deficits and low commodity prices (which were perhaps due in part to the high developed country real interest rates). A loosening of US monetary policy in the second half of 1998 alleviated the pressure on EM countries, but a sharp tightening in US monetary policy in 1999-2000 was arguably the final nail in the coffin for Argentina, and only IMF intervention prevented the burial of the rest of Latin America. The low US real interest rates/yields that have been in place ever since 2001-02 and particularly since 2009, together with the weak US dollar, have sparked not only large, but also uniquely sustained, portfolio flows into EM. [This is of course a gross simplification of the crises of the last 30 years, and there were also numerous domestic factors that explained why some countries were hit much harder than others, but it’s difficult to dispute that US monetary policy has played a major role in the direction of capital flows on aggregate].
It’s starting to feel like Groundhog Day. Soaring US real and nominal yields from May through to August were accompanied by an EM rout. The tentative rally in EM over the last month has been accompanied by lower US real and nominal yields. Correlation does not imply causation, but investors should probably be concerned by the potential for US nominal and real yields to move higher as easy monetary policy is unwound. The date for the great monetary policy unwind is being pushed back, with consensus now for US QE tapering in March 2014, and if anything I’d expect it to be pushed back further given that it is hard to see how we’re going to avoid a rerun of the recent US political farce early next year. But this should only be a postponement of US monetary tightening, not a cancellation.
This year has been painful for EM, but it has been more a ‘spasmodic stall’ in capital flows rather than a fully fledged ‘sudden stop’. If, or perhaps when, the day of reckoning finally comes and US monetary policy is tightened, EM investors should be very concerned with EM countries’ growing vulnerability to portfolio outflows and ‘sudden stops’. [Guillermo Calvo coined the phrase ‘sudden stop’, and he and Carmen Reinhart have written extensively on the phenomenon, eg see ‘When Capital Inflows Come to a Sudden Stop: Consequences and Policy Options (2000)’]
History suggests that a good old fashioned ‘sudden stop’ would be accompanied by banking and particularly currency crises in a number of countries. There are numerous variables you can use to assess external vulnerabilities, and many people have been busy doing precisely that since May (eg see a write-up on a piece from Nomura). In January I highlighted some of the lead indicators of EM crises regularly cited in the academic literature, namely measures of FX reserves, real effective exchange rates, credit growth, GDP and current account balances.
To be fair, a few of these crisis indicators are pointing to a slight improvement. Most notably, FX reserves are on the rise again – JP Morgan has highlighted that FX reserves of a basket of EM countries excluding China fell by $40bn between April and July, but that decline was fully reversed through August and September, even accounting for the fall in the US dollar (which pushes up the USD value of non-USD holdings).
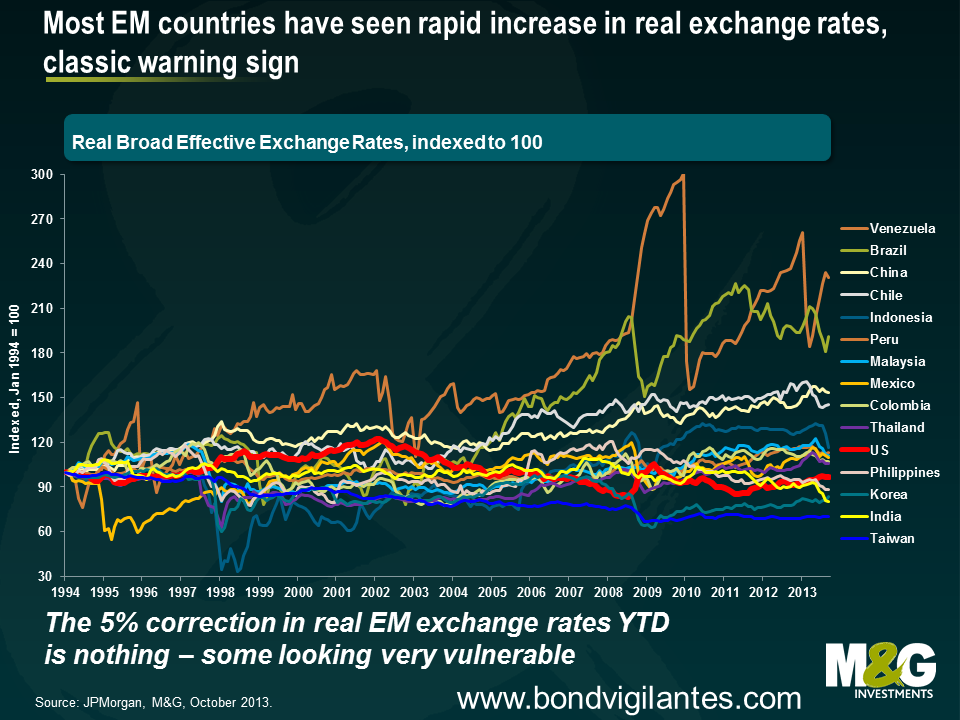
Currencies of a number of EM countries have seen a sizeable and much needed nominal adjustment, although it’s important to highlight that while nominal exchange rates have fallen, the fact that inflation rates tend to be a lot higher in EM than in DM means that real exchange rates have dropped only perhaps 5% on average, which still leaves the majority of EM currencies looking overvalued and in need of significant further adjustment. In particular, Brazil has much further to go to unwind some of the huge appreciation of 2003-2011. Venezuela looks in serious trouble, which is what you expect given it is trying to maintain a peg to the US dollar at the same time as its official inflation rate has soared to 49.4% (Venezuela’s FX reserves have halved in five years, and are at the lowest levels since 2004).
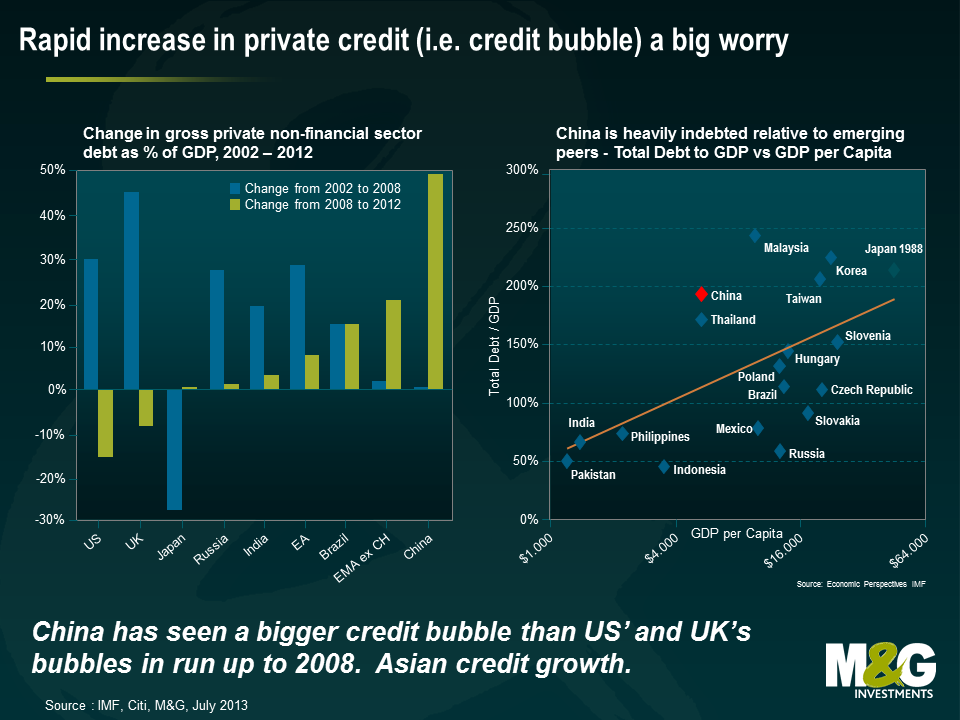
However some of these lead indicators are just as worrying as they were in January. While the rapid credit growth rates of 2009-2012 have eased a little in most countries, perhaps partly on the back of weaker portfolio flows, there’s no evidence of deleveraging. Indeed, China is as addicted to its credit bubble as ever, while Turkish credit growth is inexplicably re-accelerating. The charts below put China’s credit bubble into perspective, where the increase in China’s private debt/GDP ratio since 2008 is bigger than the US’ and the UK’s credit bubbles in the years running up to 2008, and China’s total debt/GDP ratio is approaching Japan’s ratio in 1988. A banking crisis in China at some point looks inevitable. Although a banking crisis will put a dent in China’s GDP growth, it shouldn’t be catastrophic for the economy in light of existing capital controls and high domestic savings (these savings will just be used to plug the holes in banks’ balance sheets). The pain will likely be felt more in China’s key trade partners, particularly in those most reliant on China’s surging and unsustainable investment levels, and of those, particularly the countries with growing external vulnerabilities (see If China’s economy rebalances and growth slows, as it surely must, then who’s screwed? Mar 2013).
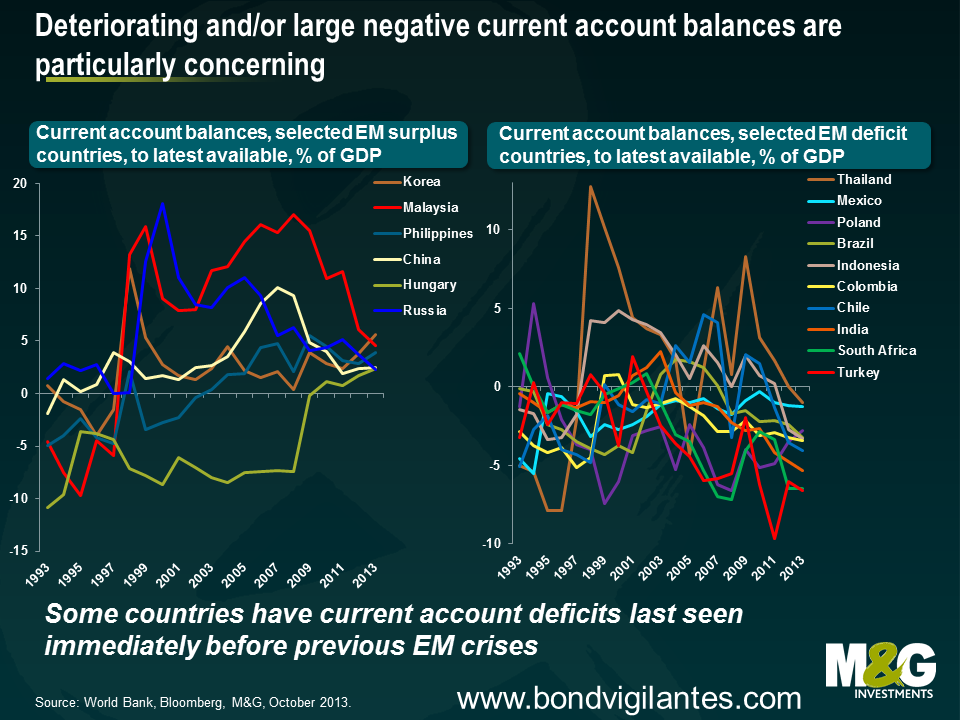
And probably the biggest concern is the rapidly deteriorating current account balances for almost all EM countries, where a country’s current account is essentially a broad measure of its trade balance. If you look through historical financial crises, large and/or sustained current account deficits are a feature that appears time and time again. Current account deficits were a feature of the LatAm debt crisis of the early 1980s, the Exchange Rate Mechanism (ERM) crisis in 1992-3, Mexico in 1994, Asia in 1997, (arguably) Russia in 1998, Argentina and LatAm generally in 1999-02, Eastern Europe and many developed countries in the run up to 2008, and the Eurozone periphery (2010-?). Current account deficits are not by themselves necessarily ‘bad’ since by definition a current account deficit in one country must be balanced by a current account surplus elsewhere, and a country ought to be running a current account deficit and therefore attracting foreign capital if it has a young population and superior investment prospects. Foreign investors will willingly fund a current account deficit if they expect their investment will result in future surpluses, but no country is able to run a current account deficit (which is the same as accumulating foreign debt) indefinitely – if foreigners see a deficit as unsustainable then a currency crisis is likely. Maybe Mongolia’s or Mozambique’s current account deficits of almost 40% last year can be justified by the high expected returns from the huge mining/energy investment in the countries. Or maybe not.
But consistently large deficits, or rapidly deteriorating current account balances, can be indicative that things aren’t quite right, and that’s how many EM countries look to me today. Morgan Stanley coined the catchy term the ‘fragile five‘ to describe the large EM countries with the most obvious external imbalances (Indonesia, South Africa, Brazil, Turkey and India), and this is a term I gather those countries understandably aren’t overly impressed with (BRICS sounded so much nicer…). Unfortunately the list of fragile EM countries runs considerably longer than just these five countries.
The chart below highlights a select bunch of EM countries that are running current account surpluses and deficits. Some countries look OK – the Philippines and Korea appear to be in healthy positions on this measure with stable surpluses. Hungary has moved from running a large deficit to a small surplus, although Hungary needs to run sustained surpluses to make up for the period of very large deficits pre 2009*.
Almost all the other surplus countries have seen fairly spectacular declines in their current account surpluses. Malaysia’s surplus has plummeted from 18% of GDP in Q1 2009 to 4.6% in Q2 2013, while Russia, which is regularly cited as being among the least externally vulnerable EM countries, has seen its current account surplus steadily decline from over 10% in 2006 down to 2.3% in Q2 this year, a number last seen in Q2 1997, a year before it defaulted. Russia’s deteriorating current account is all the more alarming given that the historically high oil price should be resulting in large surpluses. Financing even a small current account deficit (which by definition would need financing from abroad) could cause Russia serious problems, and a lower oil price could also result in grave fiscal stresses given that the breakeven oil price needed to balance Russia’s budget has soared from $50-55/ barrel to about $118/ barrel in the last five years.
Many (but not all) current account deficit countries are looking grimmer still. A number of countries are seeing current account deficits as large or larger than they have historically experienced immediately preceding their previous financial crises. Turkey has long had a very large current account deficit, and while it has improved from almost 10% of GDP in 2011 to 6.6% in Q2 this year, the central bank’s reluctance to hike rates in response to a renewed credit bubble suggests this will again deteriorate. Despite the sharp drop in the rand, South Africa’s economic data has not improved – its current account deficit was 6.5% of GDP, and Q3 is likely to be very weak given the awful trade data in July and August. I continue to think South Africa should be rated junk, as argued in a blog from last year (the modelled 10% drop in the rand actually turned out to be overly optimistic!). India’s chronic twin deficits have been well documented – its current account deteriorated sharply in recent years, hitting a record 5.4% in Q4 2012 and with only a marginal improvement seen since then. As previously highlighted, Indonesia’s current account is now back to where it was in Q2 1997, immediately before the outbreak of the Asian financial crisis. Thailand’s previously large current account surplus has moved into deficit. Latin American countries tend to run reasonable sized deficits (as they generally should, given their stage of development), although Brazil and Chile have moved right into the danger zone.**
Another concern is contagion risk. If the Fed does tighten monetary policy next year, investors withdraw from EM en masse and capital flows back to the US, and/or China blows up and takes EM down with it, then an EM crisis this time around could look very different to previous ones. EM crises have historically been regional in nature – the international debt crisis of the early 1980s is a possible exception, but even then it was Latin America that bore the brunt. The big difference this time around is that a material portion of the portfolio flows are from dedicated global EM funds and large ‘Total Return’ style global bond strategies, as opposed to flows from banks. If these funds withdraw from EM countries, or to be more precise, if the end investors in these funds liquidate their holdings in the funds, then the funds will be forced sellers of not only the countries that may be in trouble at that point in time, but will also be forced sellers of those countries that aren’t necessarily in trouble. In fact, in a time of crisis, they may only be able to sell down the better quality more liquid positions such as Mexico in order to meet redemptions. So if a crisis does develop then you’ll probably see a correlation of close to one across EM countries. And not just between EM countries – the fate of, say, Ireland, may now be tied to that of Ukraine, Ghana, Mexico, and Malaysia.
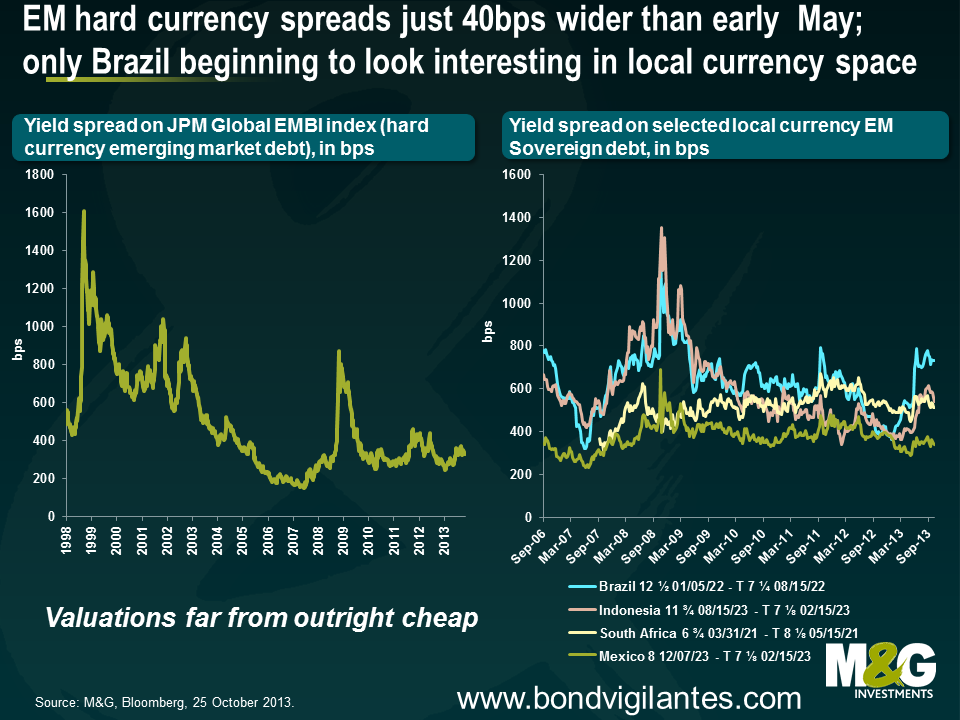
That’s the rather lengthy ‘story’ for emerging markets, but what about the most important thing – valuations? In June I concluded that following the sharp sell-off, EM debt offered better value than a few months before, and it therefore made sense to be less bearish on an asset class that we have long argued has been in a bubble (but that didn’t mean I was bullish). As mentioned above, EMD has now recovered roughly half the sharp losses of May and June, but given very little has fundamentally changed over the period, it makes sense to be more concerned about valuations again.
The charts below illustrate the yield spread pick up over US Treasuries on hard currency (as shown by the JPM EMBI Global spread) and EM local currency (as shown by 10 year yields on Brazil, Indonesia and Mexico). Even though a number of EM macroeconomic indicators are at or approaching historical crisis levels, spreads on hard currency EM debt are not far off the tights (although at least you are exposed to the US dollar, whose valuation I like). EM local currency yields are also offering an unspectacular yield pick up over US treasuries, but here you have to contend with a lot of EM currencies with arguably shaky valuations, and you additionally face the risk of some countries being forced to run pro-cyclical monetary policy (i.e. EM central banks hiking rates in the face of weakening domestic demand in order to prevent a disorderly FX sell-off , the result of which sees local currency bond yields rising, as seen recently in Brazil, India, Indonesia).
So rising EM external vulnerabilities, combined with what are now fairly unattractive valuations, means that EM debt could potentially be teetering over the edge. Would the Fed give EM the final shove though?
On the one hand, while US domestic demand was considerably stronger in the 1990s than today, it’s interesting that during the really bad EM crises in 1997 & 1998, US GDP didn’t wobble at all, not remotely. US GDP was 5% in 1998, the strongest year since 1984, and 1997 saw the US economy grow at a not too shabby 4.4%. The Fed Funds rate didn’t budge at all in 1997 through the Asian crisis, and it wasn’t until after the Russian crisis in September 1998 that the Fed cut interest rates from 5.5% to 5.25% (and then again in October and November down to 4.75%), although this was a combination of domestic and foreign factors. Rates were actually back at 5.5% by November 1999 and continued higher to 6.5% by May 2000.
On the other hand, EM countries now account for about half of global GDP, so a direct hit to EM could loop quickly back to the US. This is something that the Federal Reserve has become acutely aware of in recent months (in case they weren’t already) given the extreme moves in EM asset prices. And in both the June and September press conferences, Bernanke was keen to stress that the Fed has lots of economists whose sole job is to assess the global impact of US monetary policy, and what’s good for the US economy is good for EM. That said, if US growth hits 3% next year, which is possible, it’s tricky to see how the Fed won’t start tightening monetary policy regardless of what EM is up to.
But the deteriorating EM current accounts may mean that at least a few EM countries won’t have to wait for a push from the Fed; they may topple over by themselves. A deteriorating current account deficit means that a country needs to attract ever increasing capital from abroad to fund this deficit. If developed countries’ appeal as investment destinations improves at the same time that a country such as South Africa’s appeal is deteriorating due to deteriorating economic fundamentals or other domestic factors, then investors will begin to question the sustainability of the deficits, resulting in a balance of payments crisis. EM investors need to be compensated for these risks in the form of higher yields, but in the majority of cases, yields do not appear sufficiently high, which therefore makes me more bearish on EM debt valuations.
*A current account deficit is an annual ‘flow’ number; Hungary’s ‘stock’ still looks ugly thanks to years of deficits, as shown by its Net International Investment Position. Hungary’s current account surplus is one of the few things Hungary has going for it. For more see previous blog.
** I’m still slightly baffled as to why Mexico HASN’T had a credit bubble given the huge portfolio inflows, the relative strength of its banking sector and a very steep yield curve, and it remains a favoured EM play (see Mexico – a rare EM country that we love from Feb 2012, although I’d downgrade ‘love’ to ‘like’ now given the massive inflows of the last 18 months and less attractive valuations versus its EM peers).
The value of investments will fluctuate, which will cause prices to fall as well as rise and you may not get back the original amount you invested. Past performance is not a guide to future performance.
17 years of comment
Discover historical blogs from our extensive archive with our Blast from the past feature. View the most popular blogs posted this month - 5, 10 or 15 years ago!


Bond Vigilantes
Get Bond Vigilantes updates straight to your inbox