
A shifting Beveridge Curve – Does the US have a long term structural unemployment problem?
I am sure that many of us are familiar with some of the better known economic theories concerning unemployment which have previously been discussed or alluded to on this blog e.g. Okun’s Law and the Taylor Rule, but perhaps a lesser known theory (which has been receiving growing attention from economists in recent times), is the Beveridge Curve.
Using data on job vacancies and unemployment, the Beveridge Curve indicates how efficient an economy is at matching unemployed workers to job vacancies and can indicate where in the business cycle an economy sits. Looking specifically at data for the US from December 2000 onwards, the jobs market behaved as you’d expect; changes in the supply or demand for labour causes movement along the curve (this is particularly apparent during the highlighted recessionary periods). But what is particularly interesting – and glaringly obvious – is the shift which occurred post June 2009. The looping movement “back up the curve” is less surprising as after an economic contraction, this would be precisely what you would expect during a recovery period (i.e. falling unemployment teamed with an increase in the job vacancy rate as firms start to hire again).
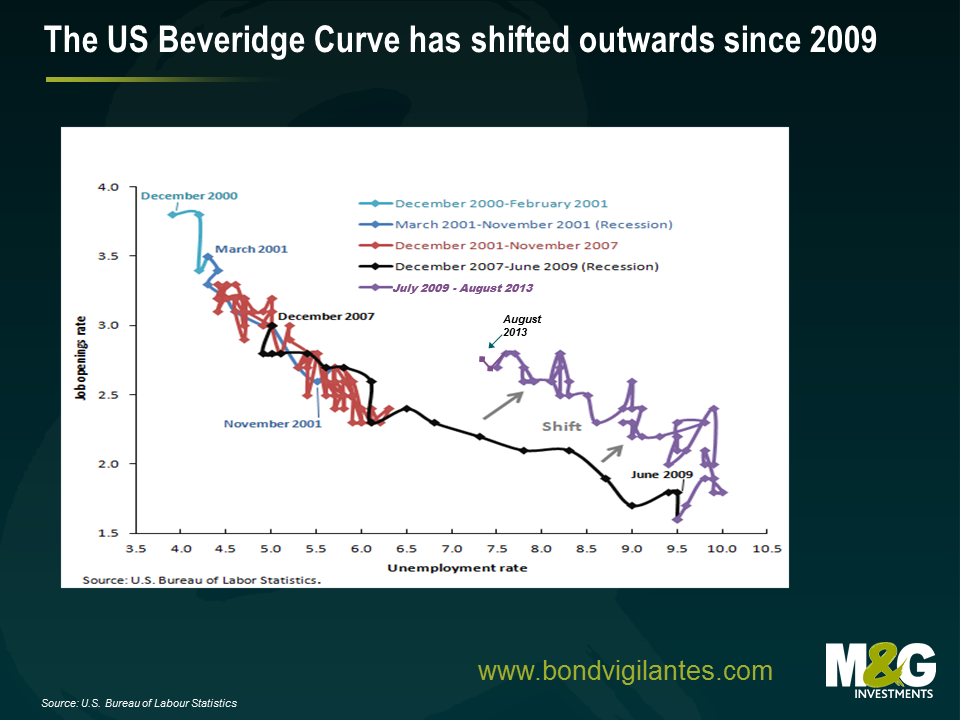
But what could have caused this shift in the Beveridge curve, which if it remains, could imply a long term increase in structural unemployment?
1) Inefficiency. The shift is essentially indicative of an increase in the job vacancy rate. So perhaps we could argue that there has been a short-term reduction in the efficiency of job matching due to labour market conditions. Indeed, this inefficiency could in part have arisen from a decrease in labour mobility, linked to the US housing market. Since home prices are still below the pre-crisis peak, this could result in reluctance from jobseekers to sell their homes, which could in turn geographically limit their search. If this were true, in time the curve would be expected to shift back in line as the housing market recovers and jobs and workers get matched more quickly.
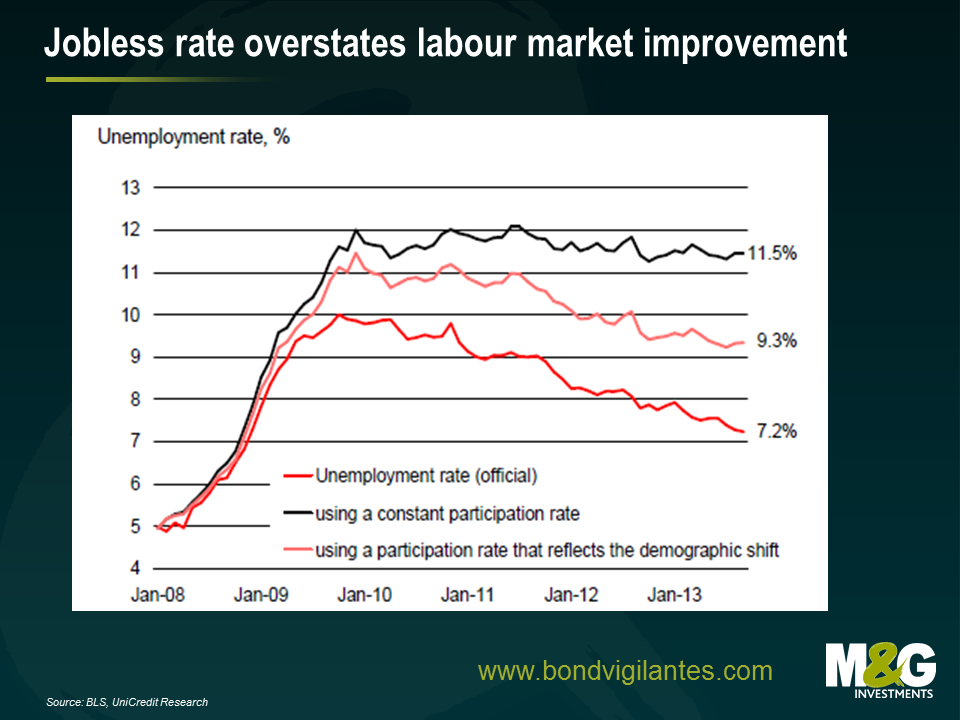
2) The labour force participation rate. Perhaps the shift has been caused by the post-crisis increase in unemployment. As the theory would have it, as the number of job seekers increases relative to the population, this would cause an outward shift of the Beveridge Curve. The US has however witnessed the exact opposite since 2009 – a fall in both the unemployment and labour force participation rates. On this point, research from Unicredit suggests that the fall in the latter is causing the unemployment rate to be understated were it not for the decline in the labour force participation rate, unemployment would stand at 11.5%. This signifies that the US may well have an underlying structural unemployment problem that is currently being ignored.
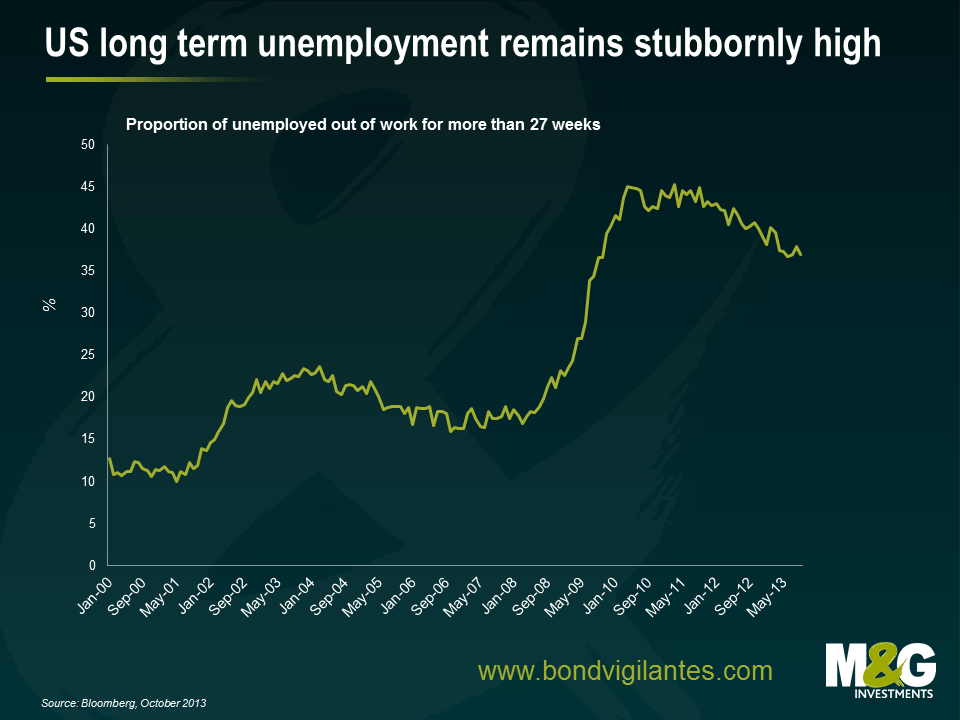
3) Long term unemployment. If caused by a fundamental mismatch between an employer’s requirements and an employee’s skill set (which deteriorates as more and more time is spent out of work), long term unemployment could cause the Beveridge Curve to shift outwards. Indeed, the proportion of unemployed workers who have been without work for 27 weeks upwards has increased since June 2009 and remains high, suggesting that a long term structural shift may have occurred in the US.
4) Increasing frictional unemployment. To cause an outward shift of the Beveridge Curve, frictional unemployment – the time period between jobs, caused by redundancies and resignations – would have to increase. Although this could have caused the initial shift, to my mind, this argument is inconsistent with longevity of the shift. If the shift were solely due to frictional unemployment, this impact should have been eroded since 2009 as labour market performance gained some ground.
5) Economic and policy uncertainty. I think it’s fair to say that the US has seen its fair share of economic uncertainty since 2009 and significant political headwinds in 2013 alone. Firstly, with regards to the sequestration earlier this year which saw fiscal contraction manifest most notably via the expiration of the temporary payroll tax and budget caps. Secondly (although more recently so this will not yet be reflected in the data), political headwinds have continued in the form of the prolonged Government shutdown. As such, these headwinds could potentially explain the lasting effect of the shift, in 2013 at least.
On the whole, the outward shift of the Beveridge Curve indicates that there has been a significant change in the US labour market. The key question however is whether or not this shift will prove to be a short term phenomenon that will erode over time as the US recovery strengthens. If we suppose that the shift is temporary and that the US will revert to norm, reading off the graph, this suggests that unemployment for August 2013 should have been in the region of 5.5%, which is well below the Fed’s trigger level to raise interest rates. On the other hand, is this too optimistic and have we instead witnessed a long term shift that is here to stay? The Beveridge Curve is one to watch.
The value of investments will fluctuate, which will cause prices to fall as well as rise and you may not get back the original amount you invested. Past performance is not a guide to future performance.
17 years of comment
Discover historical blogs from our extensive archive with our Blast from the past feature. View the most popular blogs posted this month - 5, 10 or 15 years ago!


Bond Vigilantes
Get Bond Vigilantes updates straight to your inbox