One of our local burrito vendors has been advertising a new 8% bond to its customer base. The company, Chilango, wants to raise up to £3m to fund expansion of its chain in central London. This will be done via a crowd sourced retail offering that’s already drawn some interesting coverage in the financial press. Having performed some extensive due diligence on the company’s products as a team, we can safely say they make a pretty good burrito. However, when we compare the bond to the traditional institutional high yield market, we have some concerns that investors should be aware of.
- Disclosure – a typical high yield bond offering memorandum (the document that sets out the rules of the issue, its risk and all the necessary historical financial disclosure) can be several hundred pages long. Producing this is a very time intensive and expensive process, but a valuable one for producing a host of useful information for potential investors. Additionally, a law firm and an accounting firm typically sign off on this document, effectively staking their reputation and incurring litigation risk based on the veracity of the information disclosed.
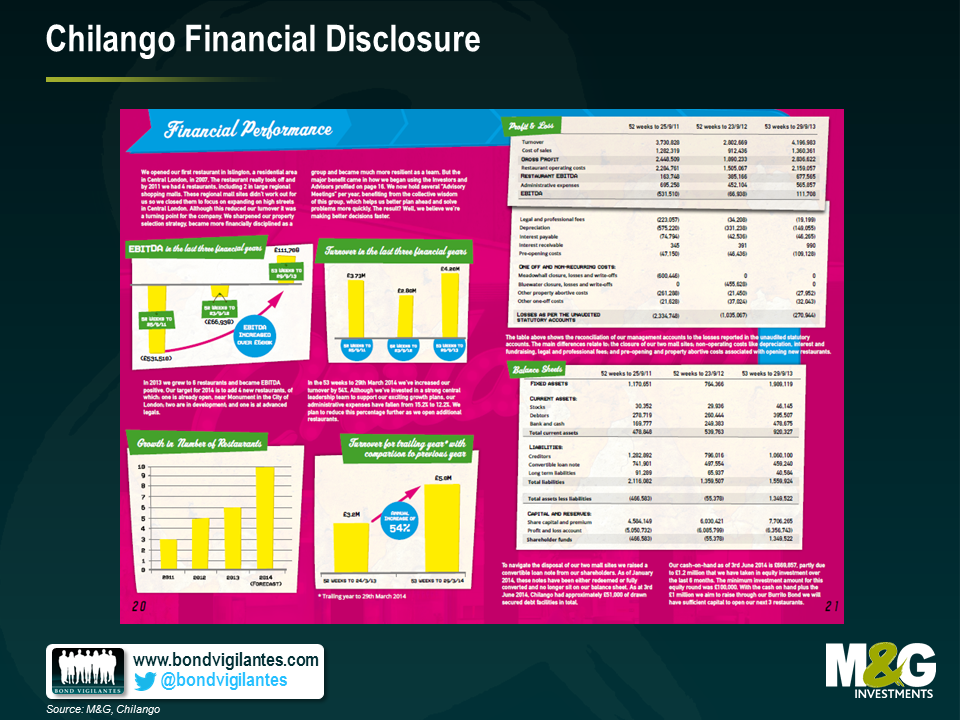
In contrast, the Chilango’s document is 33 pages long, with some fairly superficial financial disclosure. The photo below illustrates this comparative informational disadvantage and the relative lack of depth in financial information compared to a recent institutional high yield bond offering from Altice.

- Financial Risk – there are two big potential concerns here. Firstly, the starting leverage for the bonds is potentially quite high. Using some admittedly finger in the air assumptions regarding the potential cash flow of each new outlet opened (a necessary approach given poor disclosure), leverage could be around 6.0x Net Debt/EBITDA in 2015. This is certainly at the riskier end of the high yield spectrum. The second major concern is that we don’t know for certain how much debt the company will raise. Chilango state that they target at least £1m in this issue, but are willing to raise up to £3m, leverage is likely to be north of 10x (again this is a best guess). All this means the bonds would in our opinion get at best a CCC rating, right at the riskiest end of the credit rating spectrum for sub-investment grade bonds.
- Security – Chilango state very clearly that these bonds will be unsecured instruments. This means that in the event of a default, the creditors will rank behind any secured creditors. There appears to be limited existing secured creditors, but we see nothing in the documentation to prevent a layer of new secured debt being raised ahead of these notes (something that is a common covenant in institutional bonds deals). Consequently, it’s prudent to assume that in a default situation the recovery value of the bonds is likely to be significantly below face value. This equity-like downside means investors should demand an equity-like return in our view.
- Call Protection – these bonds are redeemable at the option of the issuer at any time. Consequently, investor returns could be materially curtailed due to the lack of call protection. Call protection is the premium over face value the investors get when the issuing company redeems the debt early (their call option). Thus some of the benefit also accrues to the bondholder. Take the following return profile:
8% Bond, Callable at Par Years Outstanding Total Return 1 8% 2 17% 3 26% 4 36% If the plan to open new branches goes well, the bond investor should be happy right? Wrong. If this happens, the company may well look like a less risky prospect and will be able to raise debt finance more cheaply. Let’s say a bank offers them a loan at 5%, they could then redeem the 8% bond early, diminishing the total return to bondholders (as per above), and save £90,000 a year on interest costs per year (assuming they issued £3m bonds). Again, call protection is a common feature of the institutional high yield market which protects investors in these situations.
- Liquidity – these are non-transferrable bonds. This means that a) the company does not have to file a full offering memorandum hence the lack of disclosure and b) it will not be possible to buy or sell the bonds in a secondary market. This is more akin to a bilateral loan between an individual investor and the company, with the investor in it for the long haul. Consequently, an investor will neither be able to easily manage their risk exposure nor will they be able to take profits should they so wish before the bond is redeemed.
- Value – we can see that there are many risks – but to be fair that is the nature of high yield investing. So the real question is, “is 8% sufficient compensation for this risk”. The good news is that this bond has a unique bonus coupon in the form of a free burrito a week for anyone prepared to invest £10,000. At current prices, this equates to 3.63% additional coupon (a steak, prawn or pork burrito with extra guacamole is £6.99), so an all-in coupon of 11.63% (8% cash + 3.63% burrito).We’d argue that a “burrito fatigue factor” should be applied, simply because you may not want a burrito every week and you will probably not be physically near a Chilango every week to cash in this extra coupon. A 75% factor feels about right, which reduces the burrito coupon to 2.72% and the all-in return to 10.72%. So is 10.72% a fair price? To get a sense of this we can look at some GBP dominated CCC rated institutional bonds in other asset light industries
Bond Price Yield Phones 4 U 10% 2019 90.5 12.7% Towergate 10.5% 2019 98.5 10.9% Matalan 8.875% 2020 101.5 8.5% Average: 10.7% By coincidence, the all in coupon of 10.7% is bang in line with the average of this (very limited) group of comparable bonds. However, I’d argue that the Chilango bonds should be significantly cheaper than the bonds above due to higher leverage, no liquidity, no call protection and the lack of disclosure. What should this differential be? Again, there is no scientific answer, but our starting point would probably be in the 15-20% range, and only then with some more certainty around the potential maturity of the bond and the ability to share in the future success of the company.
So, much as though we would all enjoy the tasty weekly coupons, our view is that like many of the so-called “retail” or “mini” bond offerings, the Chilango burrito bonds stack up poorly against some of the current opportunities in the institutional high yield market.
M&G has no financial interest in seeing this issue succeed or fail, either directly or indirectly.
On 29th April, Energy Future Holdings Corp (the energy business formerly known as TXU) filed for Chapt 11 bankruptcy, listing $49.7bn in debt liabilities. This came after several months of back and forth negotiations between various creditors and the owners of the business. As such the filing was widely expected and the market had been pricing this in.
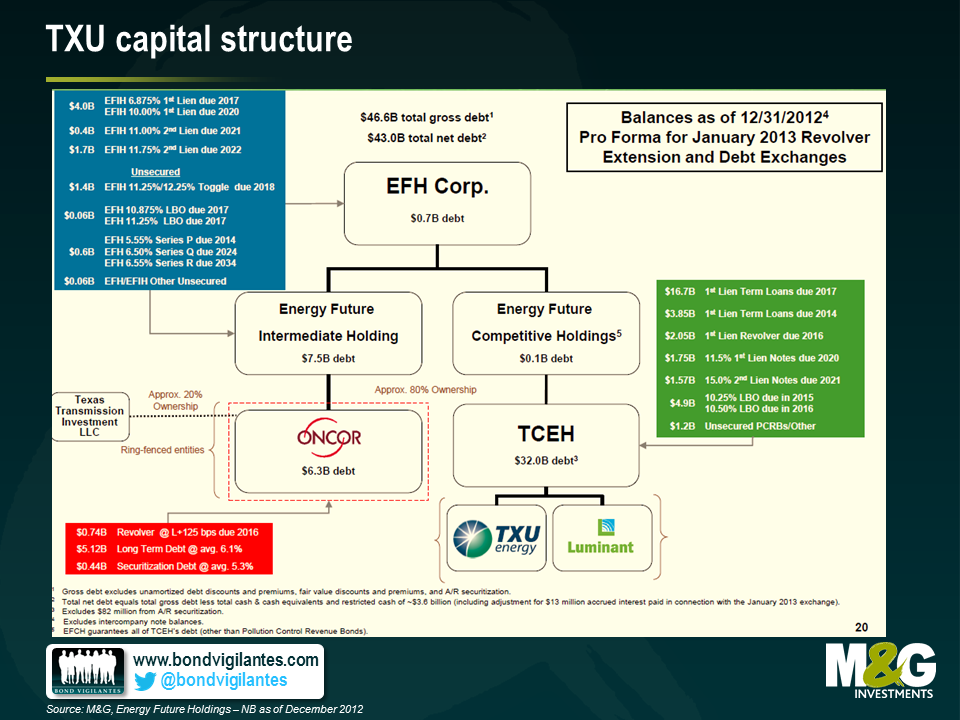
One thing that was quite an eye-opener, however, was the huge range of recovery values on the various tranches of debt issued by the business. Part of this was due to the inherent complexity of the company’s capital structure. The company had 14 separate major bond issues, issued out of a range of different entities with differing claims on the company’s various assets as shown below:
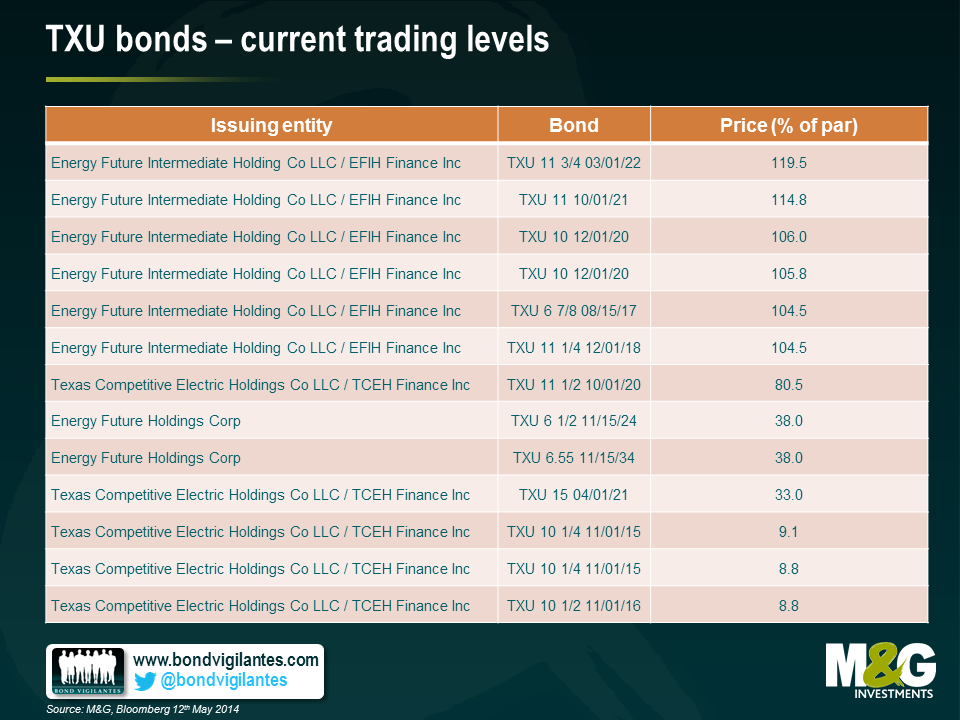
This great diversity of debt and different legal entities in the capital structure has meant similar differentiation in recovery values for the bonds. Below are some of the trading levels we currently see in the market for the more liquid bonds. At one end of the extreme, the TXU 11.75% 2022’s are currently trading at 119.5% of face value whilst the TXU 10.5% 2016’s languish at 8.8 cents in the dollar. The difference in price reflects the bonds’ relative position in the queue of claims for the company’s assets.
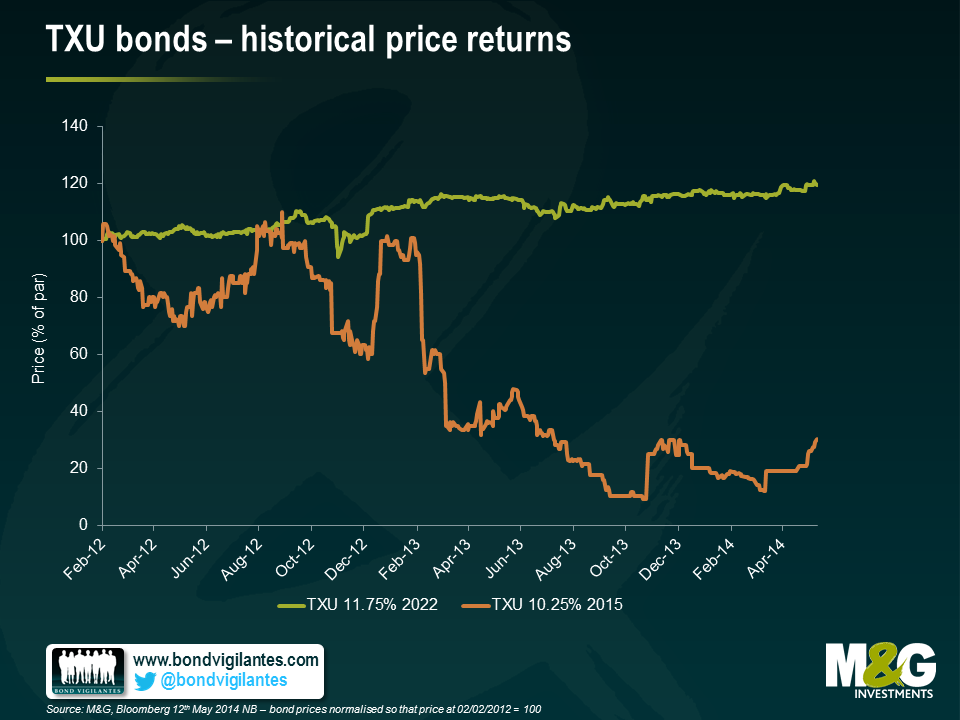
The difference of experience in terms of total returns from these bonds is also stark. Holders of the 11.75% 2022 bonds enjoyed a capital return of c 20% over the past two years (on top of the 11.75% coupon each year), whereas holders of the 10.25% 2015 bonds have been hit with a capital loss of c.70%.
What we think this illustrates very well is that seniority and position in a capital structure has a major impact when determining potential downside for high yield investors. Indeed this factor can often be more important in the event of a default than the quality and credit worthiness of the underlying borrower. Additionally, and somewhat counter-intuitively, it also shows that bondholders can still experience positive returns even if the business they have lent to goes bankrupt.
Whilst the TXU bankruptcy is one of the echoes of the last LBO frenzy of 2006 and 2007, we believe that where you invest in the capital structure will also be important going forward. When default rates do eventually rise from their currently low levels, investing in bonds that rank senior in a capital structure will be one way to limit the potential downside of a high yield portfolio.
A few of the M&G bond team recently visited New York and Chicago on a research trip. We put together a short video to share some of our thoughts regarding US credit markets. A particular focus is the U.S. high yield market where we highlight some sector themes. We also consider the potential impact on U.S. credit spreads when the Fed starts to raise interest rates.
Regardless of your opinion on the merit of the ECB’s policy, there is little doubt that the efficacy of Mario Draghi’s various statements and comments over the past 2 years has been radical. Indeed there are several signs in the bond markets that investors believe the crisis is over. Here are some examples:
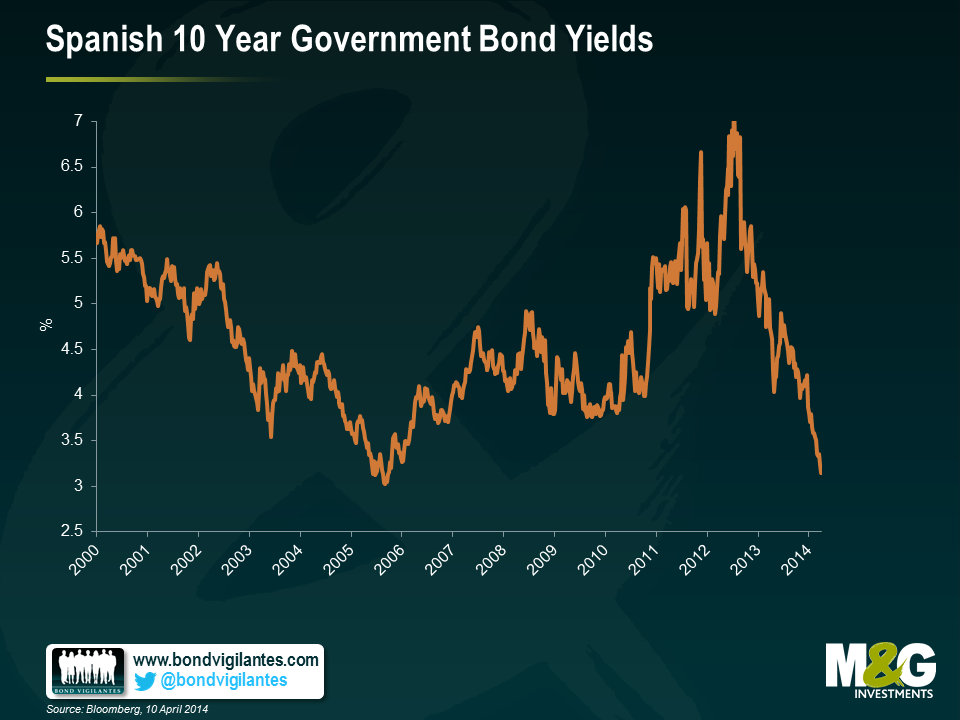
1) Spanish 10 yr yields have fallen to 3.2%, this is lower than at any time since 2006, well before the crisis hit, having peaked at around 6.9% in 2012. This is an impressive recovery, almost as impressive as …
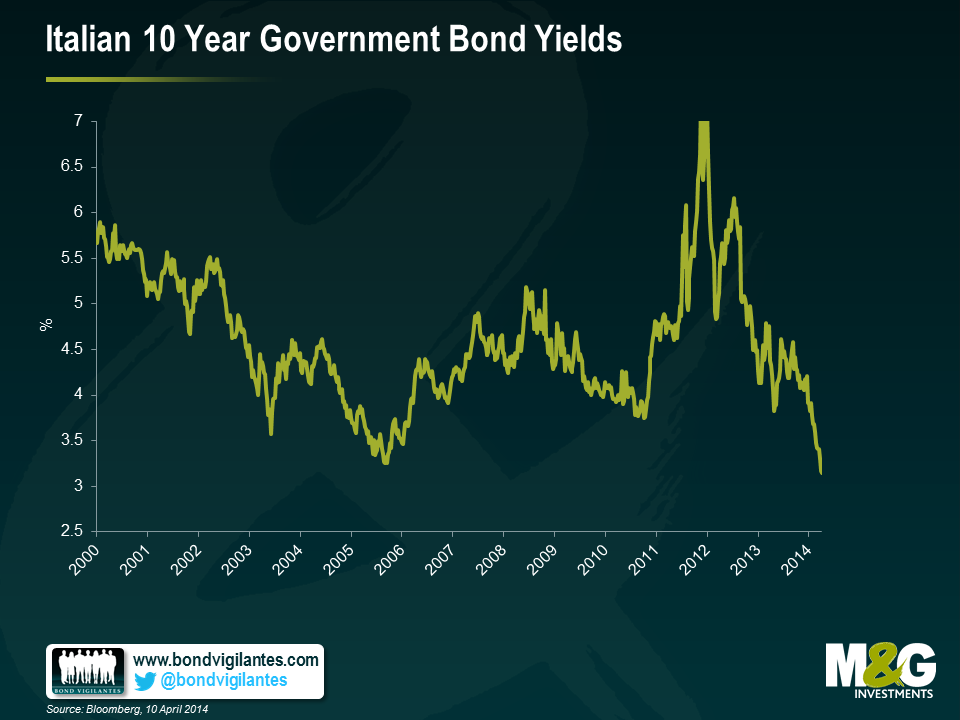
2) The fall in Italian 10 year bond yields, which have hit new 10 year lows of 3.15%, lower than any time since 2000. The peak was 7.1% in December 2011. To put this in context, US 10 year yields were at 3% as recently as January this year.
3) Last month, Bank of Ireland issued €750m of covered bonds (bonds backed by a collateral pool of mortgages), maturing in 2019 with a coupon of 1.75%. These bonds now trade above par, with a yield to maturity of 1.5%. The market is not pricing in any material risk premium relating to the Irish housing market.
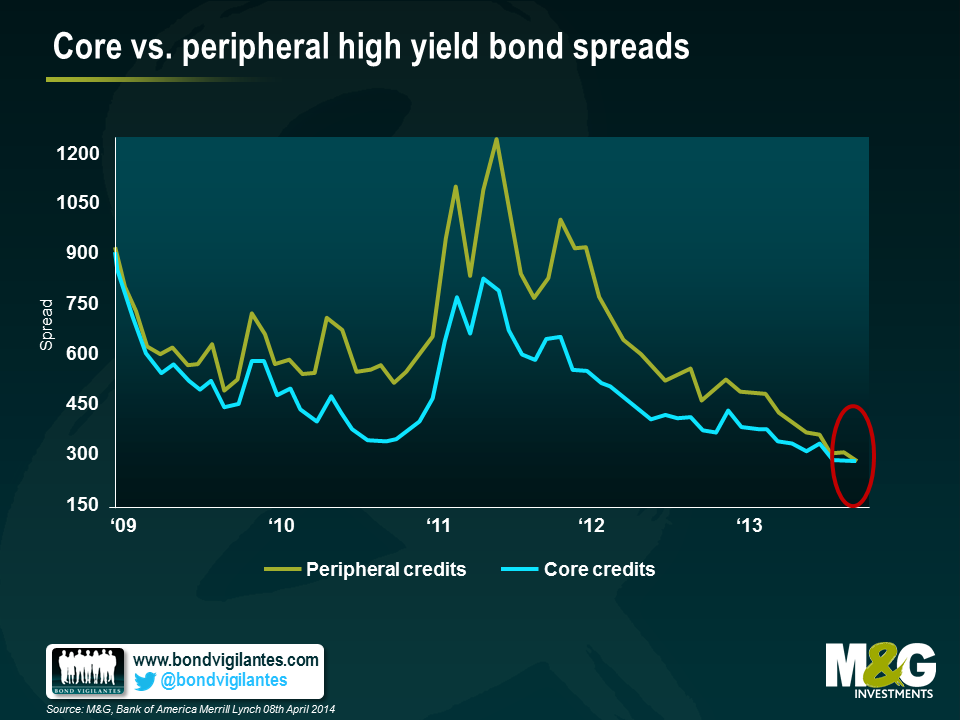
4) There is no longer any risk premium within the high yield market for peripheral European risk. The chart below (published by Bank of America Merrill Lynch) shows that investors in non-investment grade corporates no longer discriminates between “core” and “peripheral” credits when it comes to credit spreads.
5) Probably the biggest sign of all, is that today Greece is re-entering the international bonds markets. The country is expected to issue €3bn 5 year notes with a yield to maturity of 4.95%.
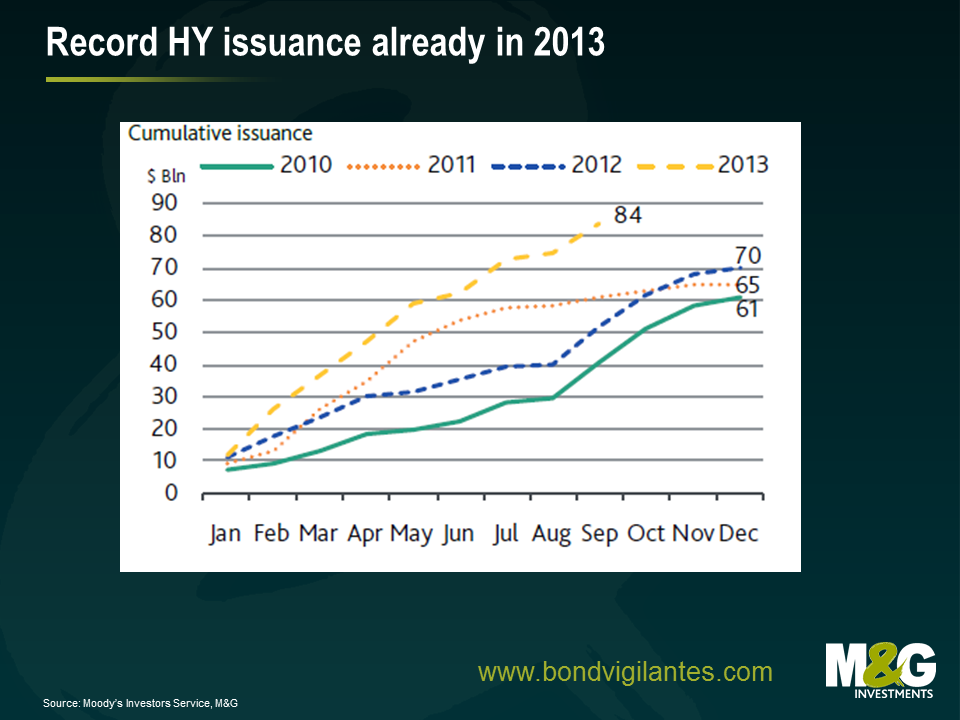
2013 saw a record year for new issue volumes in the European high yield market. A total of $106bn equivalent was raised by non-investment grade companies according to data from Moodys. Whilst this is beneficial for the long term diversification and growth of the market, there have been some negative trends. Given the intense demand for new issues, companies and their advisors have been able to perpetuate the erosion various bondholder rights to their own advantage. What form has this erosion taken and why are they potentially so costly for bondholders? Here we highlight some of the specific changes that have crept into bond documentation over the past 2 years and some examples that demonstrate the potential economic impact for investors.
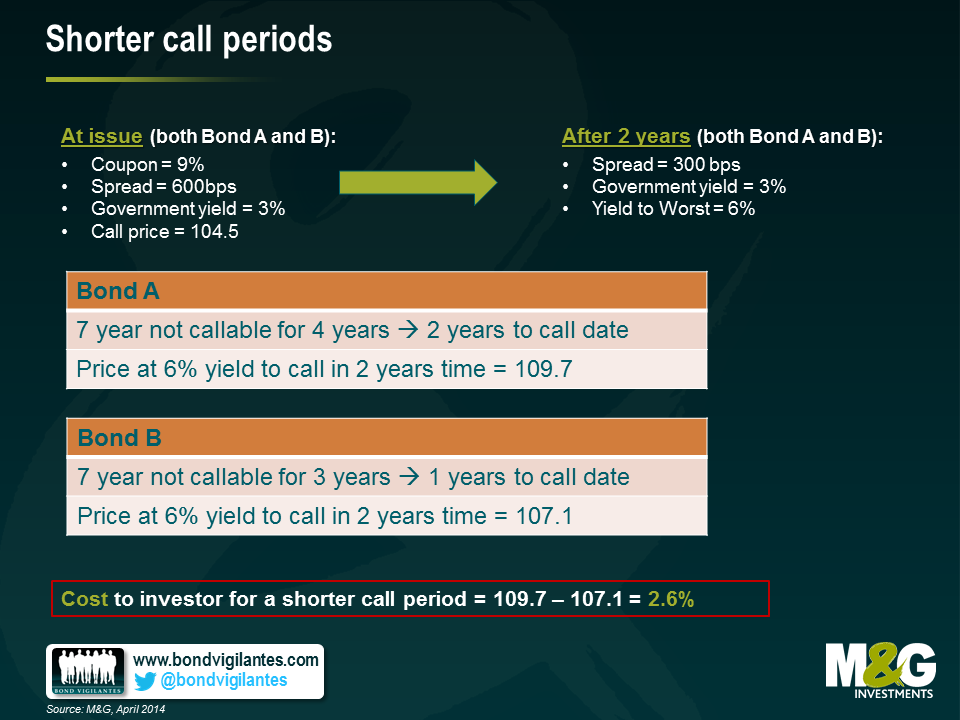
1) Shorter call periods – high yield bonds often contain embedded call options which enable the issuer to repay the bonds at a certain price at a certain point in the future. The benefit for the issuer is that if their business performs well and becomes less financially risky, they can call their bonds early and re-finance at a cheaper rate. The quid pro quo for bond holders is that the call price is typically several percentage points above par, hence they share in some of the upside. However, the length of time until the next call is important too. The longer the period, the higher the potential capital return for any bond holder as the risk premium (credit spread falls). The shorter the call period, the less likely the issuer will be locked into paying a high coupon. Take for example the situation below: reducing the call period has an associated cost to the investor of 2.6% of capital appreciation.
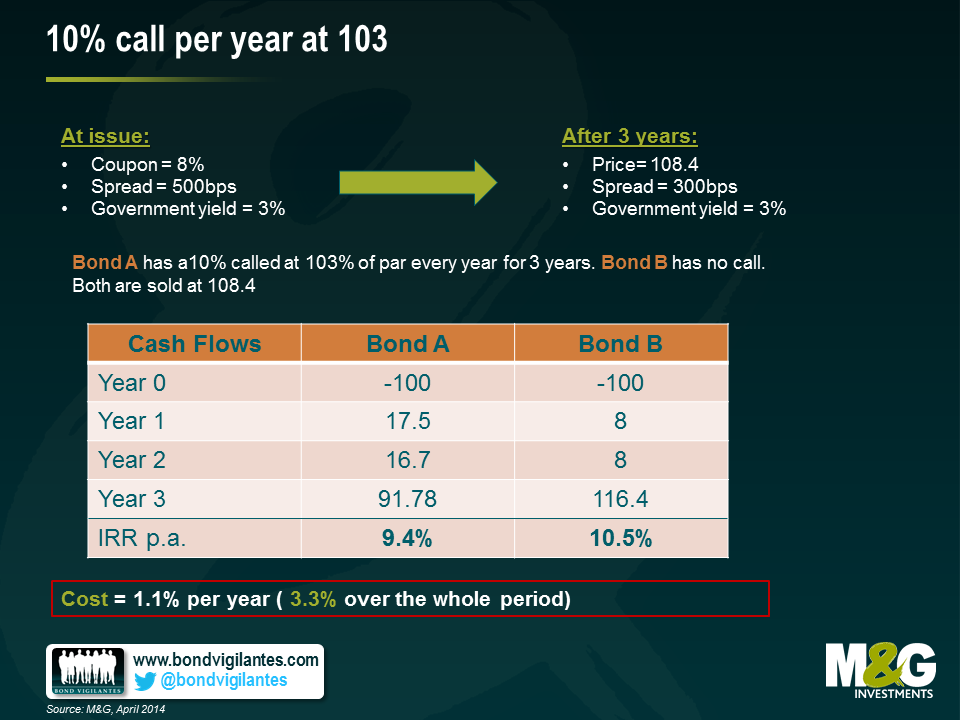
2) 10% call per year at 103 – Similar to the example above, the ability to call a bond prior to maturity has the impact of reducing potential upside to investors. One innovation that favours issuers has been the introduction of a call of 10% of the issue size every year within the so called “non call” period, usually at a preset price of 103% of par. So assuming a 3 year “non call” period, almost 1/3rd of an issuers bond can be retired at a relatively limited premium to par. Take for example the counterfactual scenario below. Here we see the inclusion of this extra call provision has reduced the potential return to bondholders by 3.3% over the holding period.
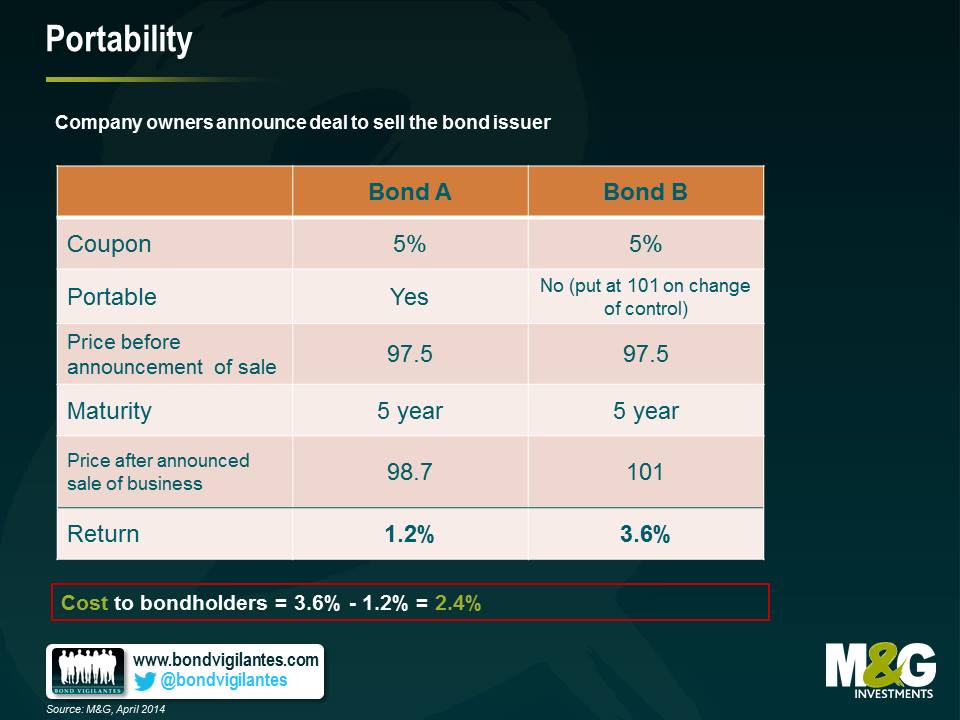
3) Portability – One of the most powerful bondholder protections is the so called “put on change of control”. This gives the bondholder the right but not the obligation to sell their bonds back to the issuer at 101% of face value in the event the company changes ownership. Crucially, this protects investors from the potential re-pricing downside of the issuer being purchased by a more leveraged or riskier entity. For the owners of companies, this has been a troublesome restriction as the need to refinance a complete capital structure can be a major impediment to any M&A transaction. However, a recent innovation has been to introduce a “portability” clause into the change of control language. This typically states that subject to a leverage test and time restriction, the put on change of control does not apply (and hence the bonds in issue become “portable”, travelling with the company to any new owner removing the need to potentially re-finance the debt). With much of the market trading well above 101% of par, the value of the put on change of control is somewhat diminished so some investors have not seen this as an egregious erosion of rights. The owners of the issuers on the other hand enjoy a much higher degree of flexibility when it comes to buying and selling companies. There are costs to bondholders, however. In particular, as and when bonds trade below face value, this option can have significant value. In the example below we see that the inclusion of portability has an associated cost of 2.4%
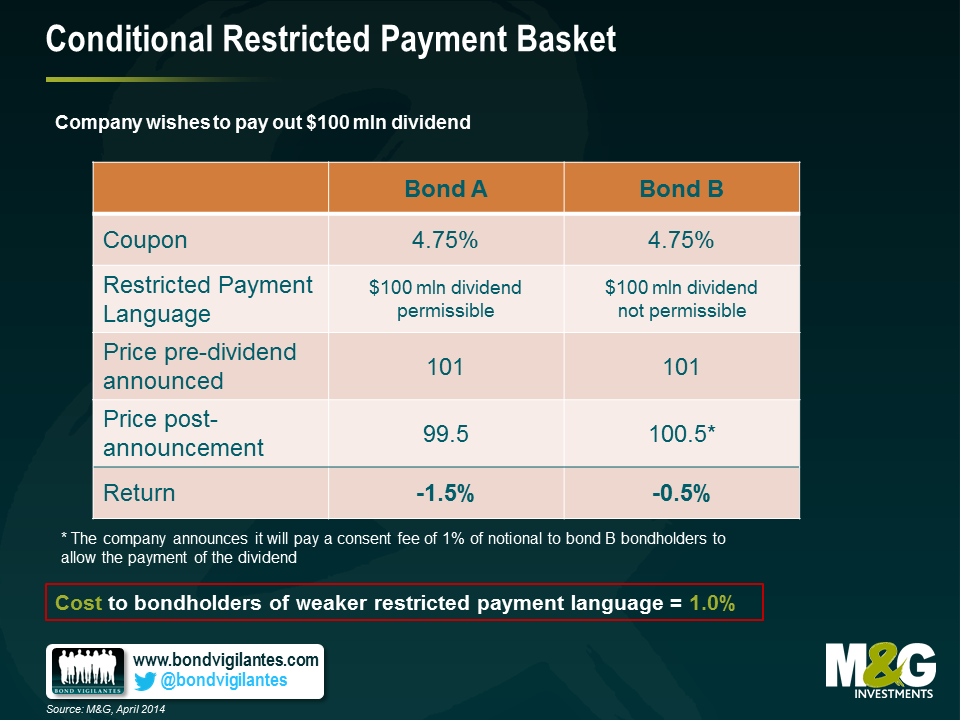
4) Conditional Restricted Payment Basket – Another protection for high yield bondholders has been the restrictions on dividends. This prevents owners of businesses from stripping out large amounts of cash leaving behind a more leveraged and riskier balance sheet. If a company was performing very well and the owners wished to take out a large dividend, they would usually be forced to re-finance the debt or come to a consensual agreement with bondholders to allow them to do so. Consequently, the call protections would apply and the bondholders would be able to share in some of the success of the issuer’s business. However, another recent innovation has been the loosening of this “restricted payments” provision to allow a limitless upstreaming of dividend cash out of the business subject to a leverage test. This limits the ability of owners to load up the balance sheet with debt at will, but without the need to re-finance the bonds bondholders loose some of their bargaining power and once more are likely to lose out in certain situations. In this example, we see an impact of 1.0%
What can investors do to cope with these unwelcome changes? Some sort of collective resistance would probably be the most effective tool – bondholders need to be prepared to stand up for their rights – but this is difficult to maintain in the face of inflows into the asset class and the need to invest cash. Until the market becomes weaker and negotiating power swings back toward the buyers of debt rather than the issuers, the most pragmatic course of action is for investors to asses any change on a case by case basis, then factor these in to their return requirements. This way investors can at least demand the appropriate risk premium for these changes and if they deem the risk premium insufficient they can simply elect to abstain. In the meantime, the old adage holds as true as ever – caveat emptor.
2013 was another decent year for returns in the high yield market. The US market returned 7.4%, with Europe a little way ahead at 10.3%. Bonds saw solid income returns, low default rates and a small capital gain as a tightening in credit spreads was enough to overcome weakness in the government bond markets. Once again this illustrated how high yield can be one of the few fixed income asset classes that can generate positive returns within a rising interest rate environment.
However, the dead hand of mathematics weighs heavily upon the prospects for the market in 2014. We still believe it will be a positive year for total returns, but expectations are for returns to be in the mid-single digits.
How then can we seek to potentially enhance these returns and reduce volatility in High Yield this year ? Here are five strategies that could help:
- “Clip the coupon and conserve your capital” – with lower return expectations, we think coupons (or rather income) will form the bulk of returns this year. On the other hand, with average bond prices above par, protecting the downside and lowering the volatility of capital returns will also be key.
- “Dodge duration” – one of the ways to lower the volatility of capital returns and protect portfolios from downside risk is to reduce exposure to volatility in the government bond markets, i.e. reduce the exposure to interest rate duration.
- “Financials are your friend” – recently we’ve been much more positive on the scope of financial high yield to enhance returns, especially in Europe. There are still many fundamental issues to be resolved, but the relative valuations and excess yields on offer to gain exposure to a sector that is essentially de-leveraging and de-risking are attractive in our view.
- “Learn to love liquidity” – if we do see opportunities to put capital to work at a later stage of the year, it’s important to have the liquidity on hand to take advantage. This may take the form of wider volatility and a sell off or indeed a rush of new issues hitting the market at the same time.
- “Don’t burn and certainly don’t churn” – keeping unnecessary transaction costs to a minimum will have a proportionally high impact when returns are expect to be more muted. Trading to try and capture a 10-15% upside is very different from trying to capture an additional 1-2% return when transaction cost can be anything for 50 – 100bps.
Much like fine wines, we believe that the year in which a bond is issued is an important factor in shaping its inherent character. The right climate in the markets, like the right weather conditions in the Gironde, can influence the nature of a security for better or for worse. 2013 is already a record year for the new high yield issuance in Europe (see the chart below). But will 2013 be one of the great vintages, or will investors just end up with a bad taste in their mouth and a nasty hangover?
First of all, let us consider the conditions in which the current crop of deals has been grown. By and large, it’s been fairly benign this year. With a brief hiccup in the summer, the market has enjoyed promises of excess liquidity from all the major central banks, the Eurozone has shown the first green shoots of stabilisation and default rates have remained low. Happy days then? For issuers and their investment bank advisers, yes, but for investors looking for future returns this is not the case. The perfect conditions for investors to invest capital is when the storm clouds are on the horizon, there is the sniff of panic in the air and only the juiciest of yields from the highest quality issuers can tempt people to part with their cash. In these times, the power rests with the buyers and the risk premiums extracted can be very attractive.
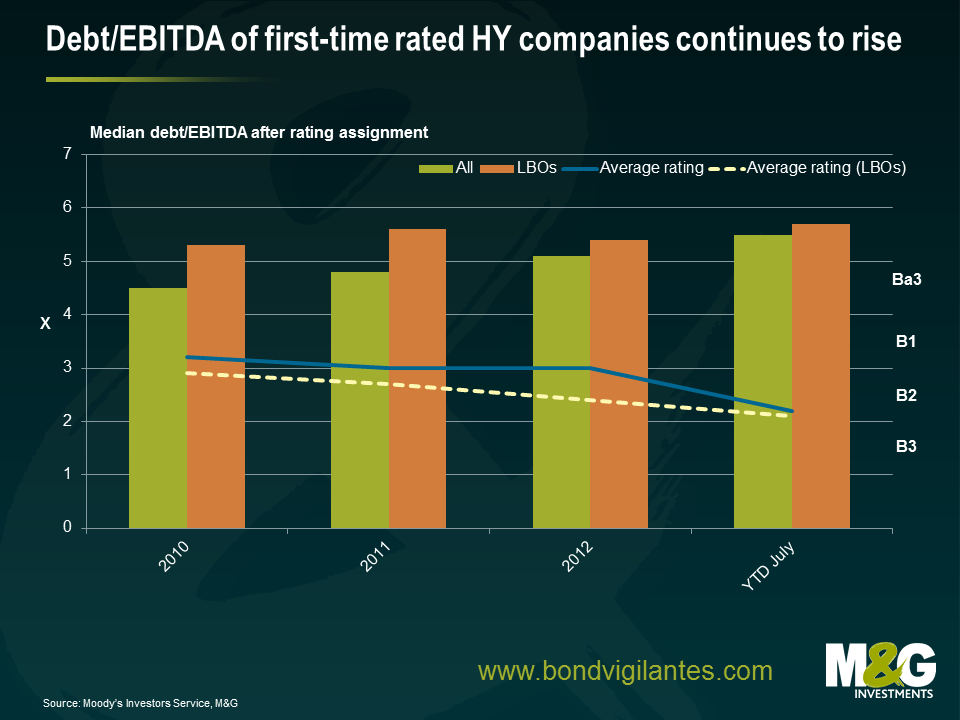
In contrast, we can see from the chart below that in today’s sunny climes a) the quality of issuance has been deteriorating (measured by credit rating and leverage) b) structural features such as weaker legal covenants*, optional coupons and subordination are becoming more common and c) given the market has been strong, the coupons and hence future returns investors can expect has greatly diminished. Valuation, as always, is at the heart of it all.
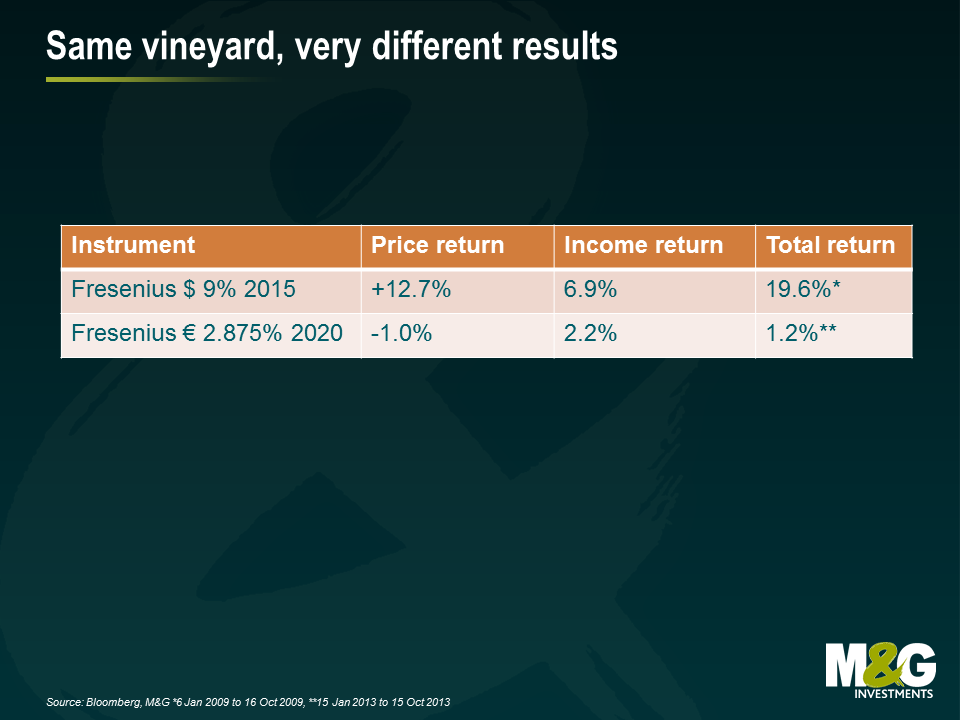
Take for instance, the respective returns experienced by two bonds issued by German healthcare provider Fresenius (one issued in 2009, the other issued in 2013). The USD 9% 2015 bond issued in the vintage year of 2009 performed admirably over the first nine months of its life. In contrast, the EUR 2.875% 2020 bond issued in January 2013 has been far less fruitful for investors. Products of the same vineyard, but with some very different results.
Of course we are not comparing like for like; 2013 is not 2009, but it illustrates the importance of market conditions and your starting point for valuations when it comes to assessing prospective returns.
There is a silver lining, however. The wave of new issuance is good for the long term development of the European high yield market. More bonds and issuers means more depth and more diversification. There is also greater scope for differentiation between different fund managers as the investment universe grows. The stock selection decision is becoming ever more important.
Nevertheless, whereas the quantity of the 2013 vintage is beyond dispute, we believe its quality is somewhat dubious. The 2013 crop is arguably more Blue Nun than grand Bordeaux.
*One new development has been the introduction of “portability”. A standard high yield covenant obliges the issuer to buy back all bonds at 101% of face value in the event the business is sold. This protects bondholders from an adverse outcome in the case of unexpected M&A. Exceptions to this are now being introduced into the legal language governing the bonds allowing issuers to be bought or sold without the obligation to redeem their bonds – allowing a so called “portable capital structure”. We do not like this dilution of bondholder rights.
So far this year returns for the high yield market seem solid if unspectacular; 2.9% for the global index, 4.5% for Europe and 3.4% for the US. However, these overall numbers mask some interesting gyrations within the markets. It’s been a mixed year for government bonds but a solid year for credit spreads. Indeed, recent moves in the sovereign bond markets continue to focus investors’ minds on the haunting spectre of interest rate risk. The high yield market is not entirely immune to such fears but we need to remember that interest rates are only one driver of performance. High yield returns are also subject to factors such as changes in credit spreads, default rates and carry.
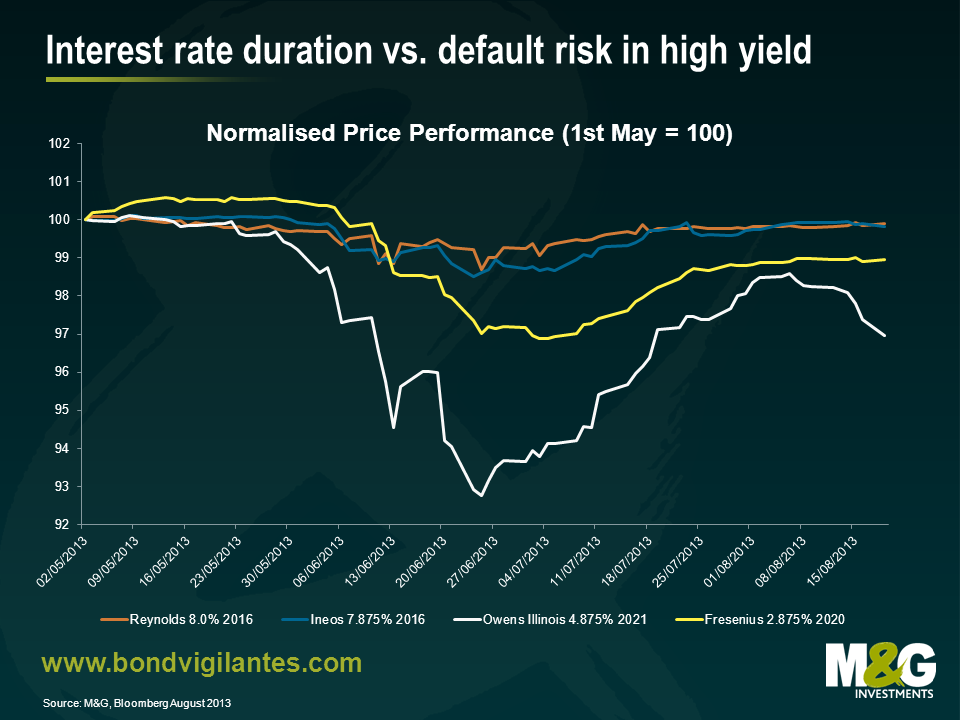
To illustrate this, we have two sets of bonds below: two long dated BB rated bonds (issued by German healthcare business Fresenius and US listed packaging group Owens Illinois) and two short dated CCC bonds (issued by the global chemicals company Ineos and another packaging group, Reynolds). The BB bonds carry relatively more interest rate risk than the latter due to their longer maturity, but less credit risk given the higher credit rating.
| Price | S&P Rating | Moodys Rating | Spread (bps) | Modified Duration (yrs) | |
| Fresenius 2.875% 2020 | 100.25 | BB+ | Ba1 | 162 | 6.1 |
| Owens Illinois 4.875% 2022 | 102.6 | BB+ | Ba2 | 313 | 6.1 |
| Ineos 7.875% 2016 | 101.25 | B- | Caa1 | 503 | 2.1 |
| Reynolds 8.0% 2016 | 100.125 | CCC+ | Caa2 | 565 | 2.8 |
Source: Bloomberg, M&G, August 2013
So how have these bonds fared over the past few weeks ? The chart below shows the relative price performance.
The chart shows that none of the bonds were immune to the volatility we saw over the summer. Indeed this was a relatively rare period where interest rate duration and credit risk premia moved in tandem. However, what is clear is that the longer dated bonds suffered more during the correction. When we consider total returns, this becomes more stark. The table below shows the impact of the different coupons over the three months in question. Again, the shorter dated CCC bonds fare better.
| Period 01/05/13 – 19/08/13 | Price Return | Income Return | Total Return |
| Fresenius 2.875% 2020 | -1.05% | 0.85% | -0.20% |
| Owens Illinois 4.875% 2022 | -3.03% | 1.37% | -1.66% |
| Ineos 7.875% 2016 | -0.18% | 2.31% | 2.13% |
| Reynolds 8.0% 2016 | -0.10% | 2.37% | 2.28% |
Source: Bloomberg, M&G, August 2013
The point here is that judiciously taking on more default risk in the form of a higher coupon and or spread whilst at the same time minimising your interest rate risk by focusing on short dated bonds, is one way that fixed income investors can ride out greater volatility within the government bond markets and still look to generate positive total returns. In this environment, default risk (as opposed to duration) really is the lesser of two evils.
One of our most popular posts of all time was written back in 2011. The subject was not the US losing its AAA rating, the impact of the default of Lehman Brothers or any other weighty matter of great economic import, but rather a quick look at how packets of Monster Munch were getting smaller over time and the associated inflationary impact.
Hence my surprise when I went into a shop last weekend and saw that Monster Munch packets have now been restored to their old 40g size, replacing the measly and frankly unsatisfying 22g version of recent times.
Further research on the manufacturer’s website revealed that
“ … The re-launch comes in response to growing consumer demand and will take Monster Munch back to the original retro pack design and old texture, flavour and crunchiness that consumers remember and love … Consumers have made it clear through both our own research and within online communities that they miss Monster Munch the way it used to be ..”
I like to think that our blog was the spark that lit the fuse of this virtual nostalgia-laden fast food insurgency. A resounding victory for bondvigilantes.com fighting in the name of consumer activism!
But wait, it gets better. Back in October 2011, the M&G coffee shop charged 45p for 22g, or 2.05 pence per gram. Today, the same shop charges 65p (RRP 50p) for a 40g packet, or 1.63 pence per gram. This is a fall of 20.5% in nominal terms. Put simply, you are also getting more for your money.
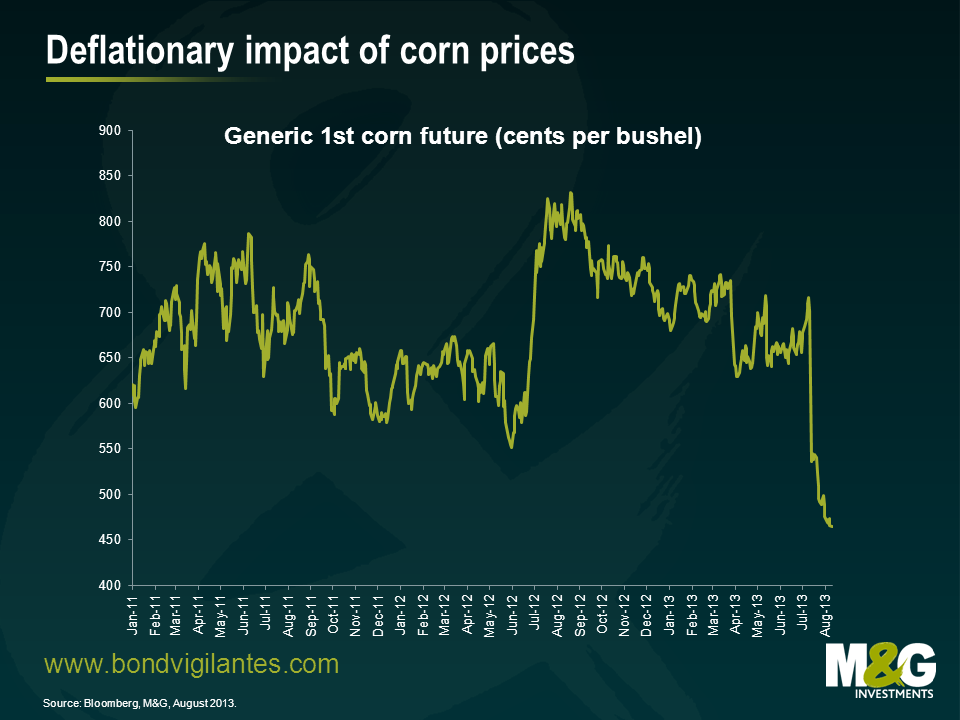
However, before we applaud the manufacturer for their largesse, let’s look at the main raw material. Back in October 2011, we pointed out that the headline cost of Monster Munch closely followed the corn price.
Since October 2011 the corn future has fallen by around 28.5% in price to $4.64 per bushel, a rare case of deflation in recent times. In sterling terms, the fall is around 25.5%. Accordingly, the dramatic fall off in corn prices has allowed the manufacturer to pass on part of this benefit to consumers, reducing the headline per gram price, but at the same time retaining some of the benefit in the form of an enhanced profit margin.
So whilst we cannot claim all the credit for this victory, this is a rare piece of welcome news for the consumer of corn based snacks.
Since the start of 2011 we have seen the onset of the Eurozone crisis, endemic political uncertainty, a return to recession and a de facto Greek sovereign default. Contrast this to the path the US has taken with aggressive QE, positive growth and a recovery in the housing market. The somewhat surprising fact is that in spite of all this, the European high yield market has outperformed its US counterpart, returning 29.0% and 24.8% respectively*.
There is little doubt that the US presents a more benign fundamental and macroeconomic environment for leveraged companies. Nevertheless, there are still compelling reasons to believe the European market offers the better investment opportunity. Here are 5 reasons why:
- Lower sensitivity to interest rates – since the genie of “Tapering” has been let out of the bottle this summer, investors have become acutely aware of the interest rate risk inherent in their holdings. The European high yield market has an effective interest rate duration of 3.2 years compared to 4.4 years for the US. Accordingly, the European market will be less sensitive to a further sell off in government bonds all other things being equal.
- Lower average cash price – European high yield bonds trade with an average cash price of 101.98 with the US at 102.92. This may seem like a small difference, but given the presence of call options in many high yield bonds, a cash price above 100 indicates limited scope for capital appreciation. The European market suffers from the same constraint, but with an extra 1% of headroom.
- Higher quality market – viewed through the prism of credit ratings, the European market is lower risk. BB rated bonds make up 67% of the market compared 42% for the US. Higher risk B rated bonds make up 23% and 41% respectively with the remainder within CCC’s. This means two thirds of the European market is rated just below investment grade, whereas over half the US market is well into “Junk” territory with a B or CCC rating.
- Higher credit spread – the European market as a whole trades with a credit spread over government bonds of 508bps compared to 471bps in the US. When controlled for credit rating, the difference is even more stark. European BB rated bonds trade at 410bps over sovereigns with US BB’s at 342. The numbers are 607bps and 454bps respectively for B rated instruments. We know the European economy is struggling but this is already factored into valuations.
- Lower default rate – According to Bank of America Merrill Lynch statistics for the public bond markets, the trailing last 12 month issuer weighted default rate for the European market is 1.2% compared to 2.1% for the US. There is little to suggest that this trend will dramatically change in the near future given low interest rates and supportive refinancing trends.
Of course there are always mitigating elements to this argument – the all-in yield of the European market , for example, is lower at 5.1% (US is 6.1%) – reflecting both the lower duration of the market, but also the divergence of European and US government bond market yields over recent months. Nevertheless, with lower interest rate risk, lower average cash price, higher credit quality, higher credit spreads and lower default rates, the investment case for the European market continues to look more compelling compared to its American cousin.
*BofA Merrill Lynch US and Euro High Yield Indices 31/12/2010 – 26/07/2013


