Markets
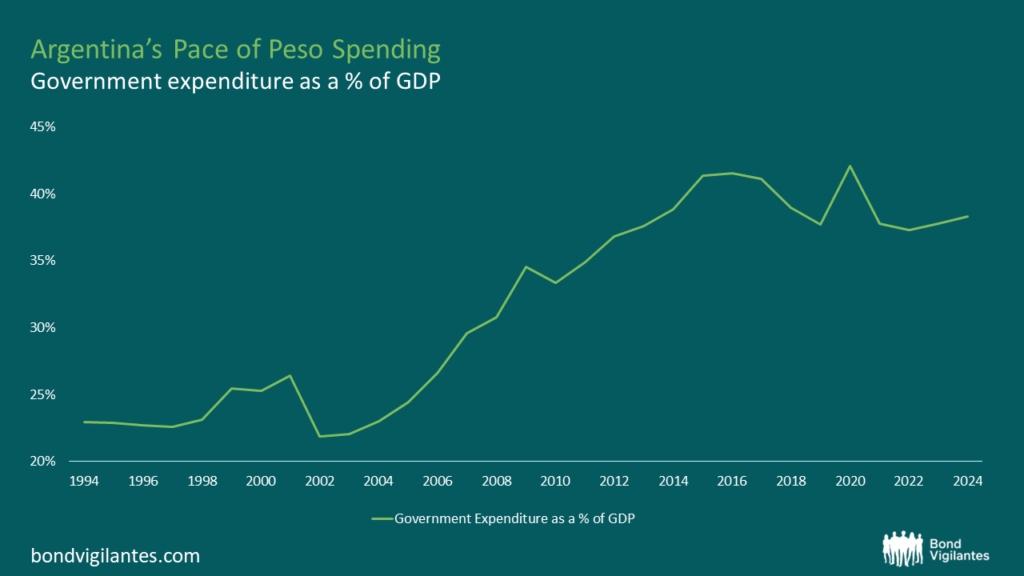
Gold prices: beyond inflation and real yields
By Robert Burrows
25 April 2024

Alan Greenspan made the headlines at the beginning of this year when he said that the risk of a US recession was 1 in 3, and has since said that recession risk had risen. Larry Summers (former US Treasury Secretary and Chief Economist at the World Bank) put the risk at 50/50 in September. The truly horrendous data coming from the US housing market makes us think that the risk of recession is probably greater than this.
What does this mean for high yield bonds? Well there’s a very close correlation between high yield bonds and economic growth – strong economic growth coincides with strong profits, low defaults and tight high yield bond spreads (ie high yield bonds become much lower yielding bonds). When the economy is in recession, more companies are going bust and high yield spreads tend to be wide (ie investors demand a big yield to be compensated for the significant risk that their bonds will blow up).
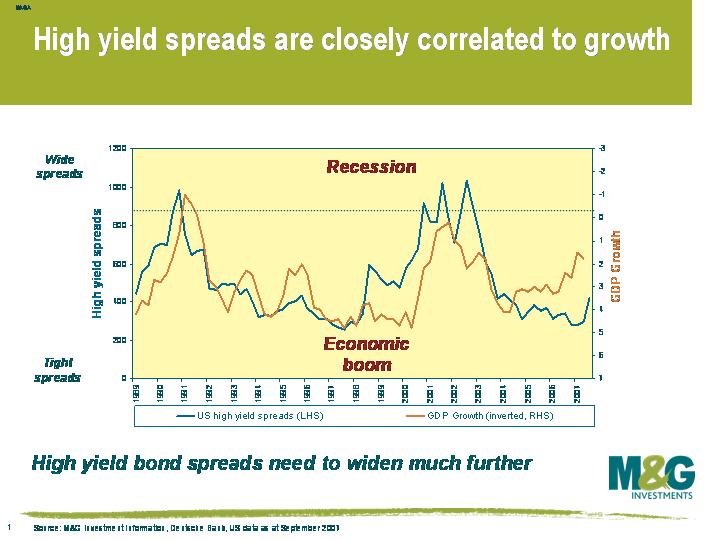 This chart shows that high yield spreads (left hand axis) are severely out of synch with US economic growth (right hand axis, inverted). There are three possible conclusions that can be drawn from the divergence of the lines. Number 1: this credit crisis will blow over and the US growth rate will jump back to 3%. Number 2: the correlation between growth and spreads has broken down (“it’s different this time”), or number 3: the high yield market is very expensive.
I favour number 3. US growth has been below trend for about a year, and yet high yield spreads actually reached their tightest ever levels in May this year. Spreads widened a bit over the summer, but are still close to all-time lows on an historical basis. And if you consider that US growth is likely to fall towards zero and possibly lower, then history suggests that the average high yield bond should yield around 12%, not 8%. A correction of this magnitude over the course of one year would result in double-digit negative returns. The European high yield market closely tracks the US market, and I remain very underweight of high yield assets across my portfolios.
Confidence among US home builders has hit an all time low in October, breaking the previous record set in January 1991. All components of the survey were weak – present sales fell to an all time low (breaking the January 1991 record), future sales were unchanged (staying at an all time low), and prospective buyer traffic slipped below the previous record set in December 1990. The data suggests that the pain will continue until the huge overhang of properties begins to unwind. Bigger discounts and incentives have failed to revive demand, and further house price falls seem inevitable.
The report underlines Ben Bernanke’s comment earlier this week, when he said that the housing market’s contraction will be a “significant drag” on US growth into next year. The Fed “will continue to watch the situation closely and will act as needed to support efficient market functioning and to foster sustainable economic growth and price stability”.
As I argued on this blog in August (before the Fed cut rates by 0.5%), the Fed will have to act fast if it is to prevent a slide towards recession.
See this link for an excellent summary of the impact of recent financial developments on the US economic outlook from Janet Yelen, President of the Federal Reserve Bank of San Francisco.
She concludes:
“In determining the appropriate course for monetary policy, we must recognize that most of the data available now reflect conditions before the disruptions began and, therefore, tell us less about the appropriate stance of policy than they normally would. In addition to data lags, appropriate policy decisions must also, I believe, entail consideration of the role of policy lags–that is, the lag between a policy action and its impact on the economy. Addressing these policy complications requires not only careful and vigilant monitoring of financial market developments, but also the formation of judgments about how these developments will affect employment, output, and inflation. In other words, I believe it is critical to take a forward-looking approach—gauging the effects of recent developments on the outlook, and, importantly, the risks to that outlook.”
When the Bank of England meets every month, market commentators always focus on the nominal interest rate. But what many people fail to realise is that it’s not the nominal interest rate that matters, it’s the real interest rate (ie nominal interest rates minus the inflation rate). If nominal interest rates rise from 5% to 6%, but inflation jumps from 2% to 4%, then real interest rates have actually fallen. Consumers will react by borrowing more, not less.
I was bearish on UK bonds through 2006 and the first half of 2007. Even though the Bank of England has steadily increased nominal interest rates from a low of 3.5% in 2003, real interest rates were at the same level in 2006 (about 2%). In reality, monetary policy at the beginning of this year was just as expansionary as in 2003, but four years ago the Bank of England was trying to avert recession and was worried about deflation. The Bank of England needed to raise rates this year, and it was little surprise that it has done so.
 Since May this year, however, real interest rates have climbed rapidly higher. Even though the Bank of England has only raised nominal interest rates by 0.25% since May, the drop in inflation has meant that real interest rates have jumped by 1% (as shown by the yellow line on the graph). If you measure real interest rates using 3 month LIBOR, which is the rate at which banks lend to each other and is therefore the rate that matters most to the man on the street, then real interest rates have jumped by 1.2% (as shown by the green line).
In reality, therefore, there has been a dramatic tightening of monetary policy over the past few months. High real interest rates will serve to reduce consumer borrowing, cut corporate investment, slow the housing market, and slow the economy. There is currently no need for the Bank of England to raise interest rates, and the next movement is likely to be downwards. The timing depends on how quickly and to what extent US woes afflict the UK, and how the UK housing market pans out (see my previous blog comment)
The housing market is the transmission mechanism between Bank of England base rates and the UK consumer. The B of E cuts interest rates to encourage borrowing, which causes house prices to rise and homeowners’ pockets to swell. Higher interest rates slow the economy by restricting borrowing and suppressing the housing market. The state of the UK housing market is therefore one of the most important determinants of UK interest rates.
We have had another look at some of our favourite housing market charts, and while these suggest that the UK housing market is still fairly rosy, I believe that we are at a critical point.
The first two graphs below examine whether the UK housing market is overvalued. Graphs three and four look at two leading indicators that have proven to be very reliable at predicting the strength of the housing market half a year into the future.
1. UK house prices look expensive on a P/E measure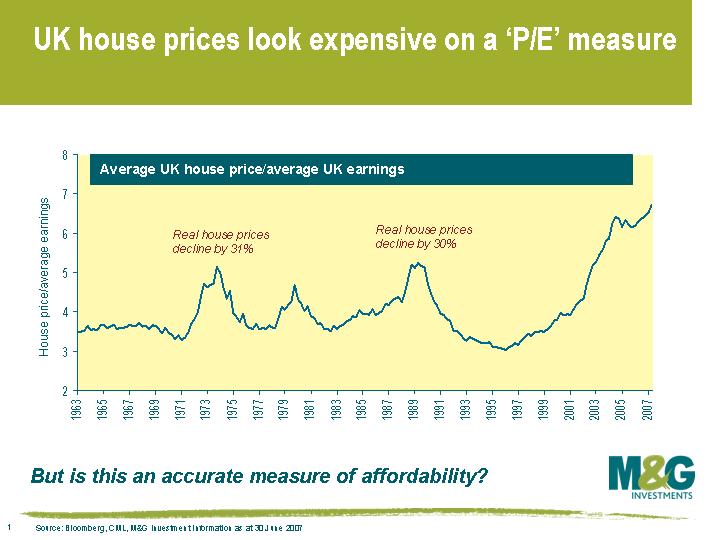 The housing market chart that people are most familiar with shows the average UK house price divided by average earnings, which is effectively a P/E ratio. There is no question that under this measure, UK house prices look the most expensive they’ve ever been. But is this an accurate measure of affordability? I believe it’s more important to look at how much Joe Public is spending on mortgage payments as a proportion of income, as that’s what determines whether people can afford to buy a house or not.
2. Mortgage payments still a relatively small portion of average earnings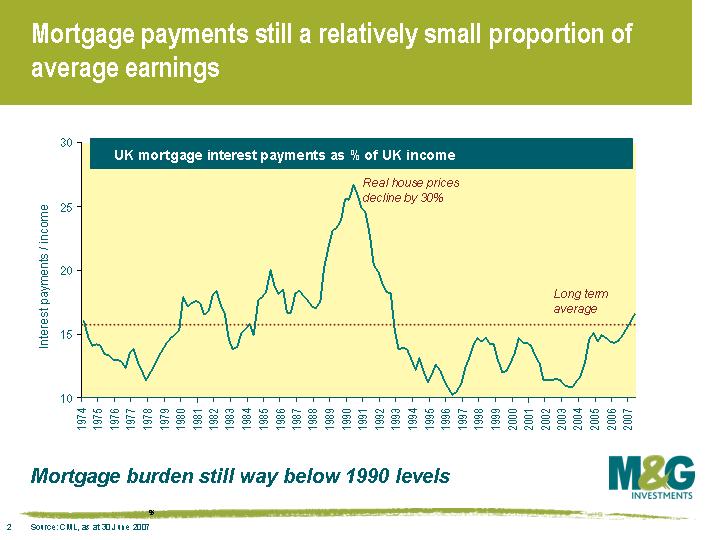 The mortgage burden isn’t that great at the moment. As at the end of June, mortgage payments formed 16.6% of average income (quarterly data). Monthly figures for the end of July have mortgage payments at 16.9%, the highest level since Q3 1992, but still not much above the long term average of 15.4% (figures go back to 1974). It’s easy to see what caused the last UK housing market crash – UK interest rates were increased to 15% in October 1989, and as a result, mortgage payments had soared to 26.7% of average income by Q2 1990.
3. Mortgage approvals suggest demand for houses will remain strong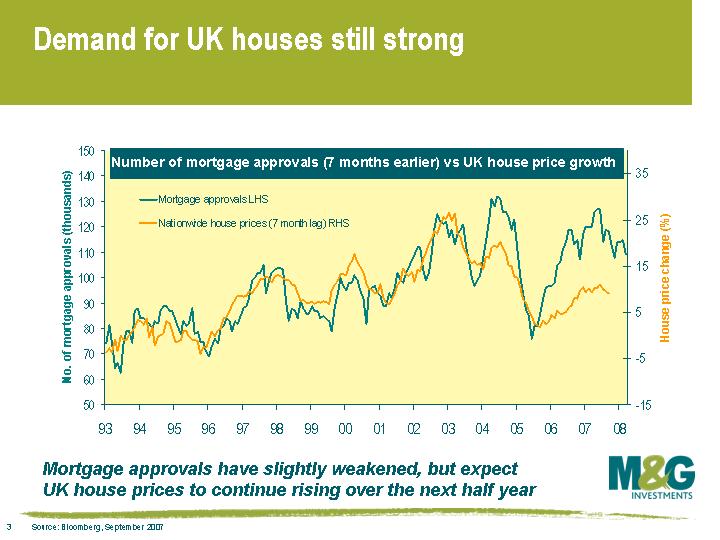 Lead indicators suggest that UK house prices will remain buoyant over at least the next half year. This chart shows the number of mortgage approvals taken out by individuals each month. The rationale for looking at mortgage approvals is that people who seek to take out a mortgage are almost certainly going to buy a house in the next few months. The lines have diverged a little since over the past 2-3 years, and we therefore look more at the direction of mortgage approvals rather than the absolute number in order to predict changes in UK house prices. Yesterday it was announced that the number of mortgage approvals fell to 109,000 in August (a four month low), but the drop was only slight.
4. Supply of houses is failing to meet demand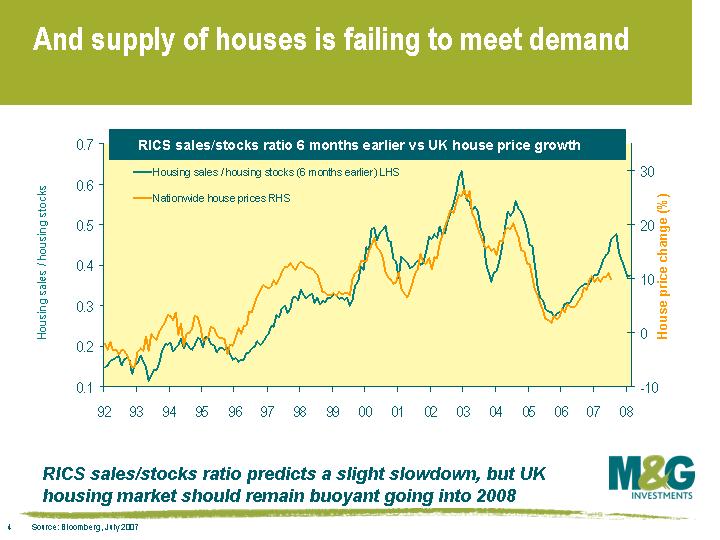 The RICS sales/stocks ratio is a very accurate indicator of future house price movements, as it encompasses both the demand and supply of houses. It is a measure of the number of sales that estate agents have made over a rolling 3 month period, divided by the total number of houses that estate agents are advertising for sale. So a high ratio indicates that a lot of houses that come onto the market are being sold straight away (demand exceeds supply), while a low ratio indicates there is a big overhang of houses on the market (excess supply). When the ratio is high, house prices have traditionally risen, and when the ratio is low, house prices have traditionally fallen. At the moment this indicator also suggests the housing market will be fairly buoyant going into 2008, although the rate of growth is likely to slow a little.
All in all, therefore, the available data suggests that there is little danger of collapse in the short term, but the story from the middle of next year could be very different.
The fallout from the credit crunch, the drying up of money markets and the Northern Rock debacle caused 3-month LIBOR (the rate that banks lend to each other) to rise to 6.9% at the beginning of September. This rate has since fallen back to 6.3%, but it’s still way above the 5.75% target rate set by the B of E. In reality therefore, banks have experienced a sudden jump in interest rates, and this will inevitably be passed onto the consumer in the form of higher mortgage rates.
Just how much mortgage rates will jump remains to be seen, but if there is a sudden move, this should be picked up in the two lead indicators mentioned above. A rise in mortgage rates will result in the number of mortgage approvals falling sharply, and the RICS sales/stocks ratio would start to decline. Any sign of this occurring will result in me taking a much more bearish view on the UK housing market.
On the one hand, we believe there will be more US interest rate cuts than the market is pricing in (the market’s anticipating about two 0.25% rate cuts by this time next year, and no more thereafter). We’ve posted a number of comments explaining why there is a very real risk of the US entering recession (for example see US house prices experience record fall, or will this financial crisis send the US economy into recession). If there is a sharp slowdown or recession, expect the Fed to react very aggressively.
From the technical side, the effects of globalisation have weakened the world’s reliance on the US economy. As I commented in Top dollar no more in November last year, the development of Asian countries’ economies and financial markets will reduce Asian investors’ reliance on US dollar assets. Asian demand has been a fundamental support for the US dollar over the past decade, and a weakening of this pillar will have big consequences.
US investors have reacted to the steady weakening of the US dollar by putting more money in overseas equities than ever before. The US trade deficit stood at -5.5% of US GDP in Q2, which is an improvement on the low of -6.8% at the end of 2005, but in light of the above it looks like the dollar will continue to weaken for the foreseeable future.
The Bank of England’s controversial decision to bail out Northern Rock depositors, which was probably necessary to prevent a UK banking sector collapse, has done very little to halt the slide in Northern Rock’s equity price and for good reason. The Bank of England has been clear that its rescue is only a temporary measure, and Northern Rock’s potential to write new business and take deposits is therefore very limited, meaning that Northern Rock’s business model is no longer valid.
Financial bonds have significantly underperformed other investment grade corporate bonds over the past few months, with Tier 1 bank bonds (which are subordinated bank bonds) performing worse than single-B rated bonds during the credit sell off (click to enlarge). The average spread on UK Tier 1 bank bonds, which are rated about A- on average, is 236 basis points at the time of writing. Tier 1 banks are trading at a level you’d expect to see from a junk bond rather than a bank.
Does this mean that Tier 1 financials are now the deal of the decade? I don’t think so. All Tier 1 bonds have a call option, whereby banks have the option to buy the bonds back at a set price on a given date in the future. Although this is an ‘option’ in the literal sense, the banks have previously stated that they will call these bonds (call dates are typically 10 years after issue).
But events of the past few months mean that it’s not actually in banks’ interest to retire existing debt and reissue it, because they will be losing money in the process. Banks will still try to do everything possible to call Tier 1 bonds because the reputational risk will be extremely damaging if they turn around and show two fingers to the markets, but Northern Rock’s experience suggests that some banks may not be able to afford to refinance these bonds. And if one large bank elects not to call Tier 1 bonds, and is not punished excessively by the market, then other banks could well follow suit. Bonds that were previously thought to have maturities in 5 or 10 years could suddenly become undated, which greatly increases the risk of holding them.
The problems don’t stop there. Have a look at the chart on Northern Rock’s capital structure (which is from June, before the BofE lifeline). At the top of the capital structure sit investors in senior secured paper, who are the first in line to get paid if the company runs into trouble. Equity investors sit at the very bottom. If Northern Rock’s position deteriorates further, the bank could first of all stop paying dividends to its equity investors. After that it is allowed to stop paying dividends to preference share holders. If it stops paying dividends to pref holders, it can then renege on its interest payments to Tier 1 bond holders.
So Tier 1 bonds, which were seen as a one way bet a couple of years ago (0.8% premium for bank bonds? Fantastic!) could suddenly go from being low risk, highly rated bonds with just 5 years to maturity, to being perpetual bonds with no maturity that don’t pay any interest. Is a 2.36% premium over government bonds enough to compensate me for this not-insignificant risk? Not in my opinion.
As an aside, it’s interesting to note that debt and deposits combined form £107.7bn of Northern Rock’s capital structure, while equity makes up £1.9bn, just 1.7% of the total, as at the end of June. Some people might understandably find equities more exciting, but as the recent credit crunch has demonstrated, the importance of what goes on in the bond and money markets cannot be understated.
The Council of Mortgage Lenders has released this chart on the left. It shows that UK mortgage payments as a percentage of income is steadily rising, and now stands at nearly 17%, the highest it’s been since Q3 1992. However, this is still a way away from the peak of over 25% towards the end of the 1980s, just ahead of the property crash and recession. As we’ve noted though, with 2 million fixed rate mortgages refixing at higher levels in coming months, we are likely to see this "pain-o-meter" tick up.
We’ve mentioned the crystal ball-like qualities of the US yield curve a couple of times on this blog. In May Jim showed that it can be a good predictor of recession (read article here), and the San Francisco Fed has recently published this interesting piece that adds weight to the argument.
There is some statistical analysis within the article, but in short it concludes that the yield curve is a better predictor of recessions than the professionals. There’s the old joke about the bond market predicting 9 out of the last 5 recessions – but the fact is that the economists employed by the investment banks predicted none of them. Nobody on Wall Street likes a bearer of bad tidings – just unleash the Rally Monkey and everything might be alright.
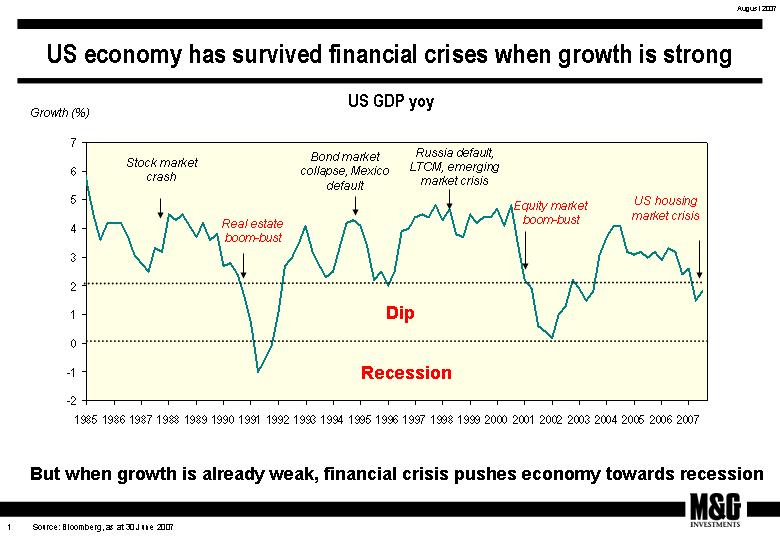 He certainly has a case. This chart plots US economic growth since the mid 1980s, and I have annotated the various financial crises over this period. What is striking is that when a financial crises occurs during times of rapid growth, the economy dips a little but quickly bounces back. In fact the US economy didn’t waver at all following the stock market crash of 1987, probably because US growth was booming at an annualised rate of 7.2% in Q4 1987. The financial crises of the mid-late 1990s only caused the US economy to dip briefly.
But a financial crisis combined with already-weak economic growth has traditionally caused a severe dip. The real estate boom of the late 1980s turned to bust, and helped contribute to a sharp recession in 1991. The equity market collapse of 2000-02 occurred when the economy was already on its knees, and only some aggressive intervention from the Fed and the US government prevented the US economy experiencing negative growth.
This time around, the US economy has already had a year of sub trend growth, and a credit crunch has come at a bad time. I think the Fed will have to act fast to prevent a slide towards recession.


Sign up to the Bond Vigilantes mailing list to ensure you never miss a great article from our expert Bloggers. We will email all new articles to your inbox, meaning you can stay on top of the world of Bonds.
I confirm that I would like to receive information about Bond Vigilantes and products and services from M&G Securities Limited.
We will use the email address and personal data you have shared with us to send you this information. For existing customers, submitting your contact details and requesting to receive this information from us, will replace any earlier choices you have made in respect of marketing information.
You can unsubscribe from marketing at any time, at which point we will not send any further marketing information to you, by selecting the unsubscribe link in all communications.