economics
18 April 2024

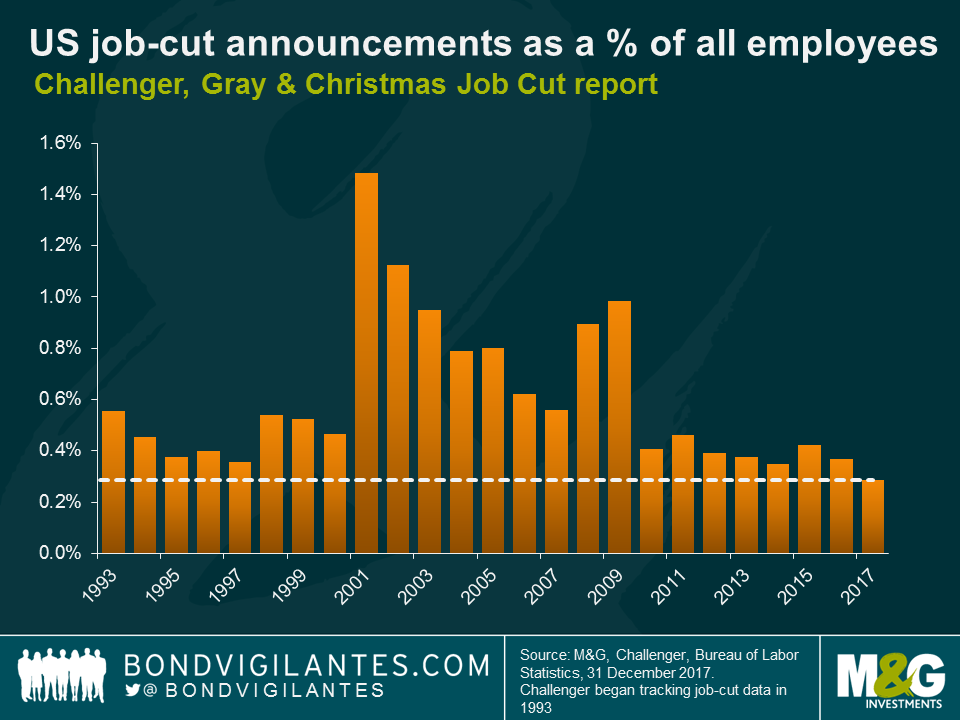
My view is that the US economy is nearer to overheating than slipping into recession. The strength of the US economy is typified by the labour market in many ways. To put some of this strength in context, look at the Challenger, Gray & Christmas Job Cut report. Last year (2017) produced an exceptionally low number of layoffs in nominal terms, and when adjusted to reflect the size of the labour market in real terms, US employers laid off the least amount of workers in the history of the 25 year survey. Due to the strength of the US economy, labour is a wanted good and firms are holding on to their existing workforces.
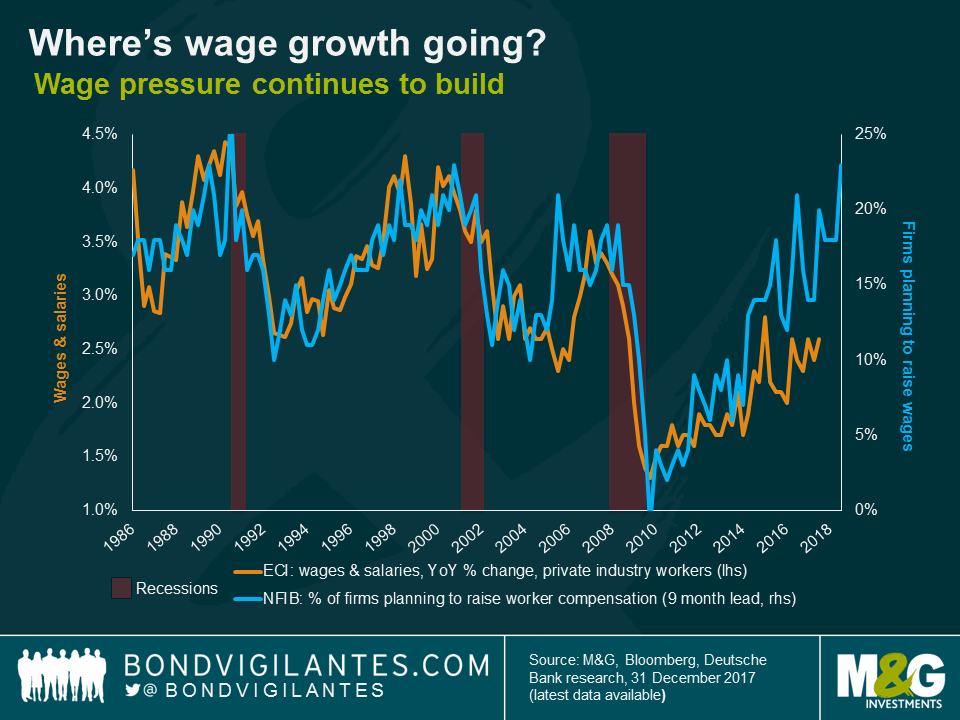
Labour market data is a lagging indicator, so it is important to determine what the outlook for US workers is in 2018. One of the ways to analyse this is to look at leading indicators of likely hiring. One chart I use regularly is shown below. This shows the strong correlation between business confidence and future earnings growth. It looks like a good year for wage growth ahead.
US interest rates have been normalising for a while, and the flatness of the yield curve suggests that markets believe that rates will peak soon. From a technical point of view, as pointed out by Gross and Gundlach, we are at a crucial inflection point. Is the long term structural bull market as shown in the 10 year yield chart below about to resume, or is it over?
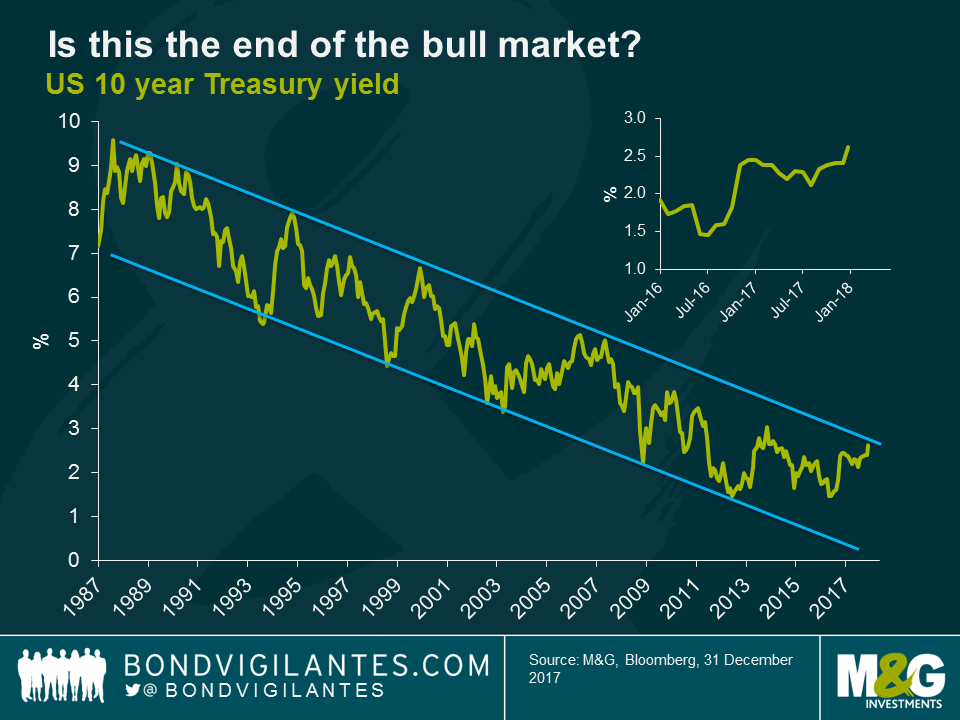
Due to US leading indicator data, the added impetus of tax cuts, strong synchronised global growth, and the return of the missing link of US confidence as I outlined last year, I think the probability of the recent bear market in bonds stopping at this point is limited and it is why I remain short duration across my portfolios.
Investing in public securities, whether equity or debt, is driven by two primary desires; firstly a need to save for the future, and secondly the requirement to see these savings grow. This results in a need for investors to pursue low risk and high growth investments. In order to understand these risks, assets get categorised based on their potential and historic risk characteristics. Broadly speaking, assets such as bonds are generally seen as defensive, while equities are viewed as more speculative. In order to break the understanding of investment characteristics down further, subsets of investments are produced, and therefore indices have logically evolved to show the performance of these subsets. Indices have now become a significant way for investors to gain investment exposure to asset classes via index funds. This all works well if the publicly available investment universe is well defined. But is it?
When constructing an index, the providers look to construct these using easily understandable and transparent rules. One rule is to ensure that the index reflects the publicly available free float of investment securities. This rule is in place so that distortions do not occur. For example, if there was a large stake in a company that was not free to trade, but the company’s weighting was based on all stock outstanding, then it would overstate the amount of publicly available investment securities.
This is the case for the current plans of the Saudi Aramco listing. The index providers will reduce the weight in the index to the actual free float level, which is a small percentage of the total equity outstanding to avoid distortions. Stating this plainly: if you do not adjust the free float, the index will not represent the truly available securities. Index tracker funds would then drive the price of the limited free float securities (i.e. the actual amount available to buy) higher as they try to get up to the “weight” shown at the index level.
Why does this matter? The monetary response to the financial crisis has been both conventional (via interest rates) and unconventional (via quantitative easing). The latter involves the purchasing of government debt by central banks, in order to print money, drive the term profile of interest rates lower, and increase confidence. This is designed to remove government debt from the public arena, and by definition reduces the free float of available securities. These holdings are not cancelled, but they are not available to be invested in (they are held on central bank balance sheets). Even index providers recognise this could be a potential problem.
What would the world bond indices look like if they treated bonds purchased via quantitative easing programmes in the – what I believe to be, appropriate – manner described? As a market which is currently being distorted by central bank QE, the Euro government bond market is a sensible place to assess this. Looking at the ICE Bank of America Merrill Lynch Euro government bond index, the constituents are capitalisation weighted, based on the amount outstanding. With ongoing QE however, this no longer equates to the actual amount that’s available to buy. So making a point in time adjustment for ECB holdings of government debt and reweighting the index accordingly, the composition of the index changes.
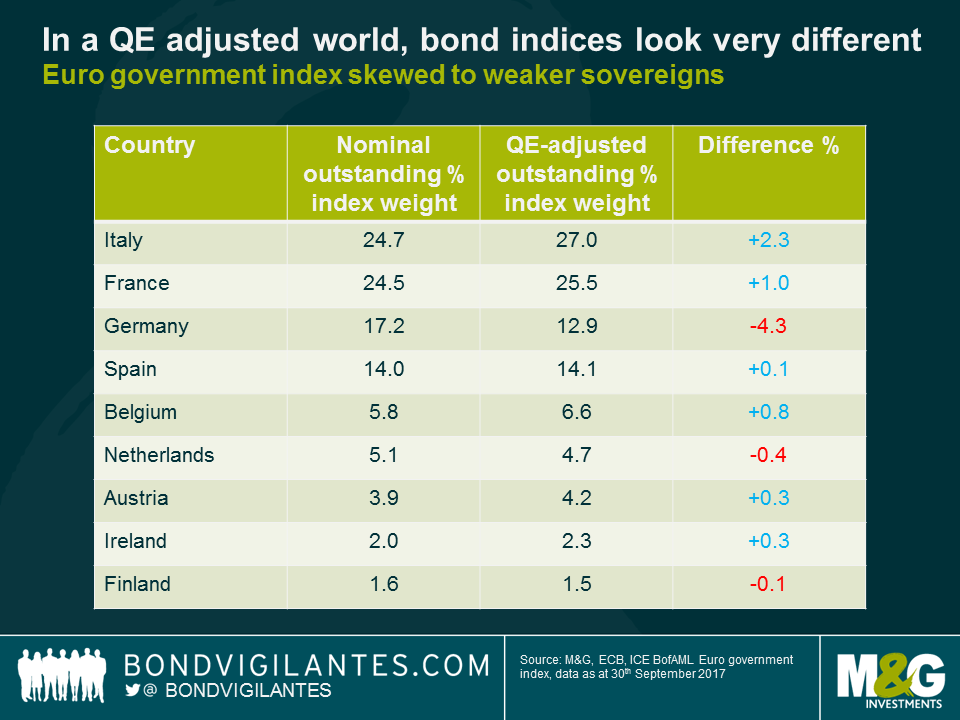
In a QE adjusted world, bond indices look very different, with the Euro government bond index in particular skewed towards weaker sovereigns. Indeed, what’s immediately apparent is the increase in the weight of lower rated sovereigns such as Italy, at the expense of AAA rated Germany. German government debt moves from being the third largest holding (17.2%) to the fourth largest (12.9%) in the newly adjusted index. Since the ECB implements QE by buying government debt in line with the capital key (calculated according to the size of the member state in terms of population and GDP) German government debt represents over 20% of all cumulative QE holdings, reducing the index free-float quite significantly.
QE bond buying has important implications for funds which are tracking an index. If the index weights don’t reflect reality, then tracker and exchange traded funds are chasing increasingly scarce securities, driving up prices, in an attempt to recreate a false investment universe. Index tracking funds and ETFs may be distorting the price of securities that are over-represented in the indices but under-represented in the real investable universe.
There are two main investment implications from this analysis. Firstly, should the index providers alter the way they construct indices to reflect central banks asset purchases? Secondly, has QE resulted in excessive performance of lower debt outstanding (higher quality) sovereign issuers in the Eurozone, and elsewhere? QE is designed to drive bond yields lower, though the construction of indices in their current form and funds that are benchmarked against these indices has contributed to exaggerating this process. This may be yet another unintended consequence of central banks entering into the marketplace for debt securities. In the extreme, will the eventual suspension and reversal of QE result in weaker rated sovereign bonds outperforming their higher rated peers as the distortion is removed?
On August 4th last year, the Bank of England announced a series of easing measures in response to the Brexit referendum results. They were very concerned regarding a potential slowdown and collapse in both the economy and corporate confidence and so implemented a variety of measures; reducing interest rates, increasing liquidity lines for banks, and reintroducing their gilt and corporate bond purchase programmes. Since then, growth has remained positive, and unemployment has continued to be low. The measures appear to have helped.
These ‘crisis response’ measures are however not new, having previously been implemented in 2008 to similar effect, in response to the far larger financial crisis. Though this time around, being near the limit of zero rates in 2016 meant the Bank leaned more heavily on non-conventional monetary policy measures, as illustrated in the table below.
| Post-Lehman | Post-Brexit | |
| Rate cuts | 4.50% | 0.25% |
| Gilt purchases | £375bn | £60bn |
| Corporate bond purchases | £2.3bn | £10.0bn |
| Term Funding Scheme Loans | £41,836m | £33,828m |
| Change in unemployment | + 2.17% * | – 0.26% ** |
| Change in inflation (CPI, yoy) | – 2.2% * | +2.1% ** |
* November 2008 – November 2009
** June 2016 – August 2017
The scorecard above illustrates the differences economically and in terms of policy response. The Bank used the same policy tools, though more unconventionally weighted, when faced with a smaller crisis. The most notable feature is the disproportional purchase of corporate bonds this time around versus other measures; four times as much corporate quantitative easing has been undertaken compared to the Great Financial Crisis. This was due to fears that companies would not be able to fund themselves and financial dislocation would occur. Partly as a result of the Bank’s emergency actions, markets fortunately remained firmly open – here and abroad – for U.K. companies.
Glancing back to the scorecard which demonstrates the stability of markets over the last year (i.e. with unemployment continuing to fall), the need for aggressive monetary policy and emergency measures has lessened. The chart below shows corporate bond spreads in the U.K. Although they did widen on the shock Brexit vote, they have since returned to new post financial crisis tights. The Bank is in agreement that aggressive emergency measures are no longer necessary; it has completed and ceased its corporate bond buying programme, and recently committee members at the Bank have been advocating the reversal of the ‘emergency’ rate cut of 2016. This is in stark contrast to this time last year when the Bank had a bias towards easing. A reversal of policy appears to be on the cards.

From a rate perspective, removing the quarter point cut is not that dramatic as the conventional policy response was limited last year. From a corporate bond perspective however, selling the corporates back to the market could potentially weigh on the performance of sterling corporate bonds held by the Bank.
During the Great Financial Crisis the Bank bought bonds from March 2009 and completed selling them back to the market by April 2013, this time round they bought them in a seven month window from September 2016 to April 2017. Will the Bank now sell these holdings and if so, when?
In answer to the first question, I think they will. The one major unwind of emergency policy of the Great Financial Crisis was the selling back of the non-gilts purchased, to the market; I do not see why it should be different this time. Indeed we have a situation where the Bank wants to potentially tighten policy, the need for emergency funding appears low, and in fact the Bank has been arguing recently that lending conditions are getting too lax from a prudential perspective. One way to solve this is to let the private sector fund corporate debt, having been potentially crowded out of that option by the Bank’s significant corporate bond buying programme.
Going forward there are still Brexit uncertainties, but one aspect perhaps less so: the Bank of England meetings will at some point not only be discussing the direction of interest rates, but when to sell its corporate bond holdings.
The world will soon turn to the inauguration of Donald Trump. For at least the next four years, global investment markets will be focusing on his Presidency. This is always the case when a new President takes over the reins of the most economically powerful country in the world, but why does it feel more important this time?
Firstly, political deadlock has been broken. For the first time since 1928, the Republicans have the White House, the House, and the Senate. Therefore government policy is more likely to evolve from gradual, to radical.
Secondly, having a President that has no background in politics is going to result in a different type of leader than has historically existed within the US political system, making for a more unpredictable Presidency than has traditionally been the case.
Both of these points are regularly discussed, and are common themes amongst political analysts. The concept that I discuss below is a potential third dynamic that evolves from these two points.
The nature of leadership is a strange one. In a democracy the leader is a servant appointed by the electorate, whilst at the same time the President when appointed is expected to use his or her executive powers, that have been granted, to govern. The combination of the non-career politician and the electoral clean sweep in the US imply that the electorate have chosen a leader they want to lead and a political system that will facilitate his views. This makes for potentially interesting times.
We do not know the exact policies the Trump administration will pursue, and even if we did we cannot calculate the exact effect of these policies. It appears that a shift to the right in economic and social policies is a given in the short term. One thing is immediately clear, leadership is back.
Societies and markets have gone through a ten year phase of low confidence in economic and political leadership. Why did economists not see the recession coming ? Why did governments allow asset bubbles ? Where is the economic recovery amongst the lower and middle classes? Scepticism towards effective economic leadership from the politicians, and central bankers, is high. The cause and effect of policy decisions (such as quantitative easing) is often seen as confusing at best, and irrelevant to the real world at worst. The connection between decisions and consequences has become muddled. With the election of Donald Trump, this is about to change.
Donald Trump as President will make markets once again focus on the connection between policy decisions and market actions. We already have evidence of how his direct approach can influence economic outcomes, with the correlation between his ascendency and the Mexican Peso’s weakness being the most obvious example. The new President’s style is short and direct, and policy will be set by a man of few words, not many. Causal relationships will once again become very evident between the administration and markets. This will be evidenced in a number of ways, whether it is a wide-ranging economic decision, or a pointed dig at a particular company. In the short and long-term these pronouncements will effect economies and markets. Whether they are good or bad policies, and who they help or hurt we will find out over time. The one thing that will be established in coming months will be to re-establish the psychology of political and economic leadership over markets.
There was a lot of talk about animal spirits at the onset of the financial crisis. Animal spirits were singled out for fostering a boom in credit, and their subsequent collapse resulted in an anaemic recovery. We are now likely to see confidence in the US government to return, not necessarily because their decisions are correct, but because policy actions will produce an identifiable result. Policy scepticism will disappear as the link between policy decisions, and economic/market outcomes once again will come into full focus. This is something that has been absent post the financial crisis.
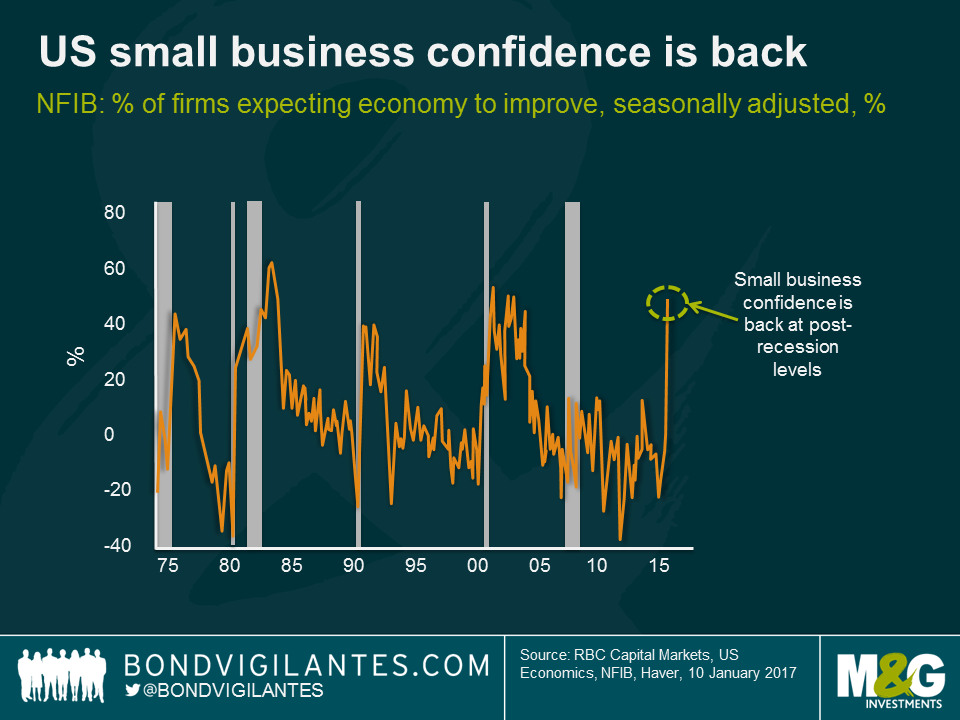
Indeed, a shift in confidence is already underway within the US economy. The chart below shows the jump in small business confidence, a sector that is a strong driver of investment, employment and growth in the USA. This swing in confidence is the biggest shift seen on record. Previous jumps in small business confidence mark the end of previous recessions, and point to periods ahead of economic growth for the US.
This is not the first time a change in leadership expectations has taken place. For example, in Franklin. D. Roosevelt’s inauguration speech he produced his famous quote; “the only thing we have to fear is… fear itself “. The FDR administration went on to embark upon a direct programme of linking government actions to economic outcomes.
Unlike those dark days, the US economy is fortunately currently near full employment. The rediscovery of belief in leadership will permeate through the rest of the new administration, and out into the behaviour of the leaders of companies in the private sector. This should help animal spirits, consumer confidence, and the economy. In asset markets it will mean the requirement for loose monetary policy will diminish, whilst corporate investment in existing businesses and through mergers and acquisitions is likely to increase. Leadership is back, decisions will be made, and let’s hope that they are good ones.
Last week, the Federal Open Market Committee (FOMC) decided that despite low unemployment and a sustained increase in breakeven inflation expectations since September, it was appropriate to maintain the Fed Funds rate between 0.25-0.50%. In trying to understand this action, and why the Fed is happy to wait until December to hike rates, a number of theories have been suggested by the financial community. These include:
From reading my opinion in previous blogs you will find that I agree with the reason number 4. A tight labour market, developing wage pressures, and the dissipating deflationary impacts of a collapsing oil price, suggest to me that the US economy needs higher interest rates.
What is less well known than the official Fed Funds rate, is that under the surface there has actually been a steady tightening of policy in the real world that the FOMC has been happy to accept.
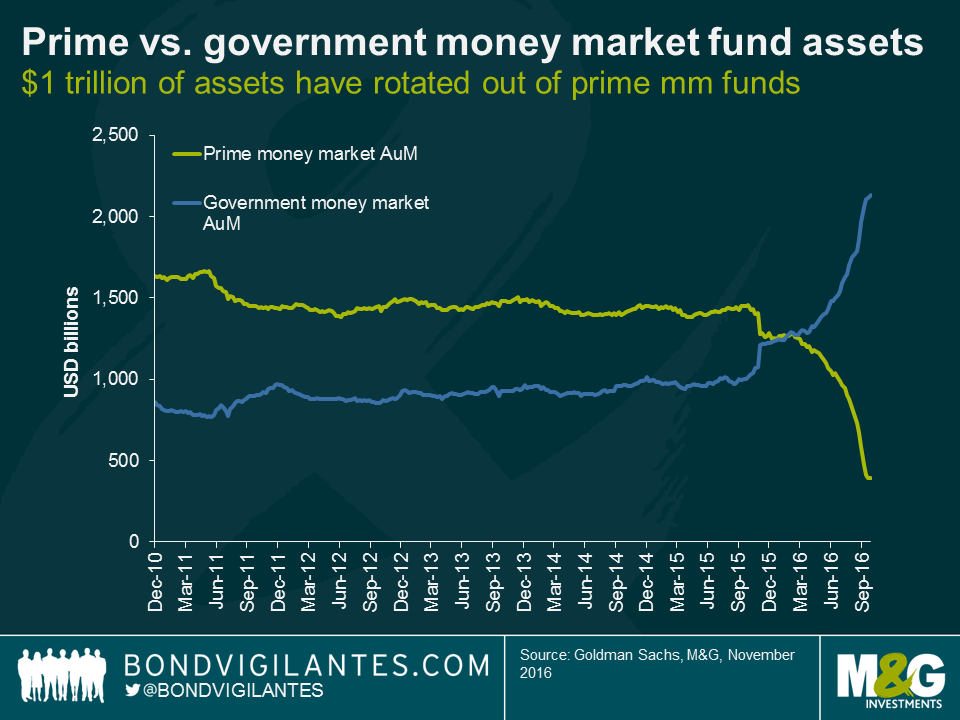
As a result of regulatory changes, money market reforms that require non-government funds to be market-to-market to protect investors came into effect in October. The rule changes were designed to make money market funds more resilient to market volatility and to provide greater protection for investors in a fund that “breaks the buck” (has securities repriced to below par). Of course, investors prefer return without risk, and these reforms mean that price volatility now explicitly sits in the non-government money market. Not surprisingly, short-dated risk-free money has dashed from prime commercial paper funds (that now have a floating net asset value) to treasury funds that do not have an explicitly variable net asset value. According to Lotfi Karoui and Marty Young at Goldman Sachs, assets held in prime money market funds have fallen by almost $1 trillion over the past year and rotated into government money market funds.
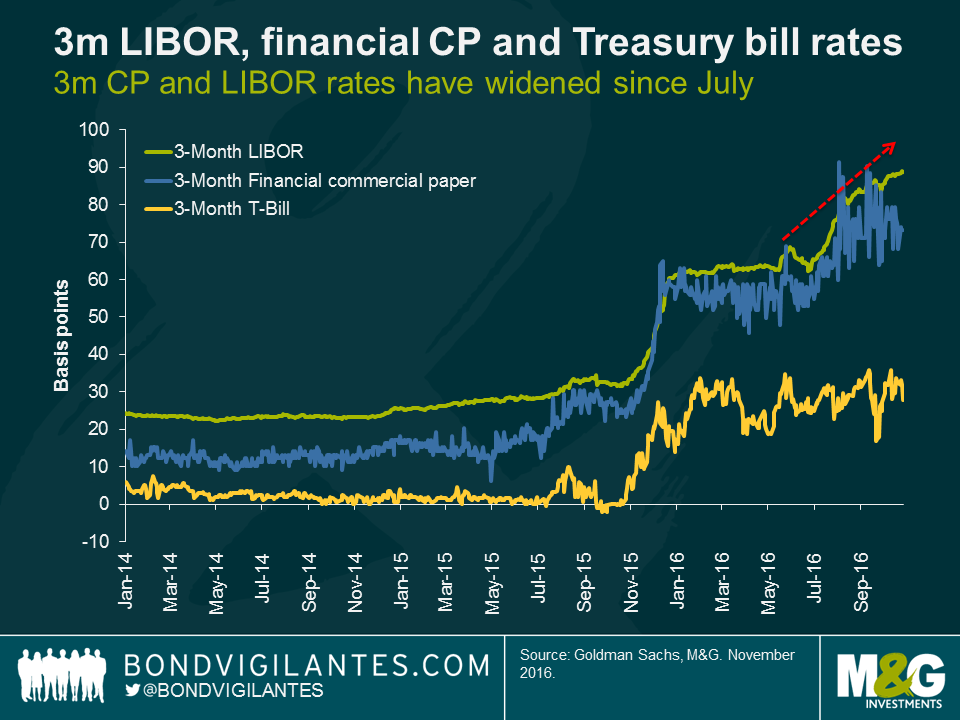
This means that despite no official headline tightening, real short-term funding costs as measured by LIBOR have increased by almost 30 basis points since June, leading to significantly higher funding costs for banks and other commercial paper issuers.
Investors always focus on conventional headlines, but it often helps to look at the real narrative. Money market reform is doing the FOMC’s job for them, which is a form of unconventional interest rate tightening. Consequently, the FOMC may be more hawkish than economists think as they are happy to accept this market tightening, which has had a similar impact on LIBOR as a traditional move in the Fed Funds rate. This effective tightening of policy means that maybe the FOMC’s views and my own are now less far apart than one might think.
When investors buy or sell financial assets they try to analyse likely outcomes. This basically revolves around three main issues.
The dramatic fall in bond yields means that this traditional approach to investing will have to be examined.
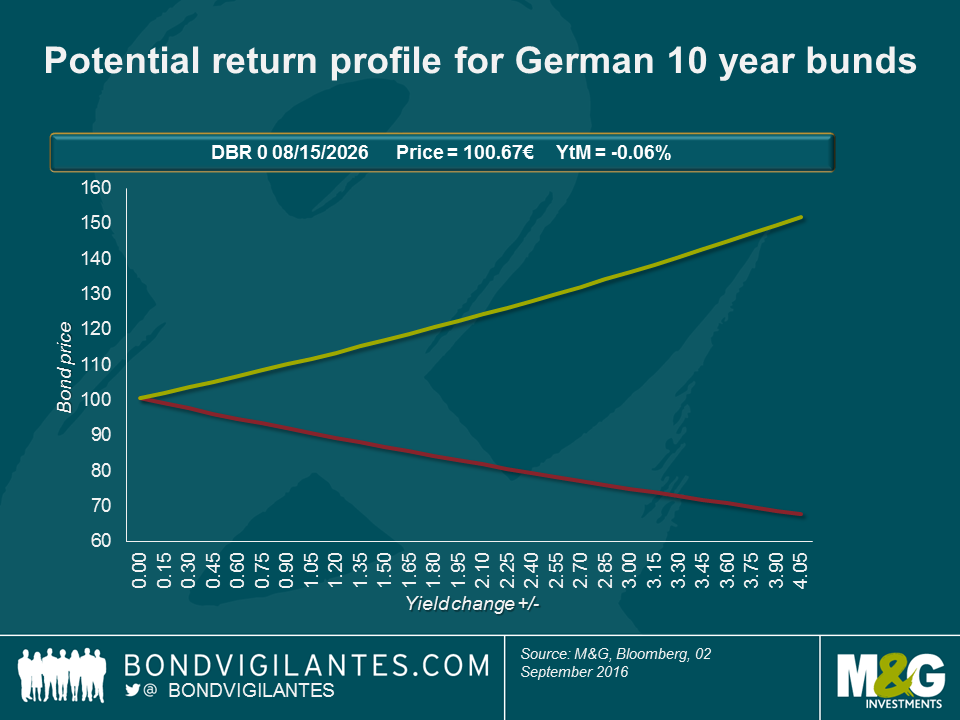
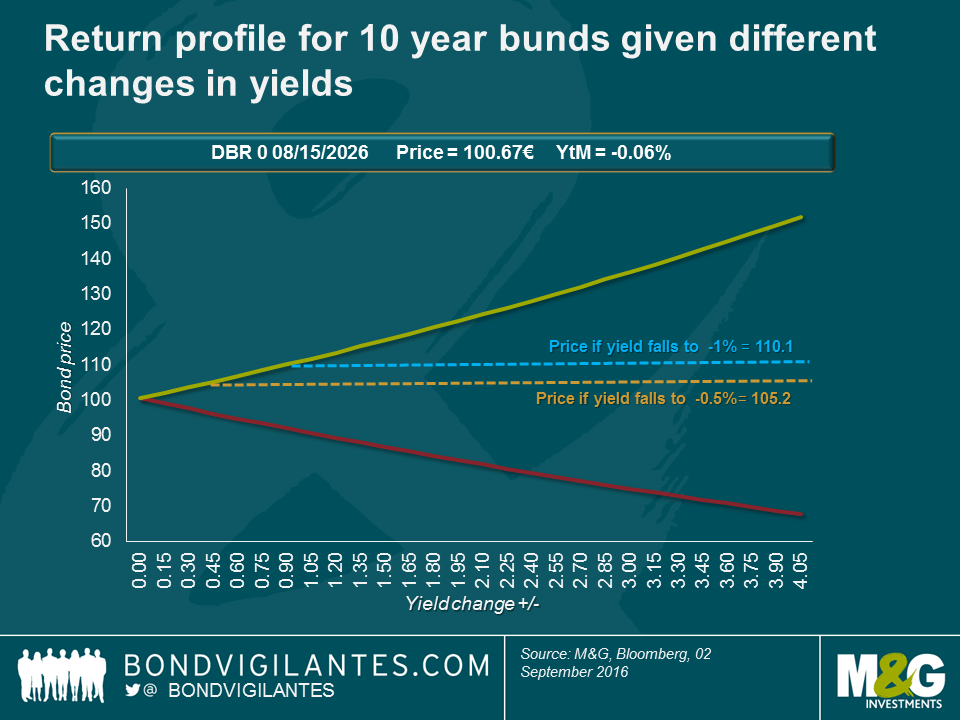
One way to do this is to model real world outcomes. Below is a depiction of how the German bund 0 percent 2026 will move in price given different yield scenarios. Assuming the current yield is zero the price is 100, if interest rates were to fall -4 percent the price of the bond will increase to 151.9 , and if rates were to rise by 4 percent the price will to fall 67.8. It is possible to plot the theoretical capital upside and downside, and given that it is a zero coupon security it will earn the investor no income over its life.
The above approach is the traditional way an investor would analyse a bond, however one has to remember that investors can think of cash as a strong bond alternative. When holding physical cash, the investor knows the capital upside and downside are both zero, and the income returned by physical cash is zero. Cash is the ultimate low volatility security, but earns the investor no income.
This lack of income has given bonds an historical edge over physical cash. Investors were happy to take extra income and potential capital gains and losses in bonds versus cash. Developed bond markets are now at the point where the income on a 10 year bund and a 100 euro note is exactly the same (zero) and the yield advantage of owning a 10 year bund is gone. However, the potential capital gains and losses of owning a bund still exist. Consequently, at these low yields I believe the upside for bunds versus cash is limited.
When faced with a greater return and less volatility why would investors buy a negative yielding bond rather than hold cash? One advantage government bonds have over cash is safety, they are harder to lose, steal, and be destroyed. And there is a greater cost in holding cash due to its physical nature. This risk can be removed via secure storage, traditionally in a vault. This means that a holder of cash would become indifferent when the costs of holding cash is the same as the negative yield earned on bonds. If we assume this is around 1 percent, then the below graph illustrates that investors would be willing to hold a bond yielding less than zero to maturity even with the potential risks to capital.
Markets are dynamic, and if this negative yield environment persists, market structures will probably evolve to potentially provide more interesting ways to store cash. One solution would be for a bank to issue an ETF based on negative yielding cash, akin to other physical ETFs. As opposed to commodity or equity backing, the ETF would have cash stored safely at a variety of locations, where security would be strong and access would be hard to achieve. The ETF provider could then charge the client a fee (say 1 percent per annum) for depositing the cash, incur low costs of storage of let’s say 0.5 percent, and earn 50 basis points of return. Such an ETF would allow both small and large transactions, and allow customers from individuals to institutions to store their money efficiently at a zero rate before fees.
In theory, the upside in bonds is limited by the physical alternative of cash. Therefore the risk reward of owning bonds is skewed. Below the zero line the upside is limited, while the downside still has the ability to hurt.
Post the Brexit referendum we are in an economic purgatory. The brexiteers are looking forward to a democratic led revitalisation of the economy, while the bremainers fear that the “little England” mentality will leave us isolated and depressed. Most people have an opinion, and the economic opinion that matters the most is that of the Bank of England (BoE). The market has absorbed the news of Brexit and adjusted: sterling down, foreign earning equities up, and UK government bond yields down to record lows.
The BoE now has the opportunity to publish its thoughts this Thursday on Brexit in its Inflation Report. The market is assuming that the Bank of England now has to act to prevent the severe crisis risk it outlined in previous press conferences. However as the UK is currently around two and a half years from departing the European community, the BoE has time on its side: half a year of pondering the implications of Brexit, and then two years of full membership to consider post-Brexit.
The first thing the BoE will consider on Thursday is where the UK economy was before the referendum. The answer is the economy had low unemployment, strong real wage growth, and a consumer boom as typified by the record trade deficit. Looking forward, the new government is likely to implement fiscal stimulus, the BoE may ease monetary policy through a combination of lower interest rates and unconventional methods, and the fall in sterling will provide an economic tailwind. In layman’s terms, we have a healthy economy, operating at near full capacity, that is about to be given a shot in the arm from a fiscal, monetary, and exchange rate perspective. On the negative side, the UK economy is going to experience some potential slowdown in two and a half years’ time, as barriers to trade with our neighbours are likely to be implemented. With some associated falls in potential capital expenditure and consumer confidence before this.
The tailwinds look capable of more than matching the headwinds over the next two years. Indeed, if you are a business and have any spare capacity that needs to be used ahead of the Brexit deadline (for example a UK based car manufacturer), the logic should be to produce at full speed before the trade barriers are increased, especially given the fall in sterling. It looks like UK exporters are in a great position until the spring of 2019.
The BoE’s own forecasts pre-Brexit show inflation returning to or above target over the next couple of years. The problem the BoE now faces is that the benefits of Brexit (looser fiscal policy, looser monetary policy, and the lower exchange rate) will occur well before the potential headwinds in 2019. The monetary authorities like to work in a counter cyclical fashion, however the economic damage that could occur from the decision to leave could well be delayed. In fact acting aggressively early could well result in a mini boom, which will make the eventual delayed event of Brexit appear even more severe. For these reasons, the BoE should not be too aggressive in easing monetary policy on Thursday.
The chances of a recession and deflation in 2019 will depend on how the UK economy adjusts to its new role in the world. Or just maybe, in two and a half years’ time market mechanisms such as the exchange rate and the fact the UK has had time to prepare for leaving the EU will mean the market will be focused on new issues and not an event that could seem like a distant memory.
We have written about quantitative easing (QE) many times over the years, yet there remains more to be said: the great QE experiment is not yet over. Given the result of the EU referendum, speculation is rife as to whether the Bank of England will embark on another round of QE to stimulate the UK economy; arguably making this a good time to debate the efficacy of such strategies.
It’s safe to say that the most surprising aspect of QE has been the lack of inflation, but central banks which have undertaken – or are still undertaking – QE claim that it has worked by preventing deflation through portfolio rebalancing. The shift in funds into riskier assets has led to higher stock markets. My take on this? Central banks are over exaggerating their claims at best, or grabbing at straws at worst.
Let’s take the US model experience as an example. I agree that the Fed’s balance sheet and S&P 500 index have been positively correlated since 2009, but I would argue that the relationship is casual, not causal. The Fed announced its QE programme only after US stock markets had collapsed to cheap levels, and stopped it only once those markets had recovered. As such, the Fed seemed to use the S&P index as a temperature gauge for the economy (“the share price of the country” as it were), rather than the index appreciation being the direct result of the QE activity undertaken. QE started when stocks were cheap, and finished when they became fair value.
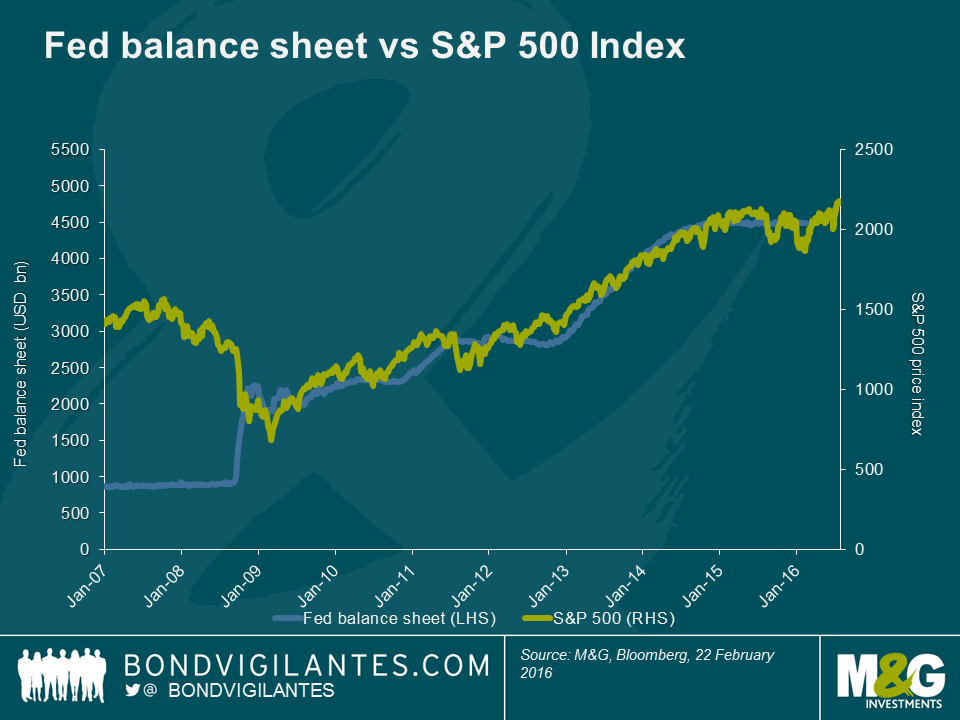
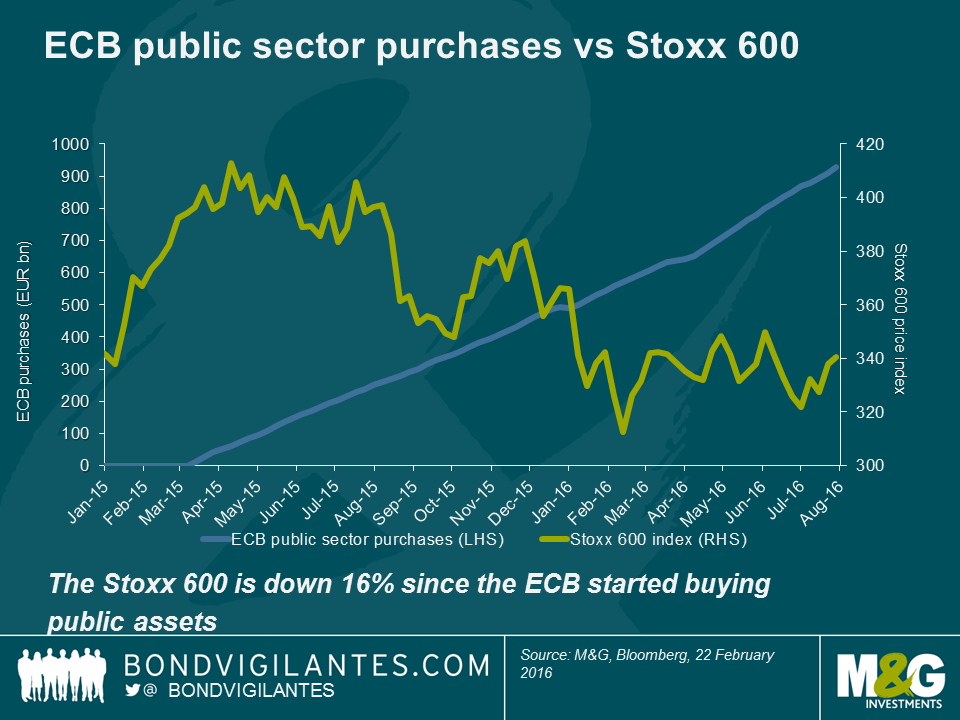
Not yet convinced? The above chart demonstrates a coincidental relationship, but what about other economies? The QE experiment in Europe was initiated in March 2015, a time when the Stoxx 600 equity market was much more buoyant, and not trading at distressed valuation levels. It seems ludicrous to argue that a causal link has been in play in Europe. This is illustrated below.
So what have we learnt? QE appeared positive for risk assets when their valuations were depressed in the US, but had little impact when equities were fairly priced in Europe. Because interest rates have already fallen to a large extent (thereby lowering the discount rate that equity investors use), investors will not be able to boost the present value of future cash flows. This means that it is difficult for equity market valuations to increase to the same extent as previously when yields collapsed. Given the sluggish economic outlook and potentially higher interest rates in the US, it is also difficult to argue that profits in the future will be much higher as well.
QE does have some economic effects; it’s just (I’m not ashamed to say) still difficult to discern just what these are. It hasn’t yet been inflationary (even though the basic principles of QE suggest that increasing the supply of money should reduce its value) and I believe that the link to stock market strength is somewhat illusory. Arguably, the greatest effect of QE has been the reduction in bond yields across the curve and not a portfolio rebalancing into riskier assets. In theory, the portfolio rebalancing effect is most powerful when investors view equities as an alternative to bonds. Given the difference in volatility characteristics of both asset classes, it is unlikely that this will ever be the case (some investors still choose to buy negative yielding fixed income securities for example). If the Bank of England is hoping that QE will prop up the UK economy and inflation through a causal link then the current economic data supporting this theory is mixed at best.
There has been much discussion recently that by introducing negative rates central banks are effectively taxing savings. This is self-explanatory, and is one of the criticisms of how negative rates can distort economic behaviour. This however is not a new phenomenon. Let’s not forget that money has always been effectively clipped by the traditional enemy of savers – inflation. Fortunately, holders of cash have traditionally been compensated for depositing it in a bank account by receiving interest payments. But is this something that is now at threat with negative rates?
If you take the Bank of England rate as a proxy for the interest earned on cash and adjust for inflation (i.e. subtracting RPI from base rates), although negative nominal interest rates are a new phenomenon, real negative rates are not. If we expand this thinking to include the historic rate of basic income tax, we can attempt to fully depict what can be considered the real rate of return on cash. This gives a more accurate reflection of what savers have actually earned in real disposable income per annum and as you can see from the chart below, this has been negative in the UK for much of the past ten years.
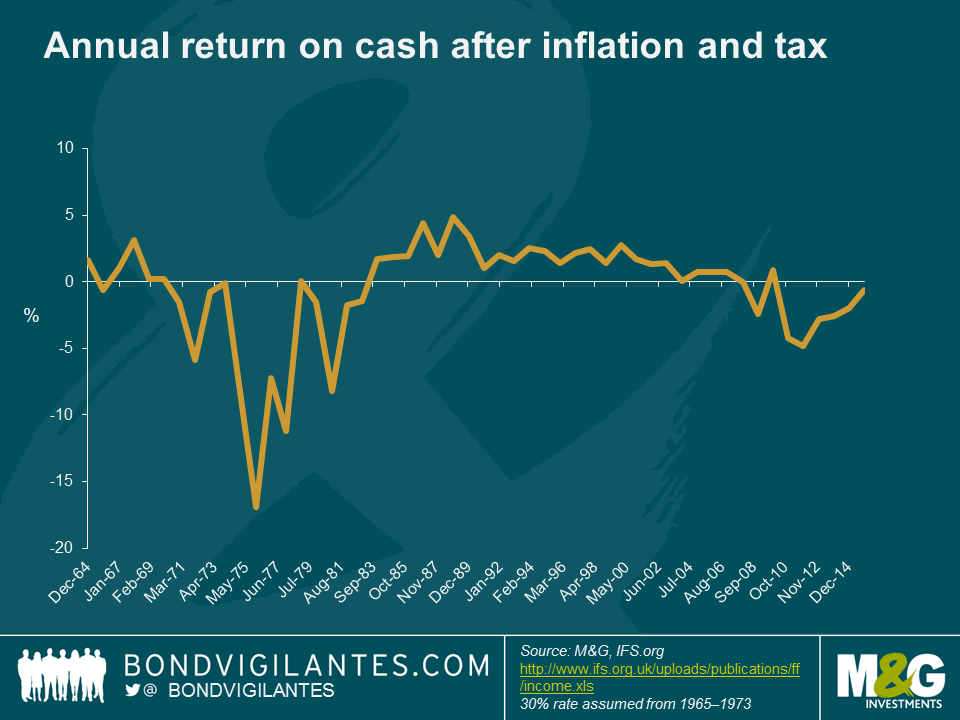
Given the recent outcry regarding the effect of negative rates on savers one has to believe that they are suffering from the economic concept of money illusion. This ‘savers illusion’ is a function of them focusing solely on the nominal rate and ignoring the true level of return after inflation and tax. (Remember that negative interest rates are more likely to occur in a deflationary environment, so it is still possible to earn a positive real return).
Focusing at the extreme and the 45% highest tax rate, the table below helps to illustrate the real return to these savers in various interest rate and inflation rate scenarios. As one would expect, high nominal interest rates and low inflation are beneficial for savers at all tax levels.
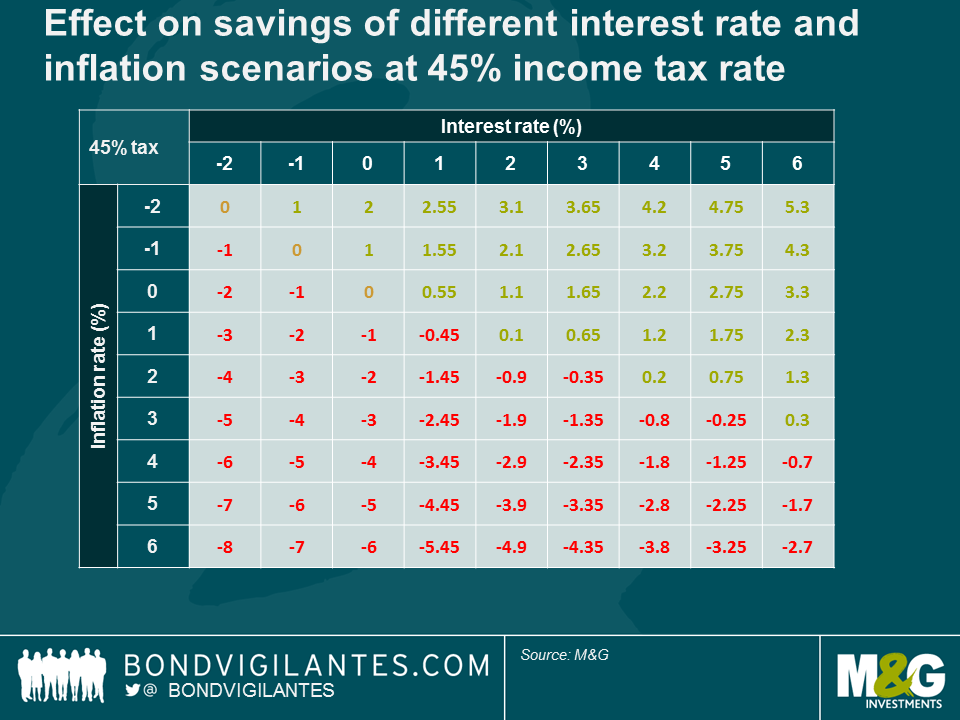
But one of the most interesting results occurs at zero or negative rates. The tax rate of the saver becomes irrelevant at this level; as no income is generated, no income tax can be levied. Also, although the tables illustrate a negative rate, in reality savers can get around this by holding physical cash. This is something we have talked about before, along with the elimination of currency and the nature of cash. Negative and low nominal interest rates are new, low and negative real returns both pre and post tax are not.
And whilst we are on the subject of eliminating cash it’s worth noting the ECB’s announcement about stopping printing the €500 note. By taking this action the ECB is recognising an antisocial demand for its notes (tax evasion, crime), although there remains a strong suspicion that it’s also because cash storage disrupts the transmission mechanism of monetary policy at negative rates. The ECB has, however, allowed the notes to continue to be legal tender, and presumably demand for the note will still be strong. If that’s the case could we see the €500 note trade at a premium? If so, what would that premium be? There must be some calculation based on the additional storage costs incurred by hoarding cash in lower denomination notes?
There is currently a lot of concern regarding the US economy and its ability to withstand the collapsing price of oil and mined commodities, the Chinese slowdown, and the recent quarter (yes, quarter) point rate rise – or given the current market mood, its ability to cope with a doubling of the Fed funds rate! Whilst high yield spreads are close to recessionary levels, this is skewed by the energy sector. The manufacturing side of the economy is in clear decline, but the services sector is more significant for US growth and is performing much better (although the non-manufacturing ISM is well off its recent highs). The US yield curve is some way from being inverted, which has historically signalled recession, although it has been flattening and needs to be steeper. We think the Fed remains on track to continue raising rates as it should be focused on the data that points to a strengthening labour market.
If the outlook from an economic and industrial output perspective were grim then companies would be shedding labour in the most traditional manner, by firing people. The graph below shows that the private sector is firing the lowest percentage of the working age population in the past 15 years. This is a sign of continued labour market strength, and the low level of job cuts points to a continuing trend of healthy employment numbers.
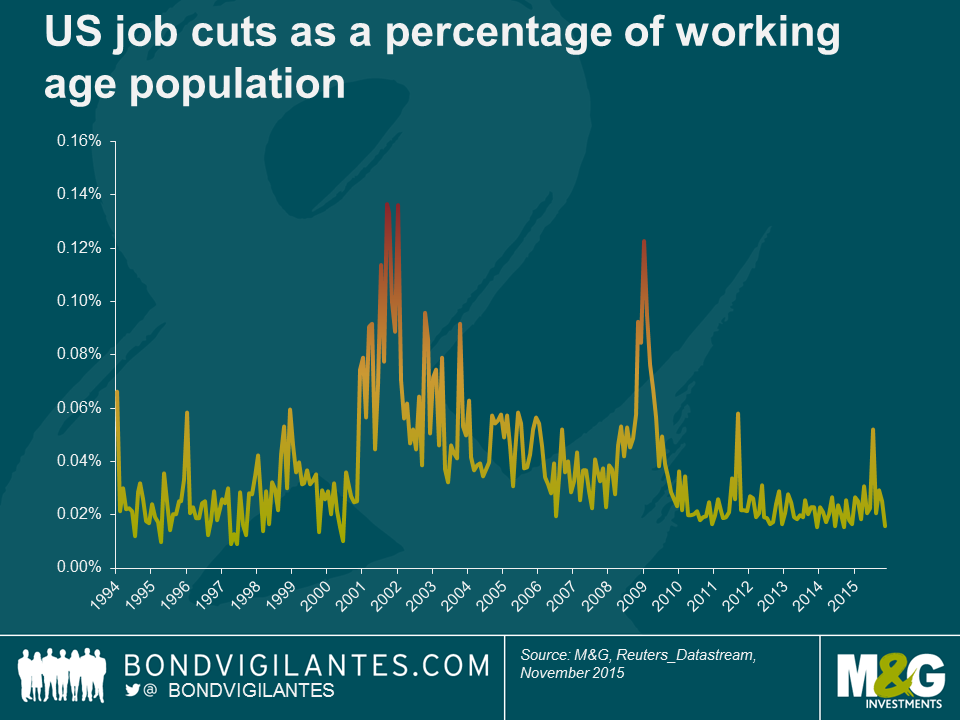
When analysing labour market and economic strength economists talk about the level of natural unemployment. In that context one can imagine there should be a natural rate of job cuts below which the economy cannot go. After all, there will always be some employers in difficulty, and thus requiring to shed labour. From the chart above one could infer that the natural rate is around 0.02%, meaning in this context the US labour market continues to look strong.
If the US economy was going to be pushed into recession then surely we would have had some signs by now, because oil has been in a bear market for more than a year, the Chinese stock market in a bear market for nine months, the mined commodity market in a bear market for two years, and the minor move in rates was fully anticipated (and delayed).
The economic reality is that falling oil prices help the economy, falling commodity prices are a supply rather than a demand issue, the Chinese economy is not a significant input into the US economy, and interest rates and Fed policy remain exceptionally accommodative. The stock markets, commodity markets, and the economy do not always move in tandem. The Fed should not focus on these indicators. Its mandate is not to support the stock market or the commodity market, but to support the labour market. The Fed should therefore remain vigilant, and not get sidetracked by noise that has little effect on the long term outlook for inflation, or the short term outlook for the labour market.


Sign up to the Bond Vigilantes mailing list to ensure you never miss a great article from our expert Bloggers. We will email all new articles to your inbox, meaning you can stay on top of the world of Bonds.
I confirm that I would like to receive information about Bond Vigilantes and products and services from M&G Securities Limited.
We will use the email address and personal data you have shared with us to send you this information. For existing customers, submitting your contact details and requesting to receive this information from us, will replace any earlier choices you have made in respect of marketing information.
You can unsubscribe from marketing at any time, at which point we will not send any further marketing information to you, by selecting the unsubscribe link in all communications.