economics
18 April 2024

One of the most commonly reported themes in financial markets today is the fear of disinflation/deflation, and how monetary authorities need to take economic action to avoid becoming the “next Japan”. In February I commented on the fact that the fear of disinflation and deflation is not as logically straight forward as you may think. I think the common assumption that developed economies do not want to end up like Japan is also worth investigating.
Japan is commonly seen as the modern poster child of ineffective monetary and government policy. The policy errors of the Japanese authorities in the 1990s are seen as having resulted in a depressed economy that has stood still over the last 25 years. This view has partly come about as financial markets often simply judge an economy by observing how its equity market performs. Given the crash in the Nikkei from over 40,000 in the early 1990s to around 16,000 today, equity market performance as a measure of Japanese economic health has become engrained in the market’s psyche.
In reality the strength of economies should be measured by their economic output and not equity market performance. In this regard, at first glance the national data bear out that Japan has lagged most countries in terms of nominal and real economic growth.
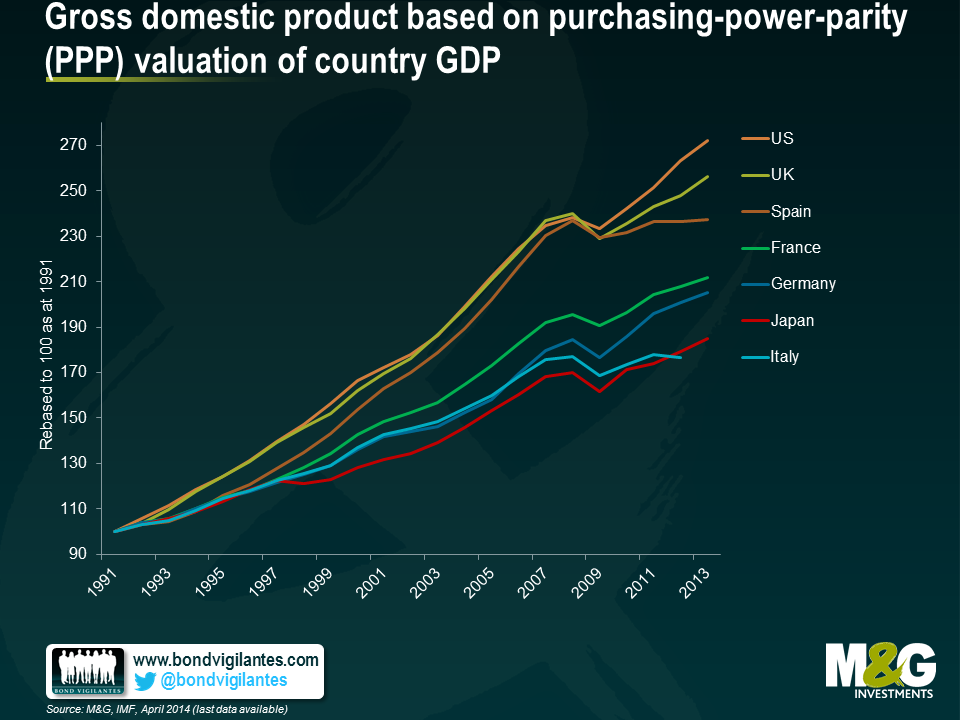
The simple measures of nominal and real GDP are often regurgitated as to why we do not want to end up like Japan. But from an economist’s point of view, what matters most is GDP per head. The fact that one country grows more than another is not to be celebrated economically if it is in fact engendered solely by an increase in population.
Below is a chart of real GDP per capita. It shows that Japan has not been an economic failure from a local point of view. Rather, the Japanese economic experience has actually been quite positive in terms of increasing living standards for the average Japanese citizen over the last 25 years.
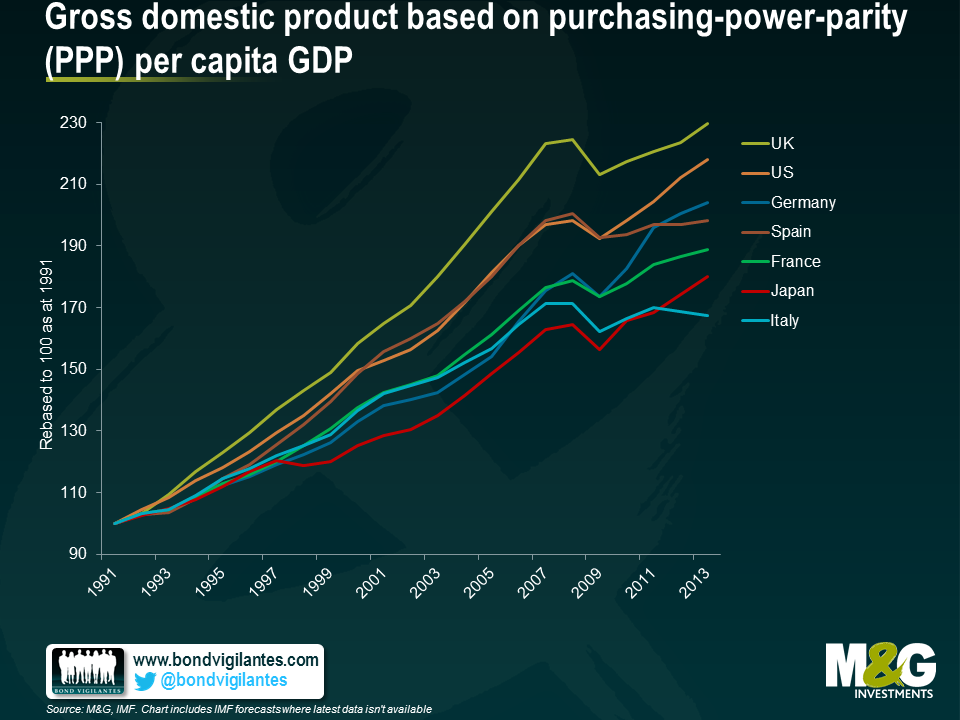
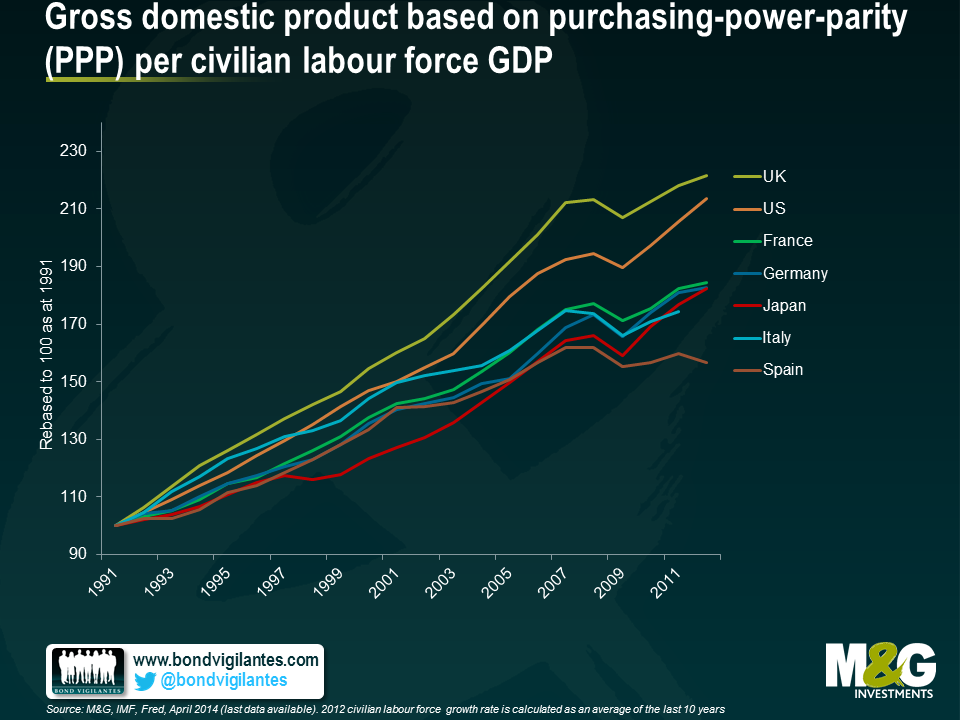
However the chart above shows Japan still lagging; no wonder economists still fear a Japanese outcome. Nevertheless I believe that a truer measure of GDP should not only be correlated to the number of people in its national boundaries, but should be seen in the context of the shifting function of the long term demographics of the population. A country with a baby boom will experience strong GDP in the boom, and weaker GDP at the end of a population bulge. Workers retire; consumption and investment fall. In order to take into account the true GDP per head, one has to put this into context, by looking at the size of the working population, not just the size of the actual population. Below we chart GDP per head of working population. This adjustment allows a fairer reflection of GDP per head, with the Japanese situation improving on a relative basis again.
What lessons can we learn from Japan ? Firstly it is not as bad as it looks given the true potential GDP per head of population. In fact monetary and fiscal policy has worked in Japan. Low inflation and the zero bound of monetary policy is something we and policy makers naturally fear. Maybe we fear it too much based on simple analysis of headline numbers.
Interest rates – both short and long term – are at record lows in Europe. The driving force behind this is the belief that both employment and inflation will be lower for longer. This is something that concerns the ECB and Drahgi’s Jackson Hole speech implies further easing ahead. These appear to be exceptional times.
The story of how we got here is pretty simple: a global banking collapse in 2008, followed by a further severe bout of local damage to the banking system in Europe caused by the sovereign debt crisis in 2011 and 2012.
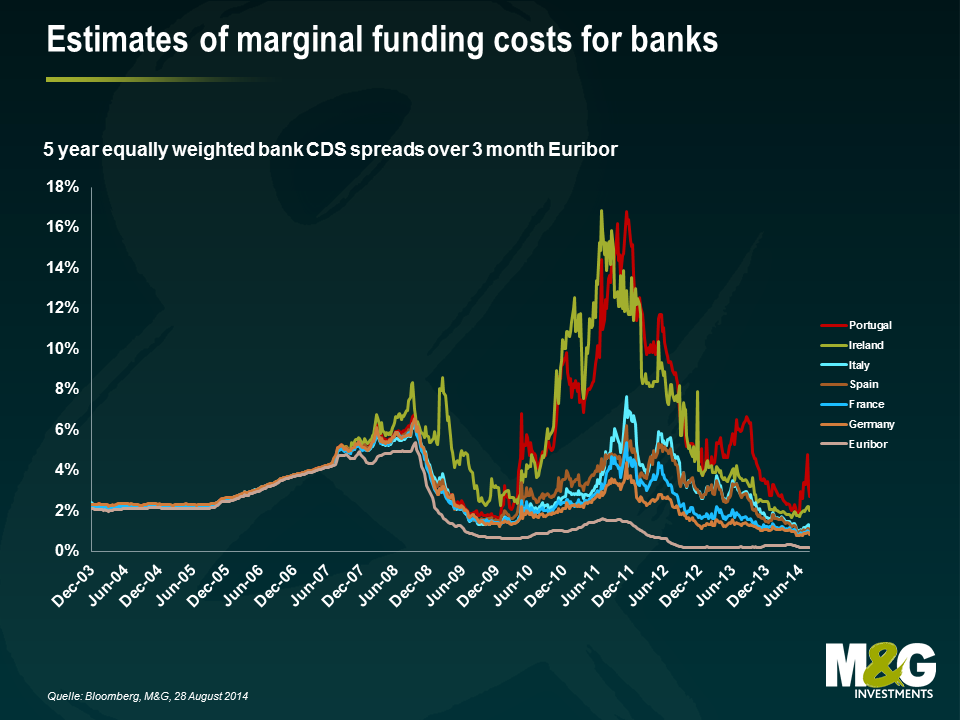
The chart below is an attempt to illustrate where true borrowing rates have been. Taking a proxy for the cost of finance and adding that to three month Euribor gives a better picture of real monetary conditions than by simply looking at the headline ECB rate. Monetary policy in the Euro crisis was tightened in the core, but more so in the periphery.
In the following charts we break out the inflation and employment data of the core and the periphery. What we see is that where tighter monetary policy is applied unemployment is subsequently higher and inflation is lower. It is not surprising that the Euro area and particularly the periphery have been weak given the severe monetary shock they took in the Euro crisis. This suggests that monetary policy still works.
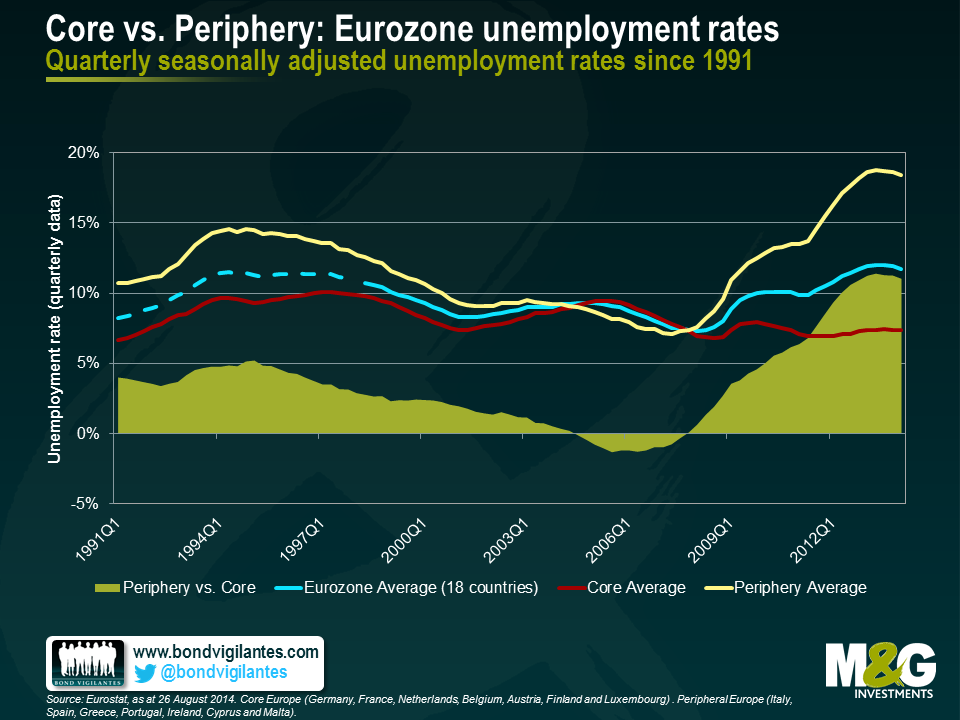
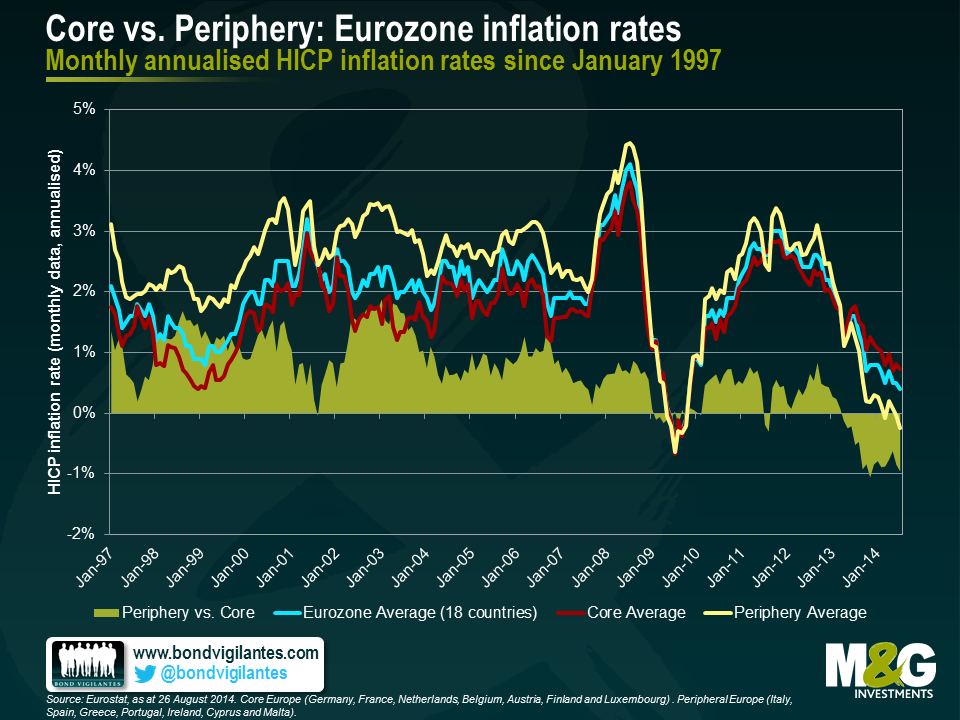
Going forward, real monetary policy has effectively been eased aggressively from the summer of 2012 through to now. This should provide a boost to the Euro area, and in particular the periphery. Monetary policy is generally assumed to work with an 18 month lag and interestingly unemployment is already heading down. I expect this trend will continue.
We are in exceptional times from an interest rate perspective, but from an economic perspective unemployment has been this high before from 1994 to 1997, and inflation was below 1.0% in 1999 and 2009.
When economics deviates from markets you have to decide which is correct. I think that monetary policy works, and the huge easing from 2012 will bring about falling unemployment and prevent significant deflation. Exceptionally low interest rates in Europe seem out of line with the current and potential future economic data.
There has been a lot of comment recently on the slimming down at Barclays investment bank. This has generally been couched as a change in business plan, with less of a focus on fixed income, commodities and derivatives, to a less capital intensive more traditional model. One of the interesting things for us is that this is not an idiosyncratic event, but part of a trend.
Barclays, like RBS, UBS, and Credit Suisse, has decided to reverse its pre crisis ambition of being a dominant player in the global fixed income market. From a pure opportunity set this seems strange as the huge increase in volume of outstanding corporate and government debt is potentially an enormous business opportunity. So why the retreat?
Like any company that exits a business line, presumably it’s because Barclays believes it is or will be less profitable. Despite the expansion of fixed income markets, banks are less able to make money due to a change in their cost of capital. Regulators have effectively reduced the banks’ ability to make money, via constraints on leverage ratios, which are a good thing from a bondholder’s perspective but increases their effective costs and reduces profitability.
However, this banking trend also has a European flavour. The firms scaling back their ambitions are all non US banks. Why the difference across the Atlantic given both economic blocks have faced harsher regulation and more capital requirements? We think North American banks have a natural advantage versus their “alien” investment bank counterparts in three ways.
Firstly they operate in the largest capital market in the world. This gives them strong economies of scale compared to those whose ‘national champion’ home market advantage is in smaller markets.
Secondly, even when comparing the big US capital markets with the second largest Euro capital markets, the European players have a disadvantage. The euro is a single market, but banks are constrained nationally. They are all large relative to their domestic economy, which makes the home regulator understandably nervous, imposing higher capital, leverage and loss-absorbing debt requirements on the banks in their jurisdiction. This is less of an issue in the US, where the geographic regulated area and the currency coincide for a significantly greater percentage of their business. Therefore the US regulator can be more relaxed about having large banks.
Thirdly, globalisation is also resulting in more dominance from US non-bank corporations, whether that be through their innovation, or their own natural economies of scale in the US. This can be seen over the last year with Vodafone selling its wireless business to Verizon, Liberty Global buying Virgin Media, and the potential attempts by Pfizer to take control of Astra Zeneca. It is natural for US businesses to work with US banks, and the development of large corporations with large funding needs means there needs to be a large capital market. All these things point to a reinforcing increase in the relative size of the US capital markets. This is one of the factors that has been driving the increase in the relative sizes of the European and US investment grade bond markets, as illustrated in the chart below.

Barclays’ reduced ambition is part of a banking trend. We have seen these kind of moves before in the banking sector where bank management move together in the same direction. The lesson from these recent moves is that globalisation will not only change the face of the world economy, but will benefit those nations not only who are efficient and innovative, but have the largest efficient domestic markets, thus allowing economies of scale. Good news for the US listed companies, and a potential issue for the rest of the world.
Yesterday’s UK Budget had one major surprise, the relaxation of rules regarding drawing down your pension. This means that from April 2015 you can draw down your pension pot in one go, to do with it as you wish. This policy move chimes with the coalition’s beliefs that one should take responsibility over one’s own finances. However, like all political decisions there may well be an ulterior motive behind the timing of this decision.
We talked previously about why a dovish central banker appointment at the Bank of England was politically expedient two years ahead of the May 2015 election. The current government had its last opportunity yesterday to add a last feel-good give away Budget to enhance the economy and its own electoral prospects. At first glance, what has it achieved with its surprise change in pension policy?
It has potentially released a huge wave of spending commencing April 2015. This will obviously make people feel wealthy as the cash literally becomes theirs as opposed to being locked away for a rainy day. The economic effect looks as though it would be too late to boost the economy ahead of the 2015 general election. However it is highly likely that the forthcoming pension pot release will be taken into account. Holidays would be booked ahead of the windfall, cars could be purchased, redecorating done, and Christmas presents bought as the promise of money tomorrow means you can run down saving and consume today. This pension release scheme will spur growth in the UK ahead of the election.
The particular neat trick of this policy change is that it is a giveaway Budget measure at no cost. This is because it is not the government giving away money, but it is simply giving people access to their own money. Fiscal stimulus at no cost, combined with low rates and a strong government sponsored housing market means the UK will continue to have a relatively strong economy.
There is currently a huge economic fear of deflation. This fear is basically built on the following three pillars.
First, that deflation would result in consumers delaying any purchases of goods and services as they will be cheaper tomorrow than they are today. Secondly, that debt will become unsustainable for borrowers as the debt will not be inflated away, creating defaults, recession and further deflation. And finally, that monetary policy will no longer be effective as interest rates have hit the zero bound, once again resulting in a deflationary spiral.
The first point is an example of economic theory not translating into economic practice. Individuals are not perfectly rational on timing when to buy discretionary goods. For example, people will borrow at a high interest rate to consume goods now that they could consume later at a cheaper price. One can also see how individuals constantly purchase discretionary consumer goods that are going to be cheaper and better quality in the future (for example: computers, phones, and televisions). Therefore the argument that deflation stops purchases does not hold up in the real world.
The second point that borrowers will go bust is also wrong. We have had a huge period of disinflation over the last 30 years in the G7 due to technological advances and globalisation. Yet individuals and corporates have not defaulted as their future earnings disappointed due to lower than expected inflation.
The third point that monetary policy becomes unworkable with negative inflation is harder to explore, as there are few recent real world examples. In a deflationary world, real interest rates will likely be positive which would limit the stimulatory effects of monetary policy. This is problematic, as monetary policy loses its potency at both the zero bound and if inflation is very high. This makes the job of targeting a particular inflation rate (normally 2%) much more difficult.
What should the central bank do if there is naturally low deflation, perhaps due to technological progress and globalisation? One response could be to head this off by running very loose monetary policy to stop the economy experiencing deflation, meaning the central bank would attempt to move GDP growth up from trend to hit an inflation goal. Consequences of this loose monetary policy may include a large increase in investment or an overly tight labour market. Such a policy stance would have dangers in itself, as we saw post 2001. Interest rates that were too low contributed to a credit bubble that exploded in 2008.
Price levels need to adjust relative to each other to allow the marketplace to move resources, innovate, and attempt to allocate labour and capital efficiently. We are used to this happening in a positive inflation world. If naturally good deflation is being generated maybe authorities should welcome a world of zero inflation or deflation if it is accompanied by acceptable economic growth. Central banks need to take into account real world inflationary and deflationary trends that are not a monetary phenomenon and set their policies around that. Central bankers should be as relaxed undershooting their inflation target as they are about overshooting.
Under certain circumstances central banks should be prepared to permit deflation. This includes an environment with a naturally deflating price level and acceptable economic growth. By accepting deflation, central banks may generate a more stable and efficient economic outcome in the long run.
In my last blog I focused on the transition mechanism of financial policy in the UK, with government actions targeting the housing market, thus having the effect of loosening monetary policy. This encouraged us to look once again at the situation in Europe. Is the ECB any nearer making the monetary transmission system actually work?
Back in May 2011 we wrote about how the monetary system in the eurozone was not working effectively because different nations faced different interest rates in the private and public sector. One central bank rate was not being transmitted across the whole eurozone.
By using official money market rates as depicted by Euribor and adding bank CDS spreads as a proxy for the real cost of borrowing, we illustrated the difficulty the ECB was having in transmitting a single policy through a fractured financial system. We have brought the chart up to date below, and as you can see, the situation is no longer as extreme.
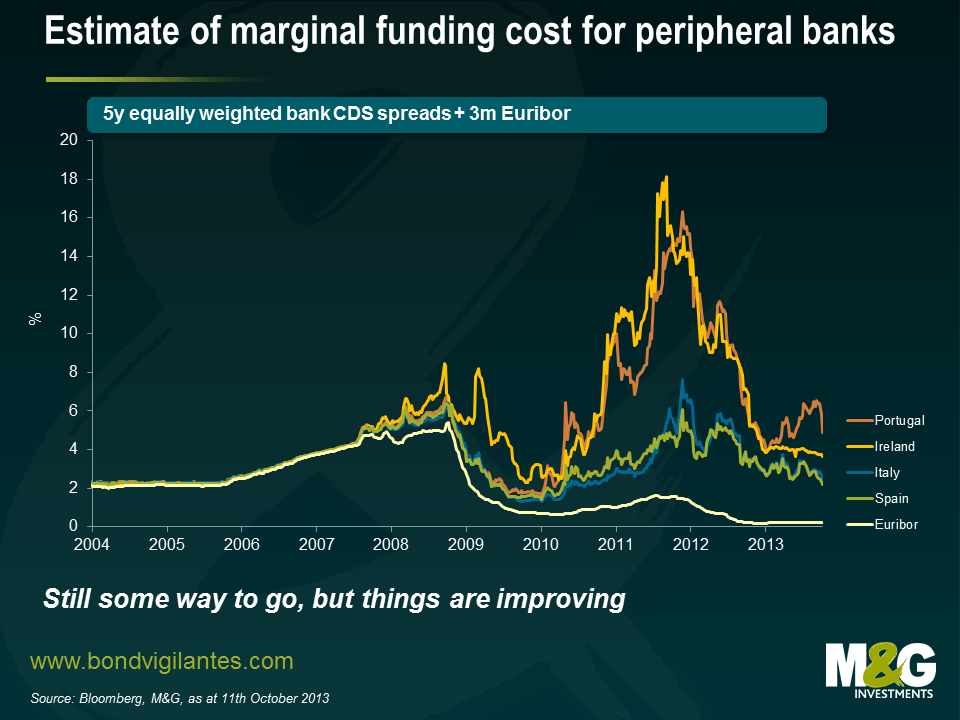
Thankfully, some semblance of order is being returned. The drag on growth from the massive fiscal adjustment that most of Europe has been through over the past few years could be petering out. Hopefully, less restrictive policy will point to future economic growth across the region. Although some progress has been made and funding costs have come down, access to credit remains restricted for many in the real world (see for example Ana’s blog from August). But if the ECB and the authorities can continue to heal the banking system then a virtuous circle of confidence could return to the eurozone, once again making loose monetary policy set by the ECB flow into the real world in the periphery.
Since we started writing these blogs almost 7 years ago we have spent an understandably great deal of time discussing Bank of England monetary policy in the UK, initially with regard to conventional interest rate policy and now in the context of the unconventional policies we see today.
The most recent unconventional twist for monetary policy is not emanating from the Bank of England itself, but is effectively coming directly from the government. The Help to Buy home ownership scheme is a direct attempt to make the monetary transmission system more effective, with its supporters claiming it is a way to get free markets working so that good borrowers can access appropriate funding, while its detractors claim it’s stoking a housing boom and fuelling the next crisis.
One of the ways that monetary policy in the UK works is through the housing market. Interest rate changes reduce the cost of financing, which increases disposable income, or allows an individual to own a larger house for the same mortgage payments. This creates immediate wealth via higher disposable income, economic activity via the associated services and goods consumption that occurs with house moves, and a wealth effect as house prices rise.
It has been pretty plain that the connection between official interest rates and rates available in the real world has broken down during the financial crisis, as the banking system has been repressed from a capital, confidence, and regulatory point of view. The authorities have tried to counteract this by providing capital, encouraging the raising of capital, and providing huge amounts of liquidity. However, the traditional mechanism of rates feeding into the real economy in the UK via the housing channel was limited.
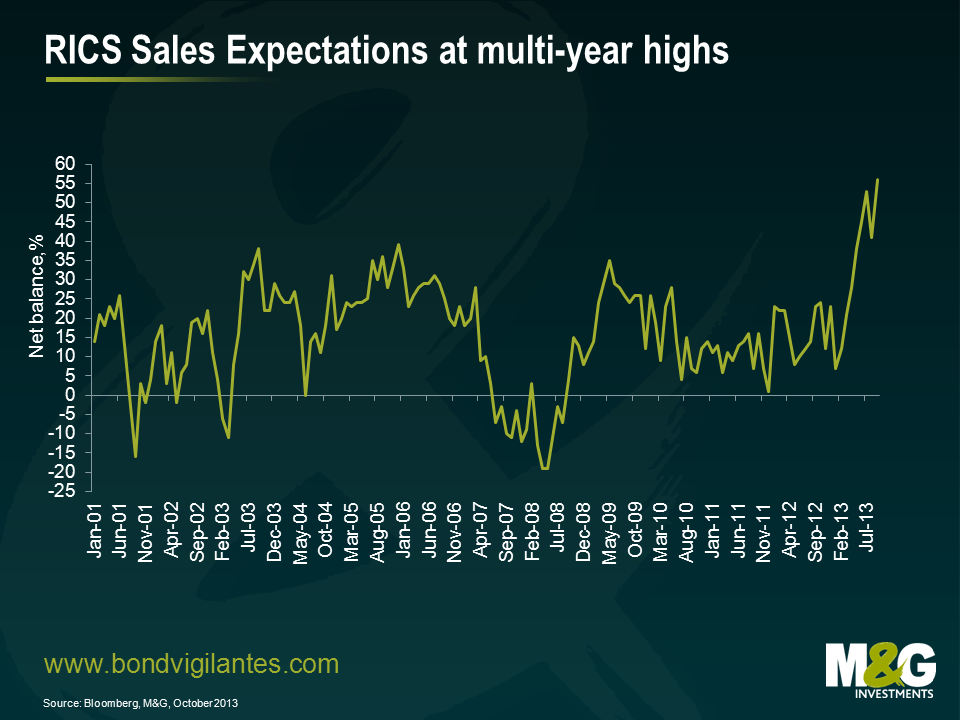
The Help to Buy and other schemes such as Funding for Lending are attempts to mend the disconnect between official rates, the banking system, and the real economy. Therefore they should be welcomed as an attempt to make monetary policy work again. This unconventional policy appears to be working. The UK housing market is strong. This week’s RICS survey showed that home sales in September reached a near four year high and the market is improving across the country, not just in London. As the chart below shows, there is potential for further strength in the future too, with sales expectations for the next three months reaching new highs.
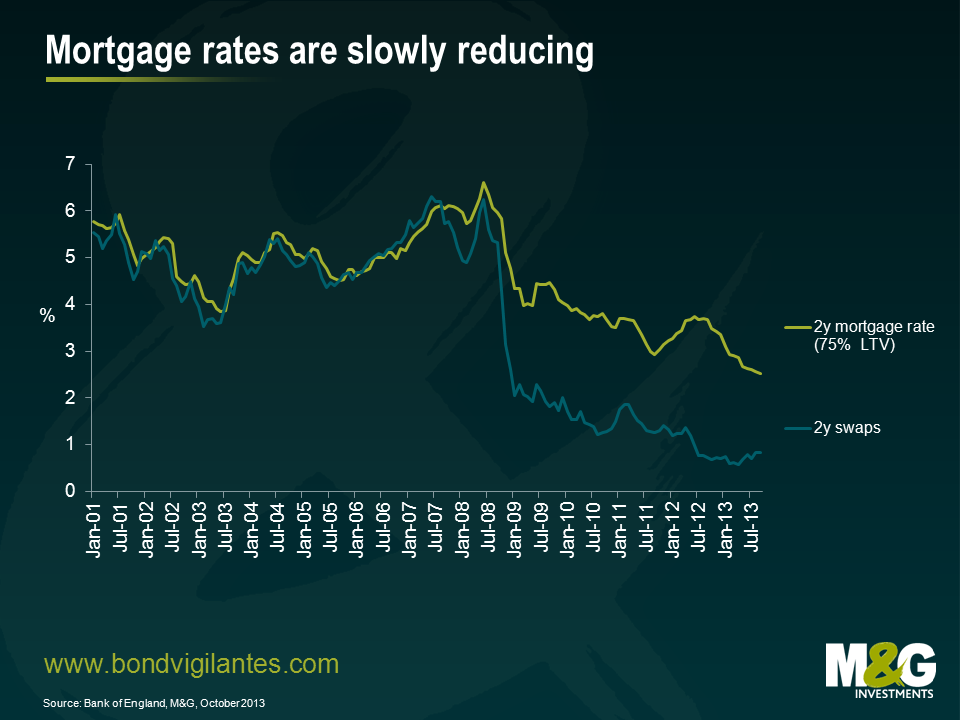
My next chart shows 2 year fixed mortgage rates plotted against 2 year swap rates. As you can see, although swap rates plummeted from late 2008, when official interest rates were slashed in the height of the credit crisis, these falls were not passed on to the same degree in the real world through mortgage rates. But they are now becoming slowly more aligned, as swap rates have been gradually rising recently and mortgage rates continue to fall. This is obviously good for the housing market and the economy. This effect is about to get bigger as the availability of low deposit mortgages should provide a strong boost to all the activity associated with housing.
Why has it taken so long to introduce this unconventional measure? It could have been a reluctance to stoke the housing market following the last crash, a belief that these kind of non-standard measures would not be needed, or it could be that it has been timed now in an attempt to push the economic cycle in line with the UK political cycle. The latter seems to be a consequence of the measures. They have been introduced in time to boost the housing market and the economy, and are set to expire before the election to encourage a rush of buying, as occurred with the removal of mortgage interest tax relief in the 1980s.
The UK economy looks set to be strong in the run up to the election as the disconnect between official rates and real activity gets resolved. The liquidity trap is being solved by government action. For better or worse, the UK housing market is going to be at the centre of UK economic activity once again.
When meeting UK clients we obviously spend a lot of time discussing employment and the relative strength of the UK economy. The chart below from the Bank of England shows the recovery in employment in comparison to previous recessions. It actually looks quite good versus the other mega recessions.
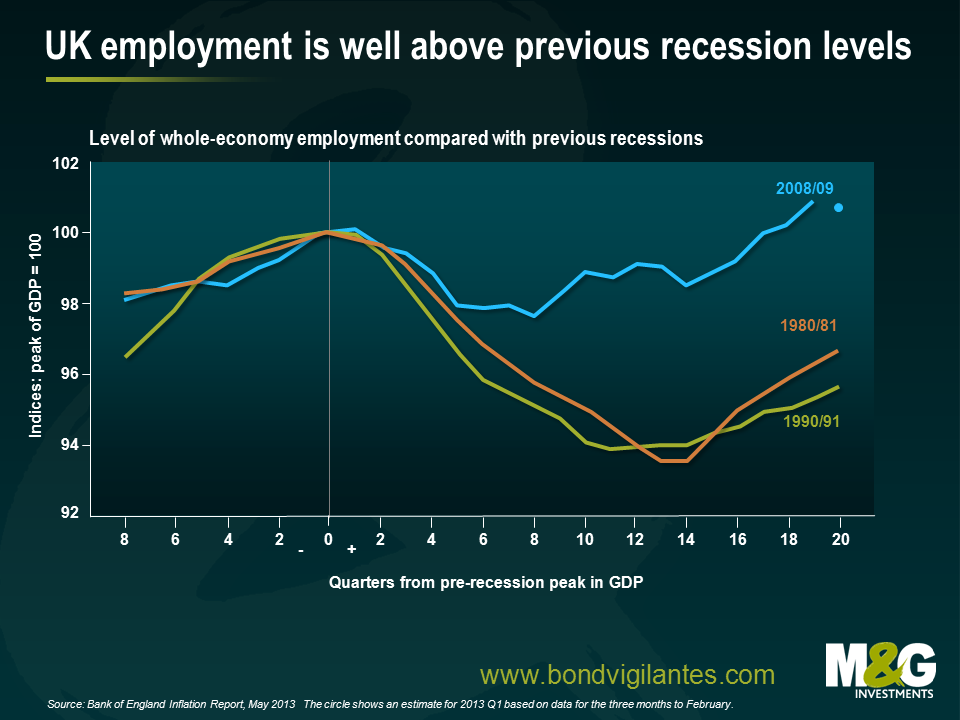
One very good common question we often get is along the lines that the employment number is “not real” as part time employment has gone through the roof.
The chart below shows part time employment as a percentage of the total number of workers in the UK. There is obviously an ongoing trend to part time employment that has continued from the peak of the crisis. It appears that part time employment increased relatively rapidly through the recession. However, since 2010 the ratio has been declining. Therefore the recent recovery in employment appears genuine and not flattered by part time workers.
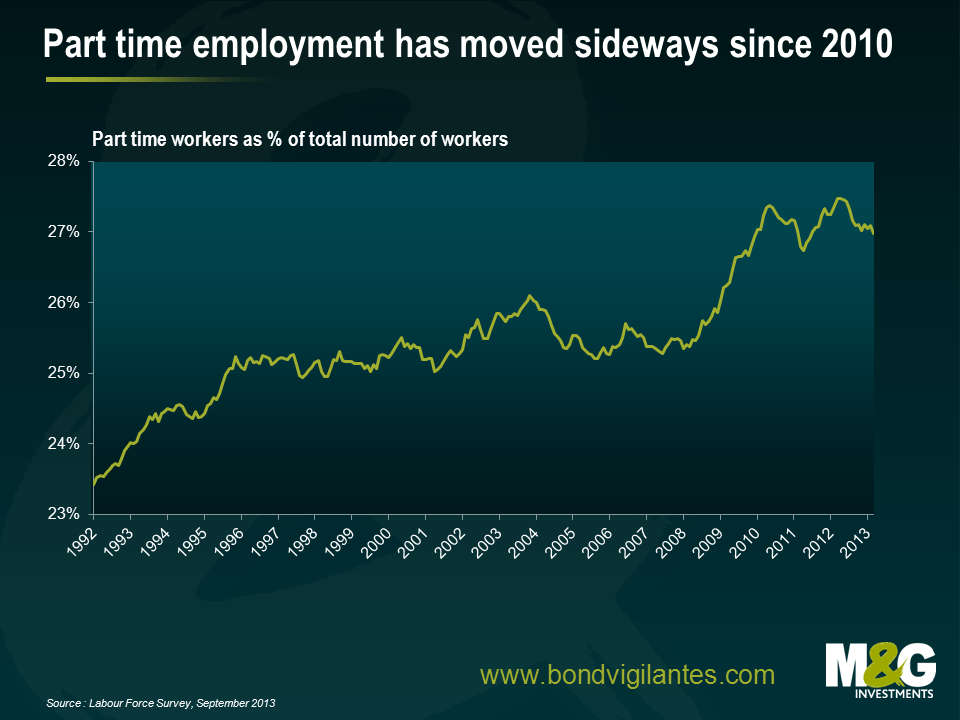
The UK economic recovery is real, and thankfully fiscal deficits, and interest rate policy have worked. The market’s fears of permanent recession are diminishing as reflected in the current bear market for UK gilts. The economic panic illustrated by very low yields where gilts became very dear (see this blog from January 2012), is over. The gilt market yield is returning towards better value, with ten year yields once again around three percent, as the UK economic recovery remains firmly on track.
Today’s release of jobless claims shows that the US economy is continuing its healthy response to the stimulus provided by the Fed. Momentum in the US labour force remains in a positive direction.
The very long term chart below shows today’s headline number of 331,000 to be relatively low historically. However, this is actually understating the current strength of the labour market.
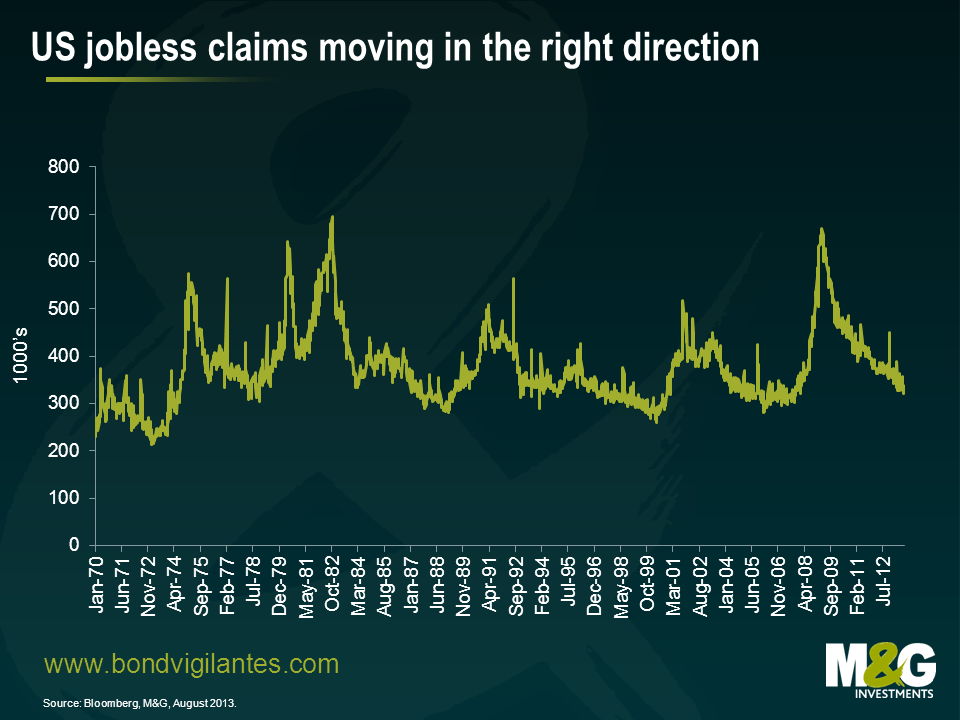
In order to interpret the jobless rate more effectively we need to look at it as a percentage of the ever increasing labour force, and not just the headline number. We have made those adjustments in the chart below.
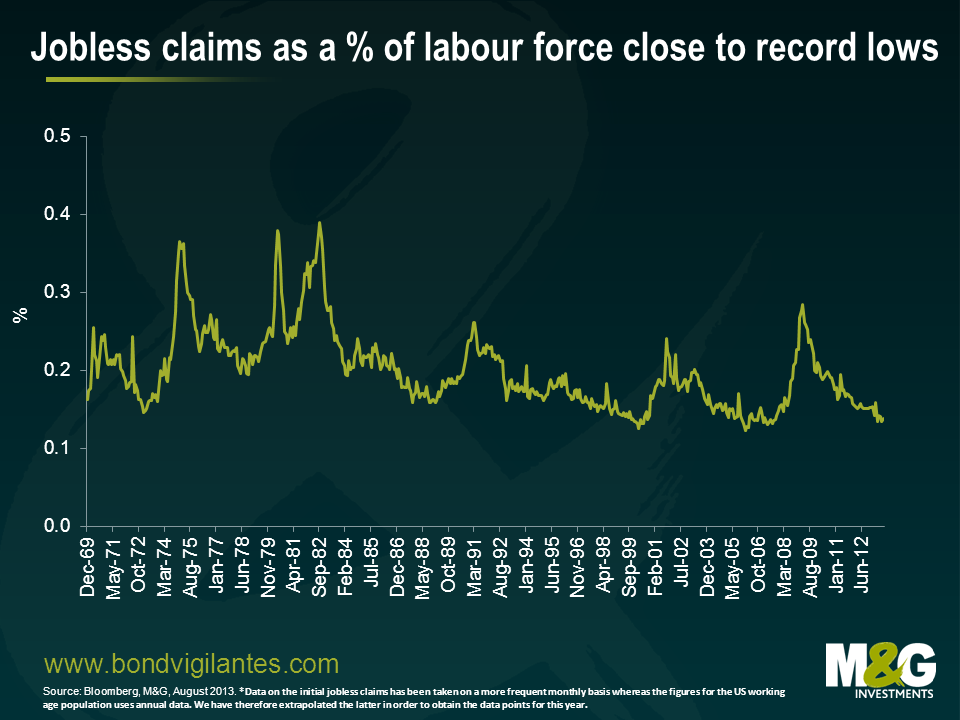
The fact that the economy has thankfully responded to low rates is good, though not new, news. However, the one thing that is very different this time is where we are in the interest rate cycle. At previous lows in jobless claims the Fed has typically been tightening to slow the market down. This time they are still in full easing mode with conventional and unconventional policy measures. This contrasts dramatically with the lows in jobless claims in the late ’80s and the beginning and the middle of the last decade, when the Fed was already in full tightening mode. This is highlighted in the chart below.
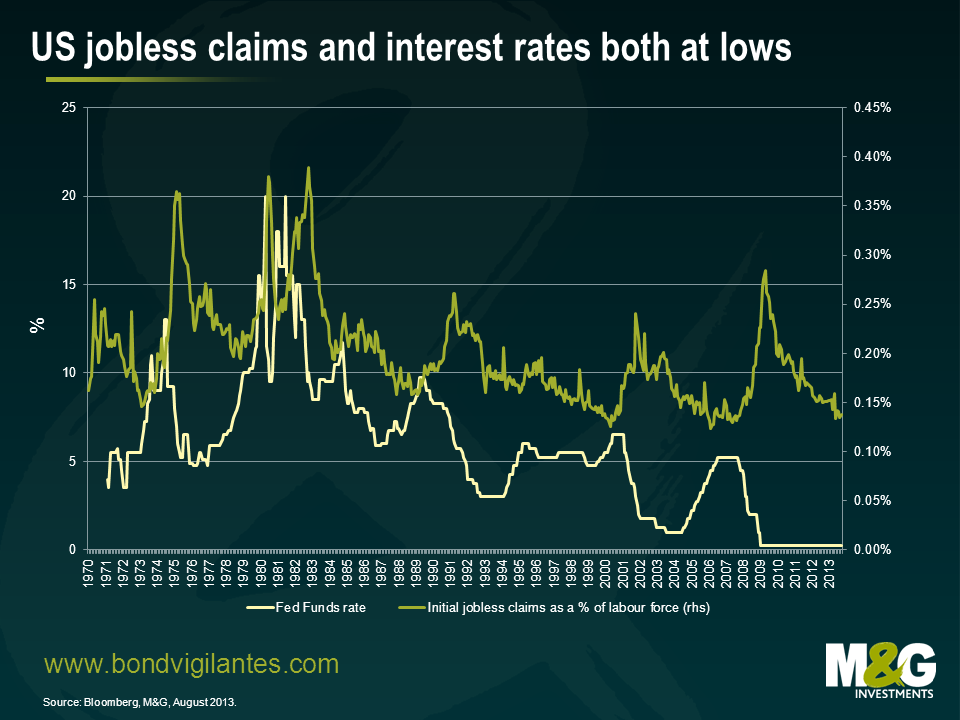
As you would expect to see, interest rate policy works with a lag. Given that we are unlikely to see conventional tightening for a while, one would expect the US economy to remain in decent shape.
A bear market in bonds can be seen as predicting a future normalisation of rates. If, like the Fed, you recognise that this time around things are not all normal, then you could expect short rates to stay low and employment growth to continue. The extent of the current bear market in bonds is therefore limited by the new environment we are in, where conventional economic systems have been amended and changed by the financial crisis.
The disclosure of the latest Federal Open Market Committee (FOMC) meeting minutes last night has pushed the US bond market to new lows for the year, further extending the current bear market in world government bonds. Looking at what the Fed is doing is nothing new. Back in the day when I first started, we had dedicated teams of Fed watchers, trying to work out its next move, as rate changes were frequent and unpredictable. The current policy is to make less frequent changes and be more transparent. So what does the FOMC’s forward guidance by providing its internal thoughts tell us today?
The committee knows that what is discussed will affect the markets, so a stylised version of its discussion needs to be produced. The release of the minutes is a manufactured and glossy disclosure of its work presented to make the FOMC look good and influence its followers. So what was the message from last night?
Well, it is more of the same about the need to tighten as we previously blogged here. The Fed continues to follow the script. The basic scenario is that they need to get the party goers out of the bar with the minimum trouble. This is why the Fed is keen for us to see that they discussed reducing the unemployment threshold at the last meeting. This is akin to saying ‘drink up’ to a late night reveller, with the hint that once they’ve done so there is a chance the bar staff will pour them another drink.
The Fed wants a steady bear market in bonds in this tightening cycle as it is still fearful over economic strength and fortunately inflationary pressures remain benign. This is very different from major tightening cycles in the past such as 1994, when the Fed was more keen to create uncertainty and fear in the bond market as they wanted to tighten rapidly and were still fearful of inflation given the experience of the 70s and 80s.
So when will official interest rates go up? Strangely you could argue that the successful creation of a steady bear market in bonds extends the period they can keep rates on hold. Monetary tightening via the long end reduces the need for monetary tightening in the conventional way. For example, as you can see from the following chart, the 100bps or so sell-off in 30 year treasuries since May has translated into a similar move higher in mortgage costs for the average American.
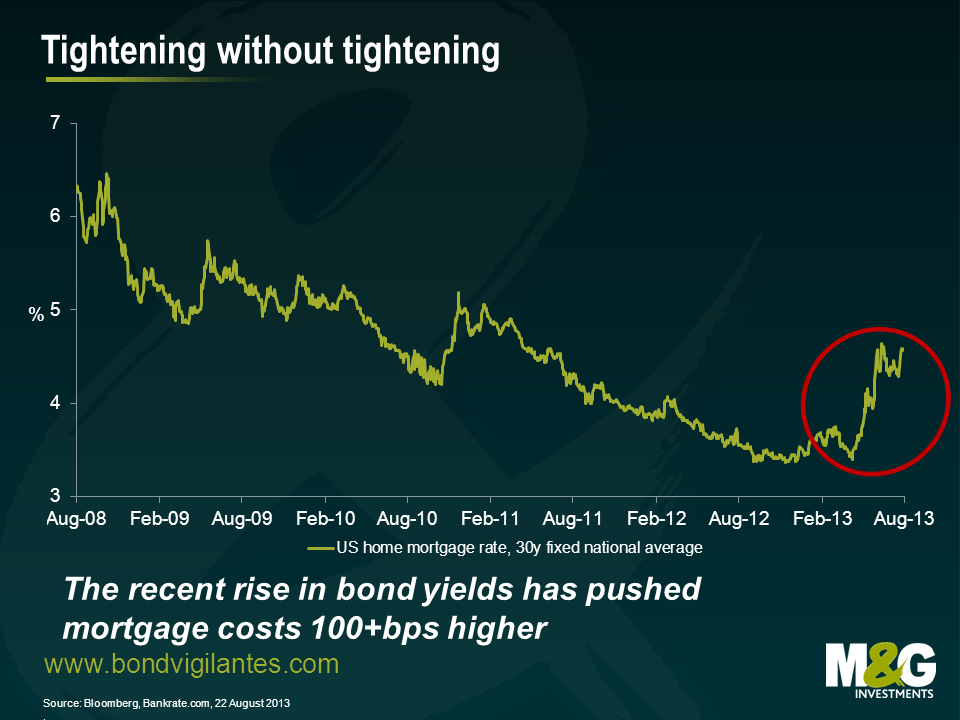
If the Fed has its way in guiding a steady bear market in bonds, then bizarrely short rates could indeed stay lower for longer.


Sign up to the Bond Vigilantes mailing list to ensure you never miss a great article from our expert Bloggers. We will email all new articles to your inbox, meaning you can stay on top of the world of Bonds.
I confirm that I would like to receive information about Bond Vigilantes and products and services from M&G Securities Limited.
We will use the email address and personal data you have shared with us to send you this information. For existing customers, submitting your contact details and requesting to receive this information from us, will replace any earlier choices you have made in respect of marketing information.
You can unsubscribe from marketing at any time, at which point we will not send any further marketing information to you, by selecting the unsubscribe link in all communications.