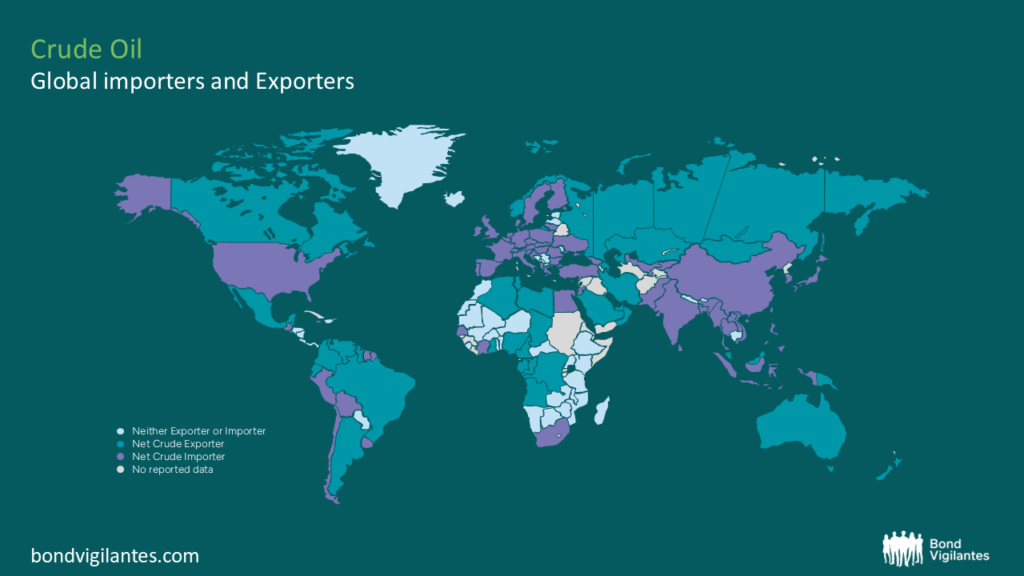
oil
Not all oil-exporting countries are the cracking winners you think.
By Charles de Quinsonas
4 June 2026


Once or twice a year, a dozen of us get together for a One Chart Lunch. As the name suggests, attendees are tasked with bringing a single chart of some description and presenting it to the table. Lunch is provided in return. The eagled eyed reader will notice some of the team failed the brief.
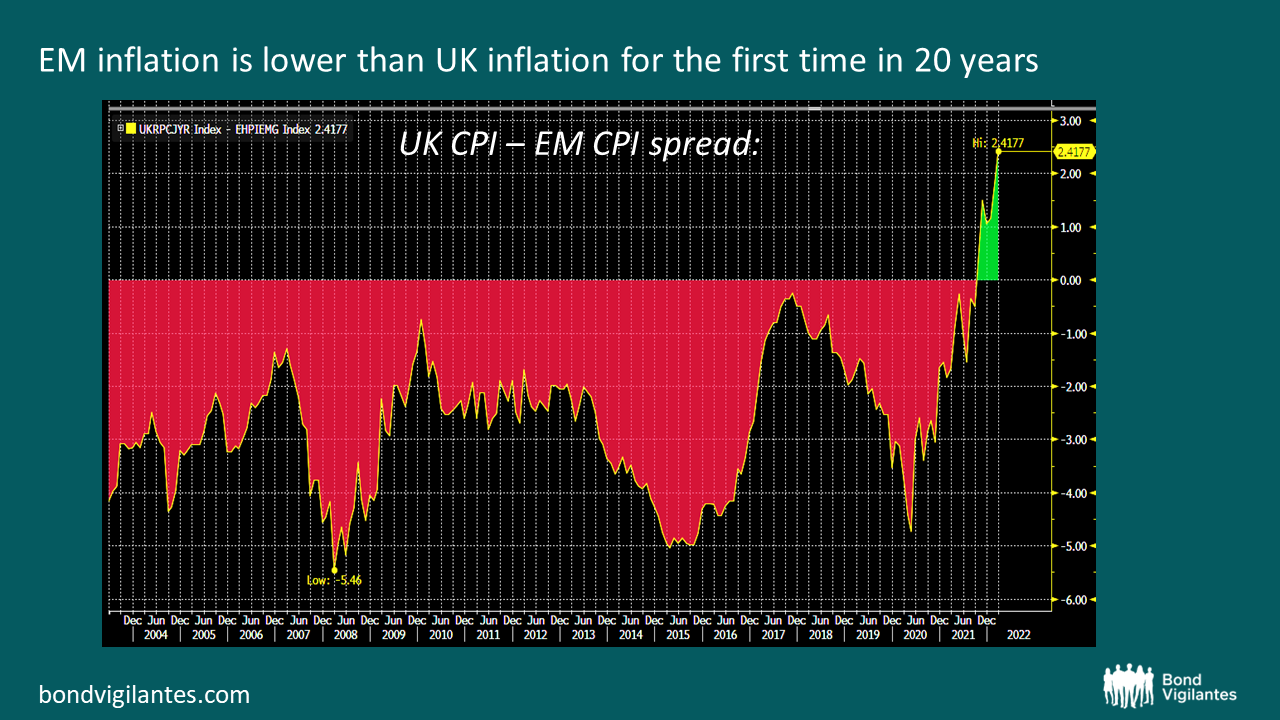
The content was varied, covering everything from Central Asian currencies and energy security, to Chat GPT and the growth in private credit. This year’s winner was Gareth’s submission, proof if ever it was needed that you can win by appealing to the lowest common denominator. Claudia’s submission showing that EM inflation is lower than the UK for the first time in 20 years, grabbed second place.
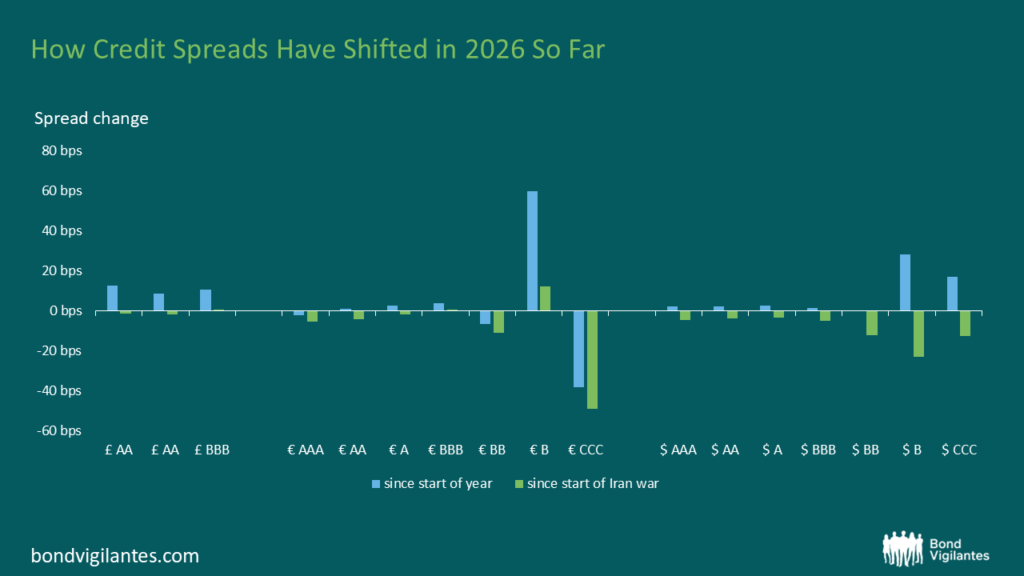
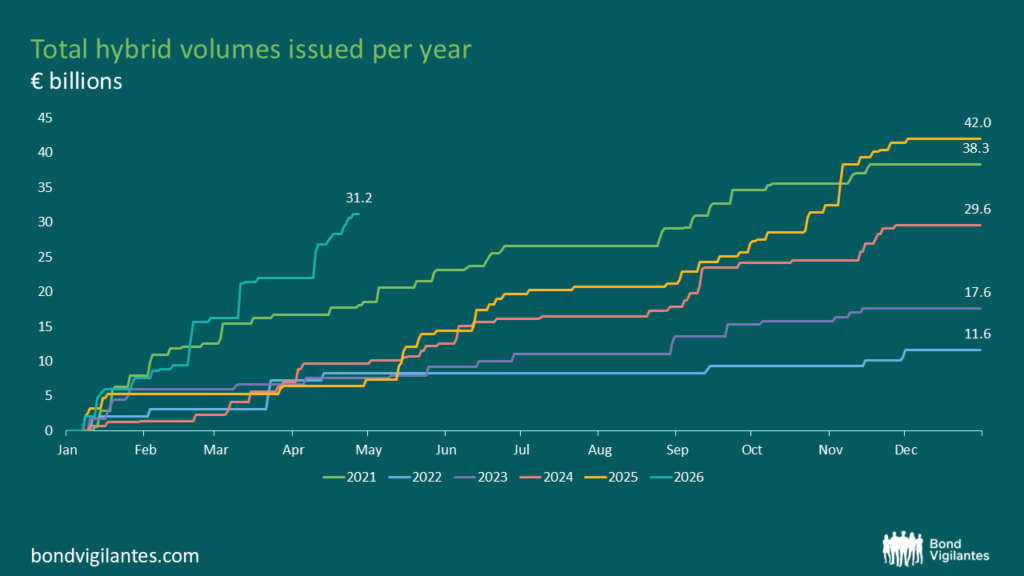
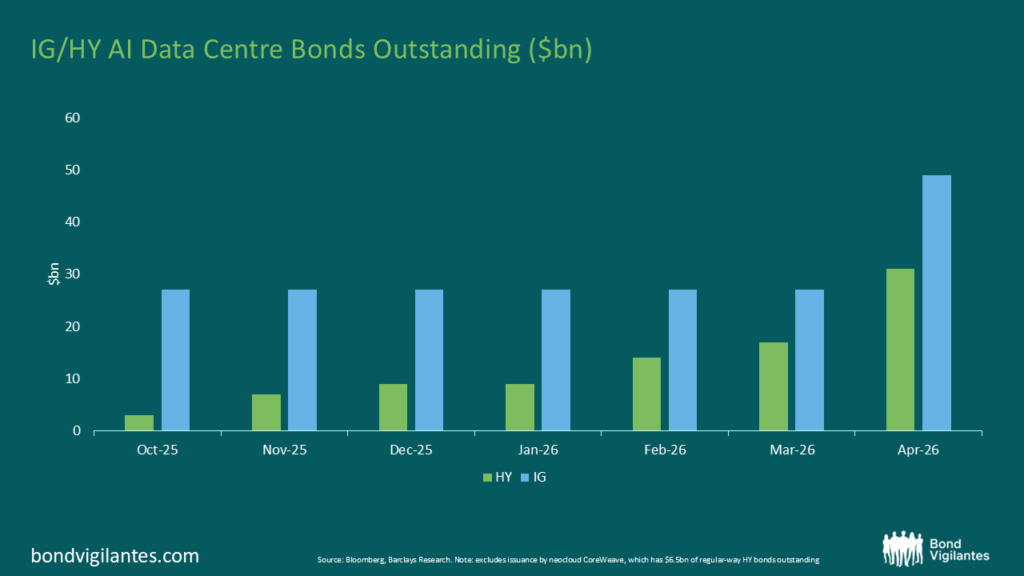
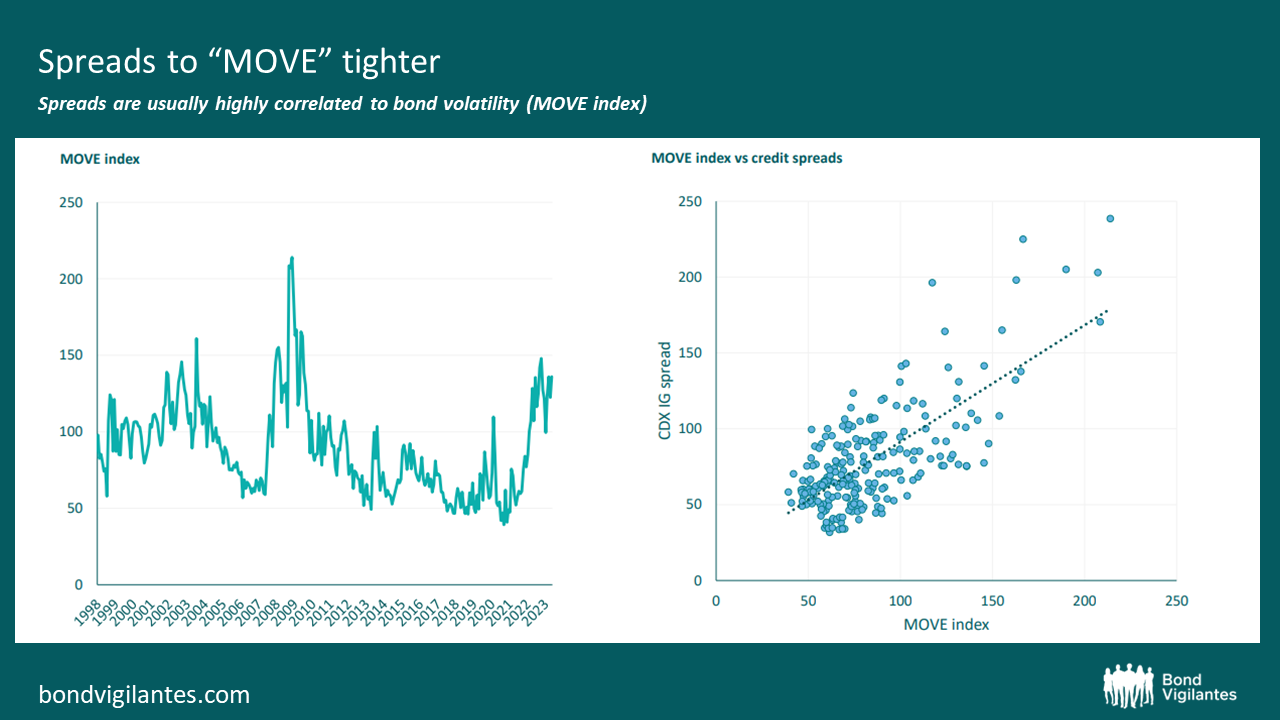
Take a look at the contenders below:
Source: M&G, Bloomberg
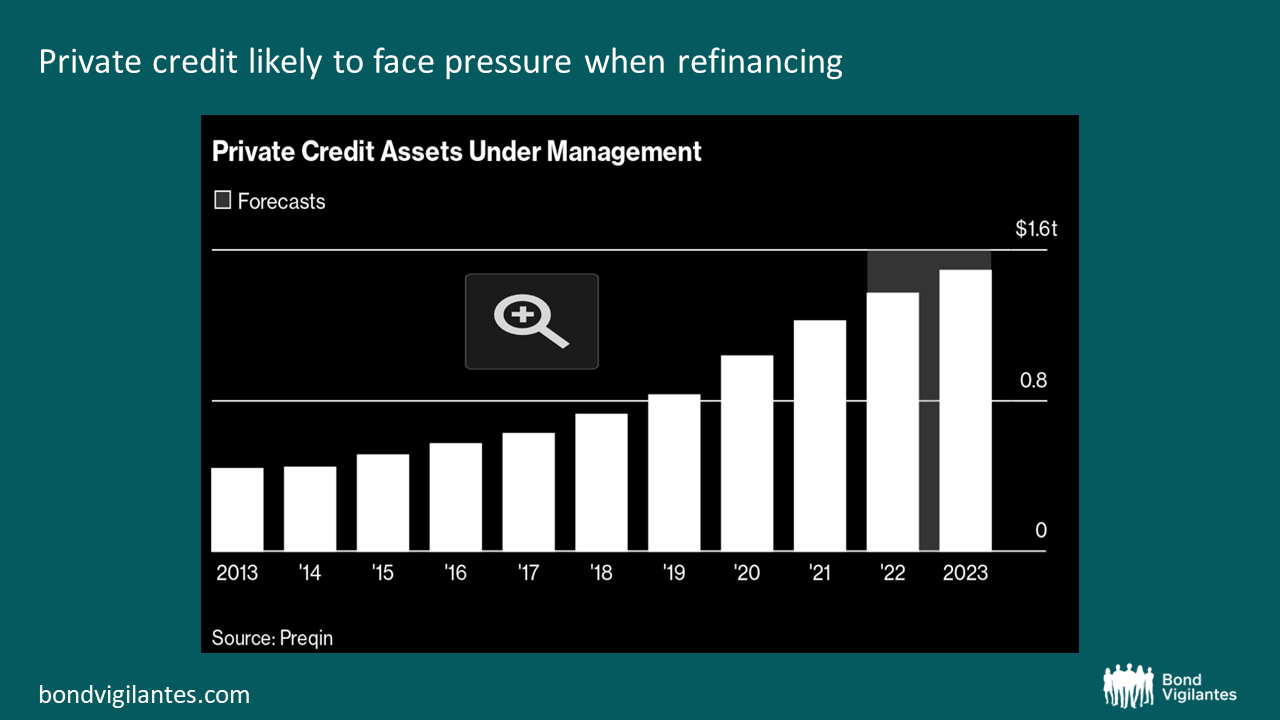
Source: Preqin, Bloomberg

Source: Bloomberg
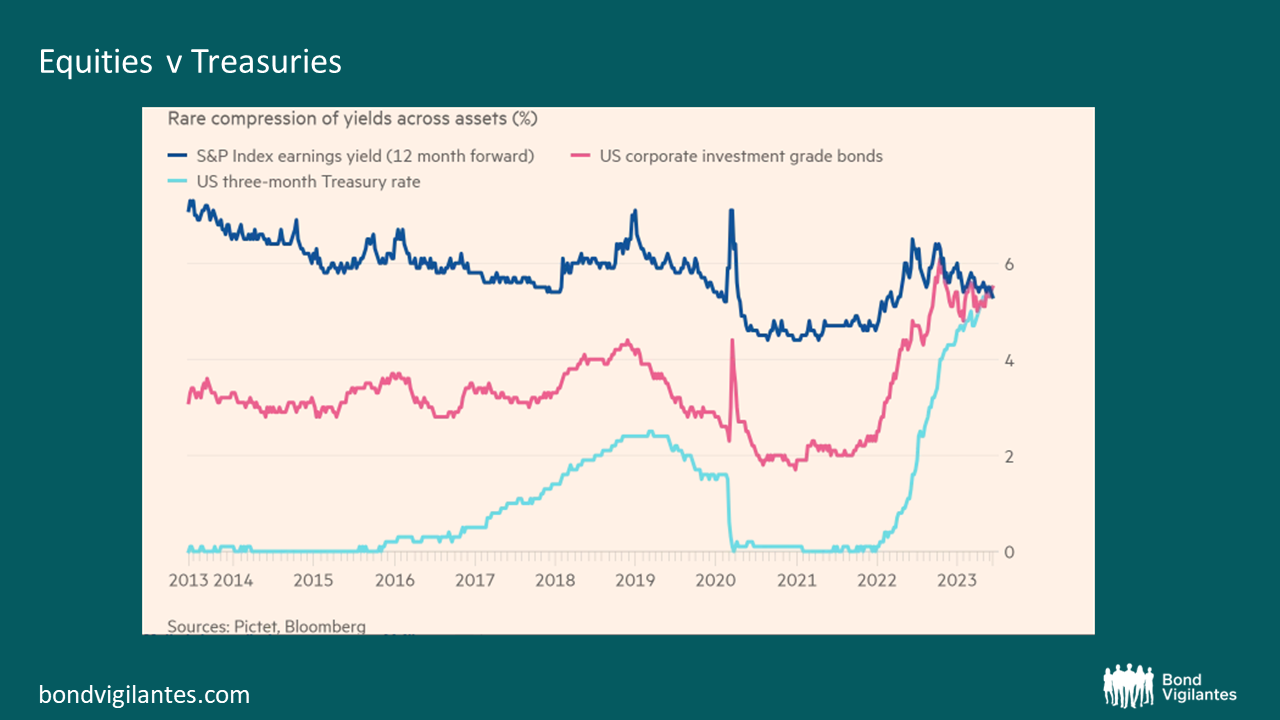
Source: FT, Pictet, Bloomberg

Source: OBR
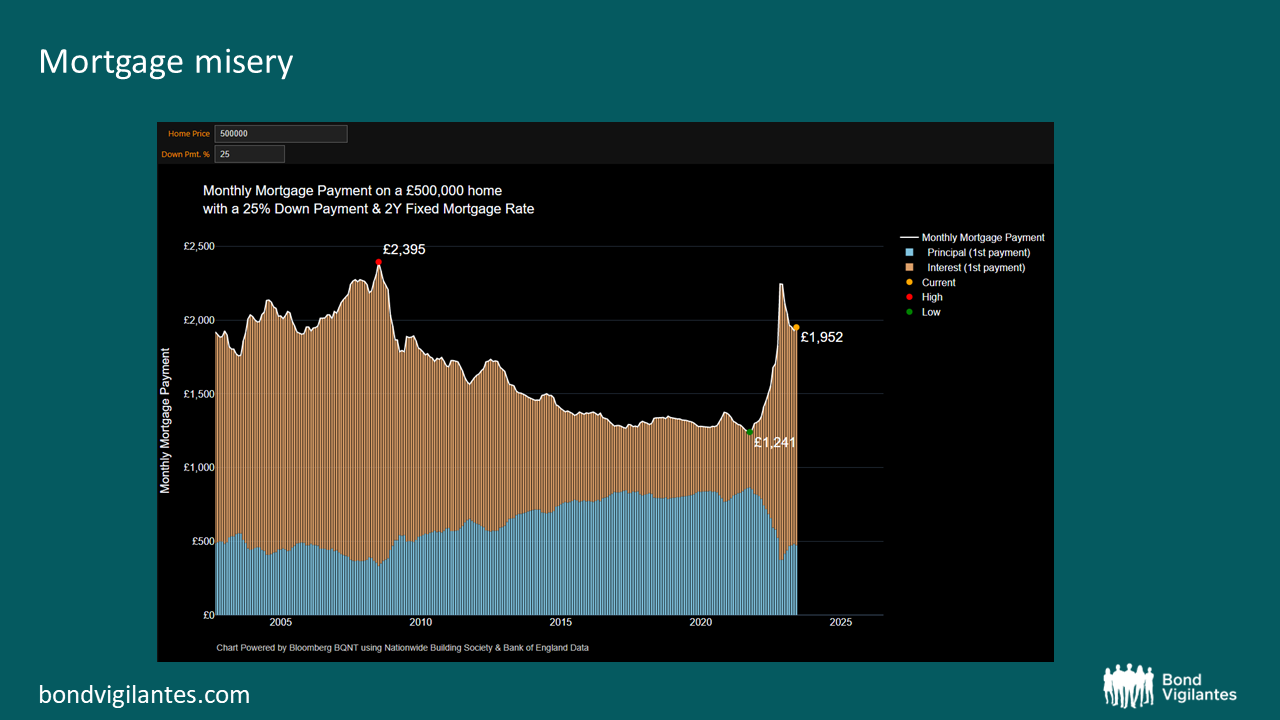
Source: Bloomberg

Source: S&P Global Ratings

Source: Deutsche Bank, Bloomberg Finance LP

Source: (LEFT) Datastream, Goldman Sachs Global Investment Research; (RIGHT) EPFR, Haver Analytics, Goldman Sachs Global Investment Research

Source: M&G, Bloomberg

Source: M&G, Bloomberg
Source: Bloomberg
As Claudia blogged last week, with concerns about sticky inflation in the UK and following the Bank of England’s surprise hike to 5% today (versus 4.75% expected), here’s a surprising chart: EM inflation is lower than UK inflation for the first time in 20 years.
Drivers on the EM side:
Drivers on the UK side:

Source: (LEFT) Deutsche Bank; (RIGHT) Gareth Jandrell / AI
There are undoubtedly reasons to worry about taking credit risk today. Central banks are tightening fast. The Fed just raised rates by 75 basis points (bps) bps as markets expected, while the Riksbank raised its policy rate by 100 bps with more on the way from the European Central Bank, Bank of England and others. Deutsche Bank points out that the ratio of global hikes to cuts over a rolling 12-month period has been as high as 25:1 recently having not being above 5:1 over the past 25 years of available good quality data. Central banks have insisted they will continue on this path until they see the whites of inflation, even if recession is the end result. Whether or not they will stay the course is a question for another blog.
Add to that war in Ukraine, a real estate crash in China, an inverted US yield curve, falling confidence indicators, substantially higher energy bills and mortgage rates plus capital markets that have been in retreat all year, along with likely overly optimistic earnings forecasts for the second half of 2022, and you can see why investors are concerned.
With that in mind, why are US High Yield (HY) spreads ‘only’ 181 basis points wider year to date, and Europe 170 wider? Several factors are at play.

First, it’s worth noting that the technical in the HY market remains very strong. Surveys often point to relatively defensive positioning amongst investors running high cash allocations. But this is merely the tip of the iceberg. According to data from Morgan Stanley, the US HY market shrunk by 8% in 2022. New issuance plus outflows has totalled -$96bn. Yet on the demand side, coupons, calls, tenders and upgrades to Investment Grade (IG) have totalled $246bn.
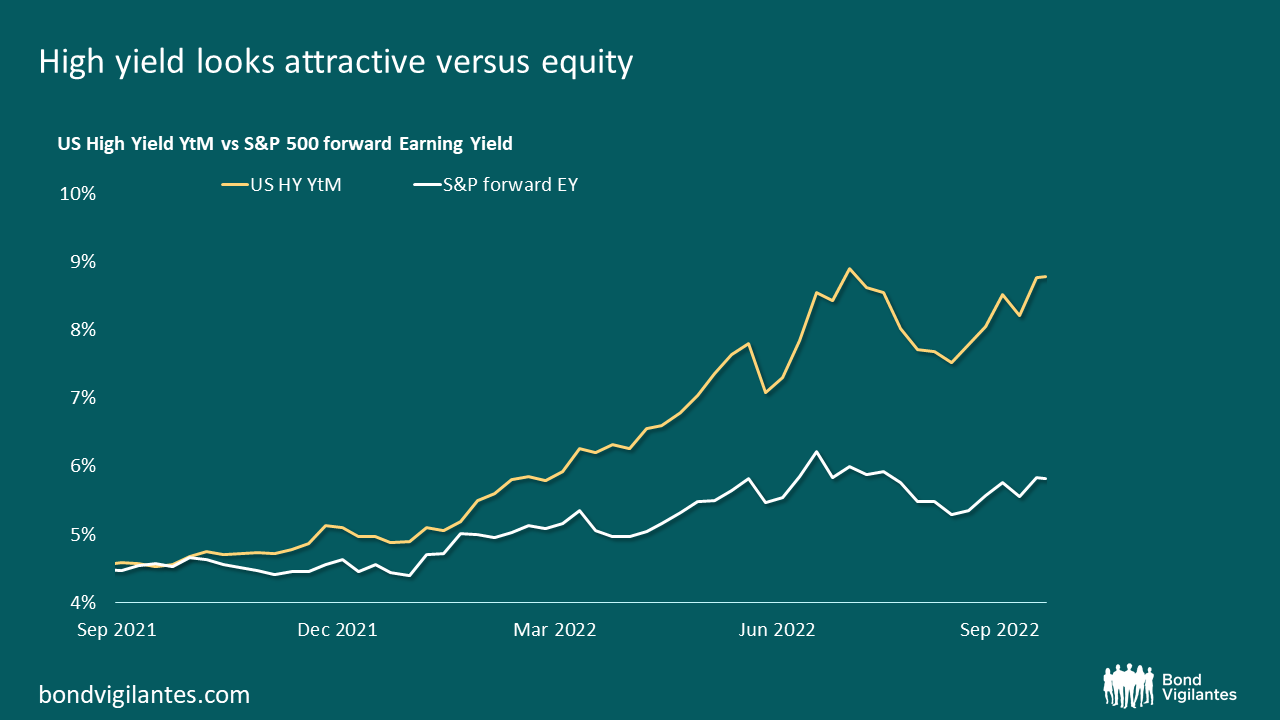
Second, whilst US HY spreads may only be in their 53rd percentile (measured over a time period since Lehman Brothers filed for bankruptcy up to today), all-in yields are in their 86th percentile. For European high yield it’s 72nd and 79th respectively. Put simply, all in yields have moved substantially higher and, at 8.8% and 7.3%, there is a lot more cushion in the price. Viewed relative to the earnings yield on the S&P 500, the yield US HY looks more attractive than it has for many years.
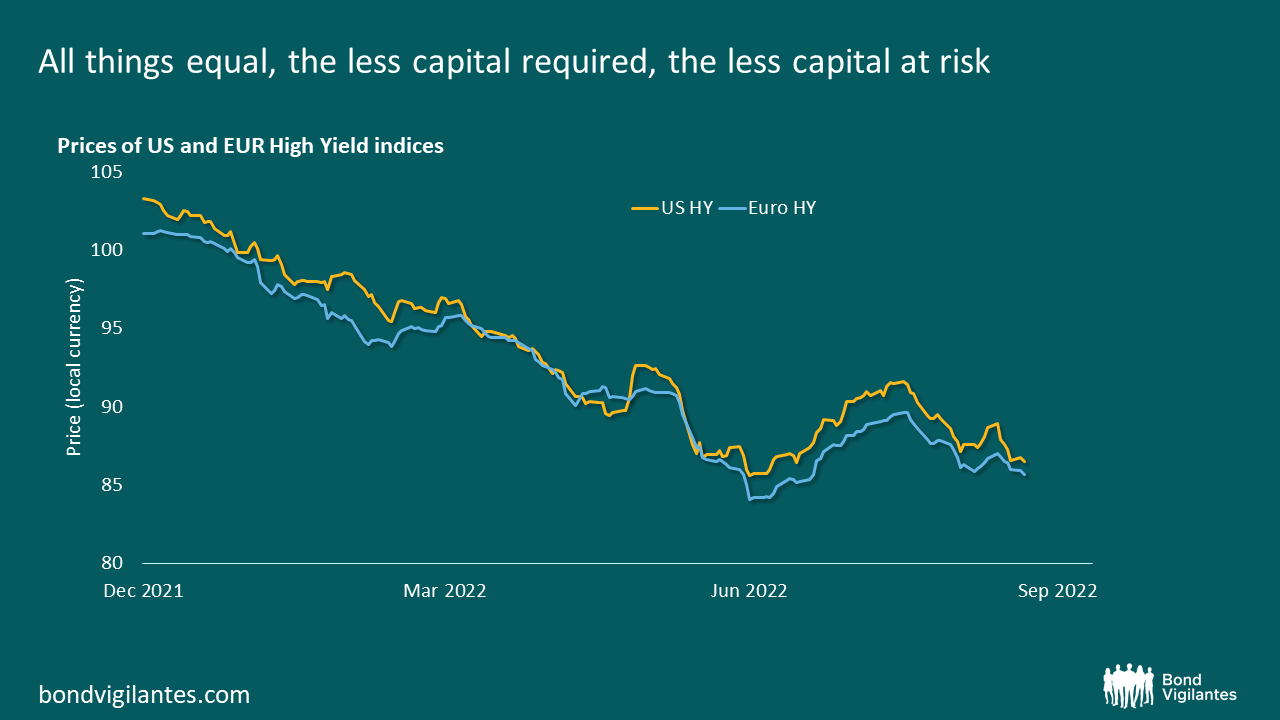
Third, the average price paid for a € HY and $ HY bonds is currently 86%. That compares to 101% and 103% at the start of the year. All things equal, the less capital required, the less capital at risk.
Fourth, and in stark contrast to the IG and leverage loan markets, the average credit quality of US HY universe has improved over time. Over the past five years, the BB–rated cohort has gone from 48% to 53%, whilst CCC risk has moved in the opposite direction. The picture isn’t as rosy for Euro HY.
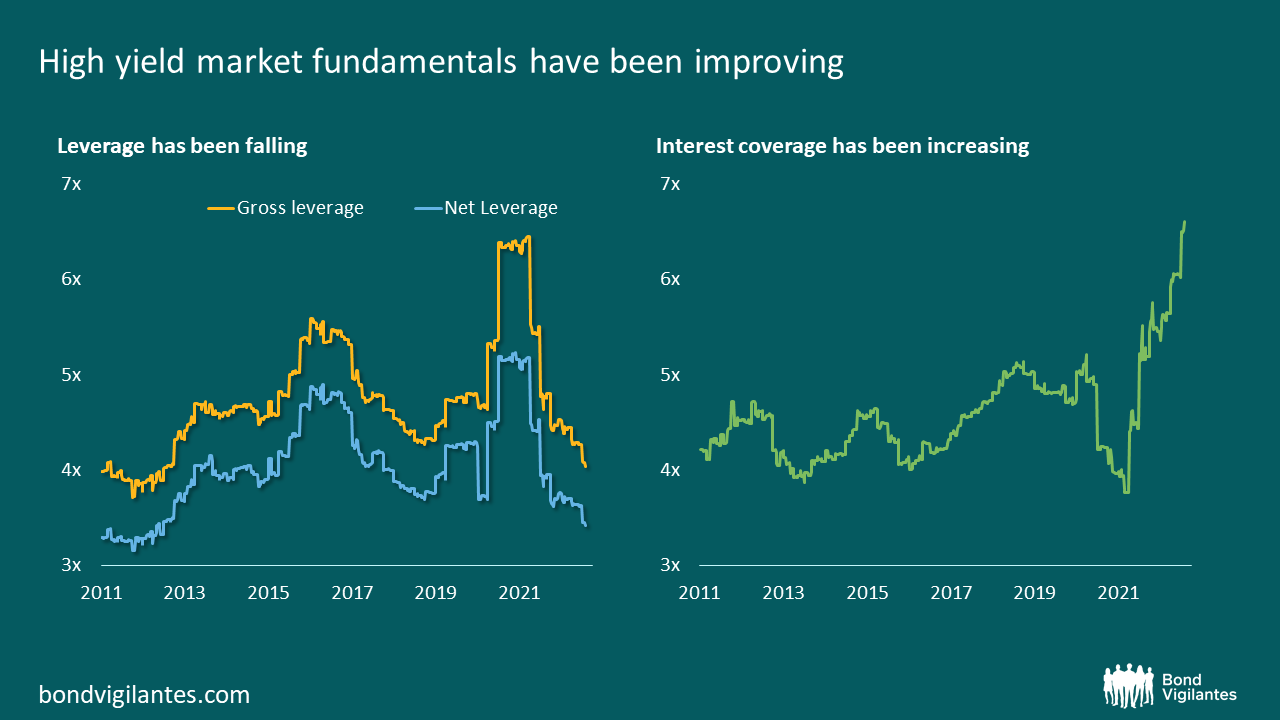
Finally, corporate fundamentals across the high yield markets currently stand in very good shape by almost any historical comparison, albeit there are signs these are beginning deteriorate.
As ever, the entry point, default rates and ultimately loss given default will be key in determining future returns for High Yield investors. We anticipate default rates will rise but ultimately peak below levels we have associated with past recessions. Risk premia may still have to rise given the challenges at a macro level but all is far from bad in the world of high yield.
2018 will be a year that most investors may want to forget – please watch M&G fund manager Stefan Isaacs review the year and discuss what 2019 might bring.
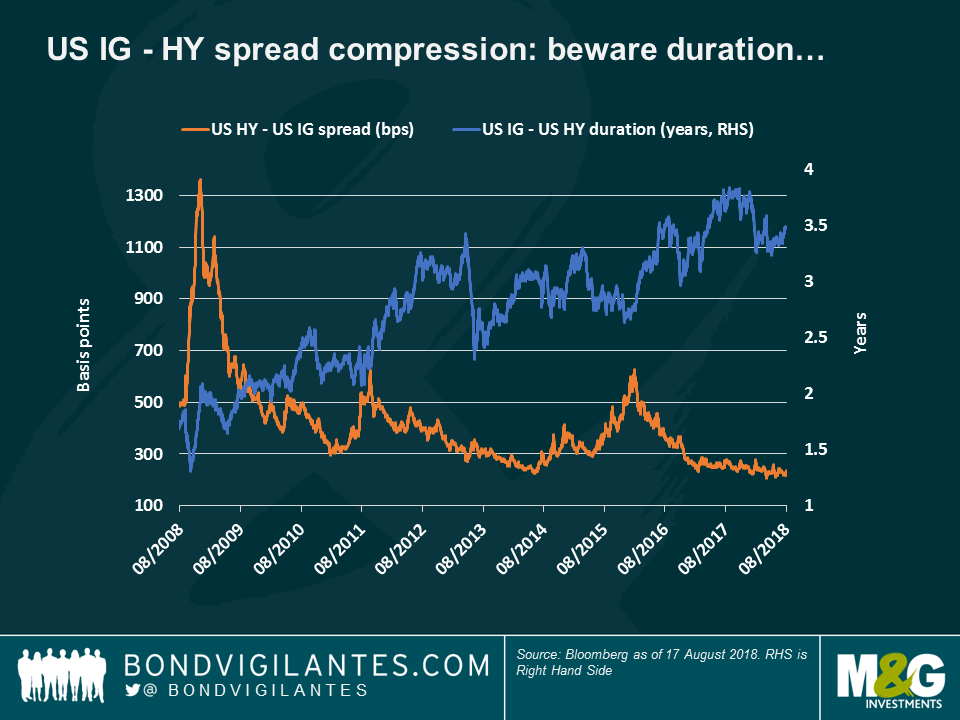
There is much talk about how tight US High Yield (HY) spreads are, especially relative to their Investment Grade (IG) peers. The difference between the two, of 241 basis points (bps), is less than half of what it was a decade ago – making some market observers quickly conclude that US HY looks expensive, so investors should favour IG bonds instead. But, is this the full story?
I believe there is more to it. As seen in the first chart, while it is a fact that the spread between the two asset classes has tightened over the past ten years (orange line), it is also true that such reduction also reflects a substantial change in the profile of both: relative to HY, IG interest rate risk has increased over the past decade (blue line), making IG bondholders more exposed in a rising rate environment – such as the one that the US is going through now. This has helped reduce the gap between the two.
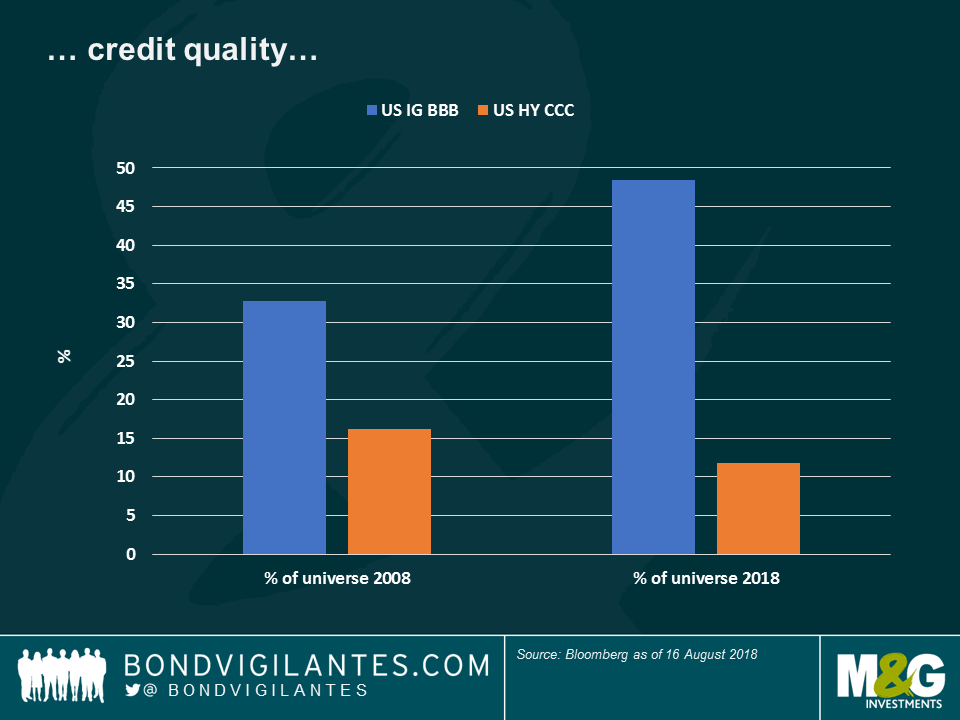
Significant changes in credit quality are also behind the HY-IG spread tightening: as seen in the chart below, the lowest IG credit rating, BBB, accounted for 33% of the asset class ten years ago, but now it has increased to 48%. Instead, CCC, the lowest HY rank, now represents 11.8% of the US HY universe, a drop from 16.2% in 2008.
Apart from having more interest rate and credit quality risk, IG investors are also facing challenging technical factors: as seen in the third chart, IG issuance has ballooned over the past decade as companies rushed to the market, attracted by ultra-low rates. At the same time, HY issuance remained steady or decreased as the asset class suffered certain setbacks, such as the collapse of oil prices in late 2014 (Energy accounts for about 15% of the US HY universe).

None of the above is meant to dispute the grab for yield that has occurred during a period of unprecedented monetary stimulus. But hopefully what we have shown is that a straightforward comparison of IG and HY spreads over the last decade is overly simplistic. As ever the devil is in the detail. HY spreads are relatively tighter to IG at least in part because the asset class’ credit quality has improved, interest rate risk has remained somewhat unchanged and technical factors have not created significant headwinds.
Back in 2017, the economic outlook was increasingly rosy for the Eurozone. After years of ultra-loose monetary policy, a synchronised global recovery was in train. The Eurozone economy expanded apace, regularly surprising to the upside, unemployment continued to fall, the banking system had partially recapitalised and funding costs for corporates and sovereigns alike remained low on any measure. Even the inflation picture was showing some signs of a recovery towards the ECB’s definition of price stability. Behind the scenes, the ECB must have been increasingly confident that they had turned a corner and would begin unwinding their emergency monetary policy stance.
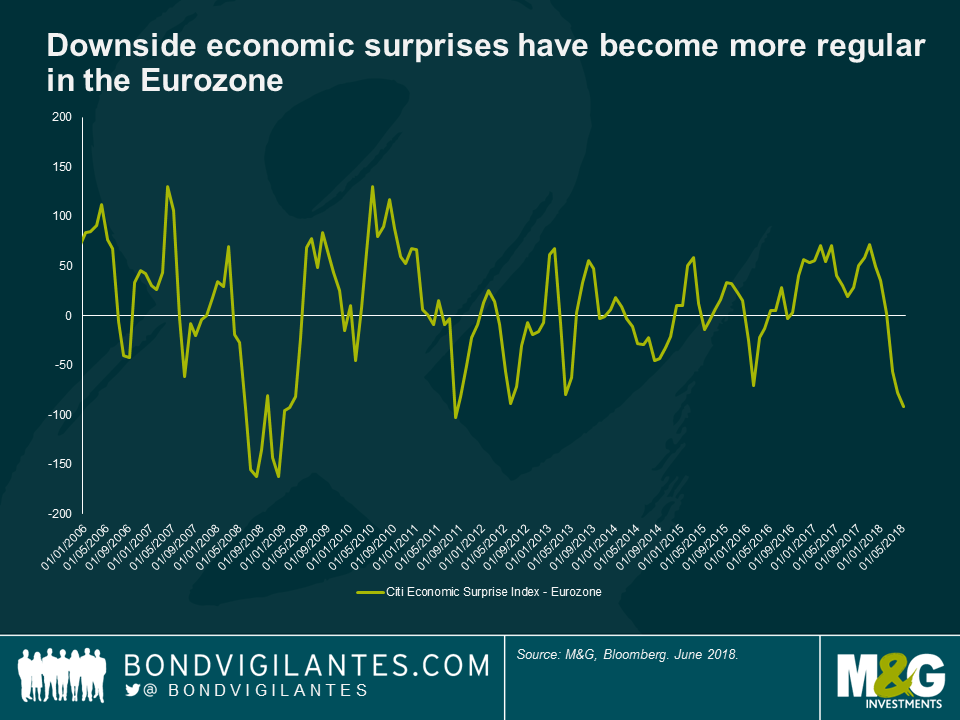
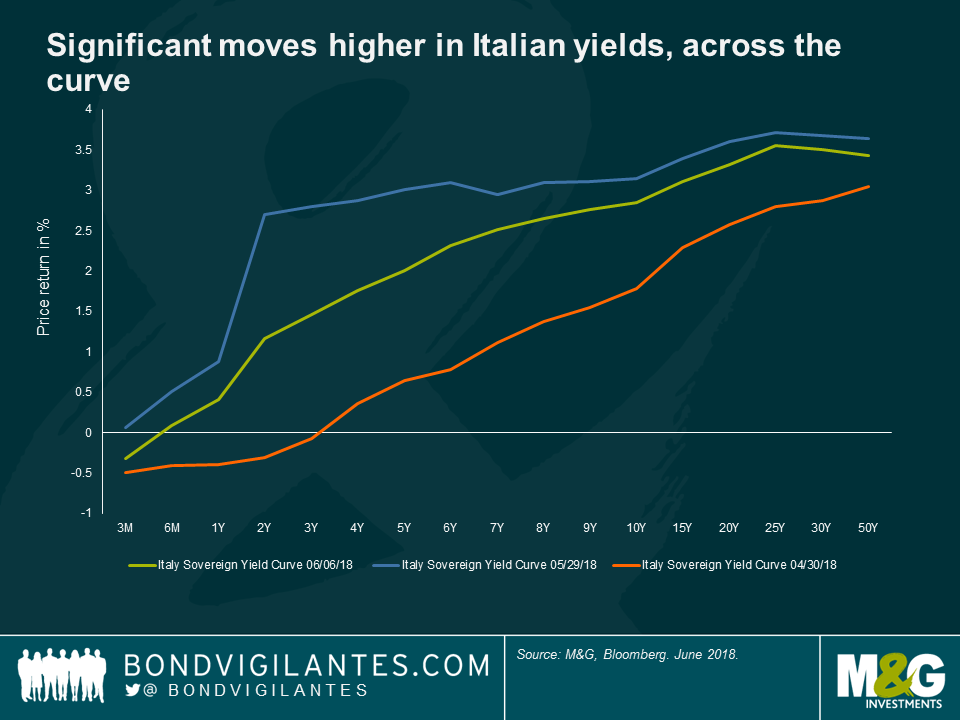
Less than a year later and their plans for normalisation have become more complicated. The economic data has weakened. And recent events in Italy have served to remind of the dangers of discounting populist politics. Whilst Italy is not leaving the Euro any time soon, the notable absence of credit risk priced into Italian assets a mere month ago was foolhardy. At the end of April 2018, ten-year Italian BTPs offered a yield below 2%, and all maturities below 3 years yielded less than 0%. A month later and BTPs yields have climbed dramatically.
The ECB will take comfort from the limited contagion to other peripheral markets thus far. Structural reforms, a stronger economy and better response mechanisms go a long way to explaining this. But dialling back stimulus in the face of increased market volatility and a tightening of financial conditions in Italy will leave the doves on the ECB Council uneasy.
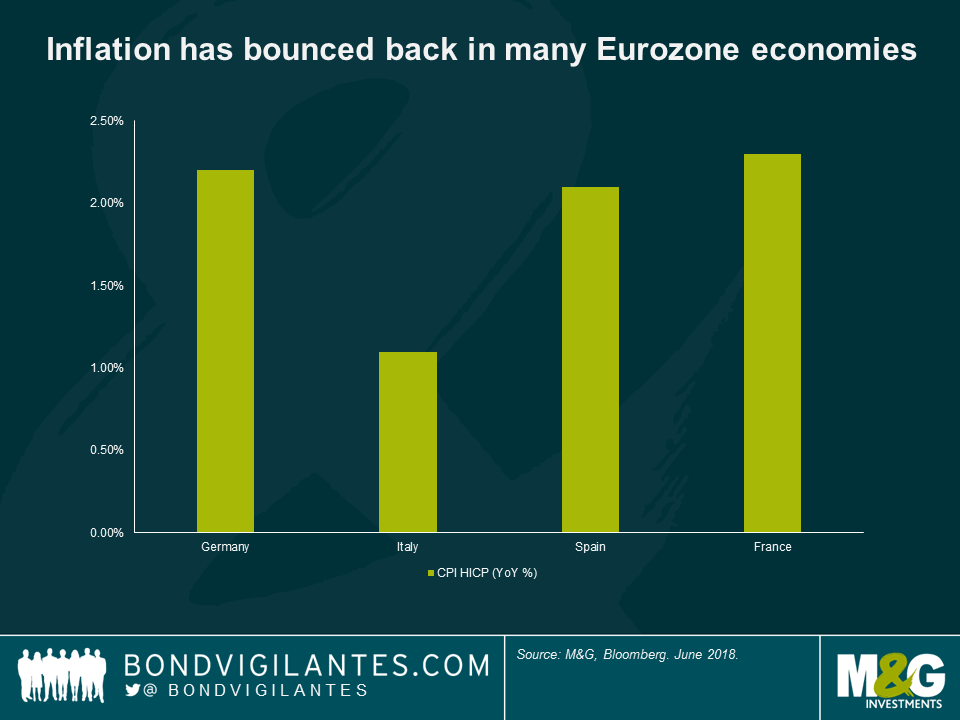
Jens Weidmann, Deutsche Bundesbank President, and other notable hawks will take a different view. They will point to recent German CPI prints of 2.2% and firming labour markets across the Eurozone. Savers continue to be forced to take either considerable term or credit risk to earn a positive real yield and there are some preliminary signs of excesses and imbalances building. Weak or practically non-existent covenant protection have become the norm in many high yield and leverage loan transactions. These concerns are not without merit.
Yet despite these risks, there is danger in tightening policy too early. Arnaud Marés at Citigroup, a former special advisor to Mario Draghi, argues that a central bank requires 300-400 basis points of rate cuts to be confident they can suitably stimulate an economy in the face of a significant economic slowdown. The chances of the ECB getting anywhere close to this watermark before the end of this current cycle are practically zero. Given the lack of fiscal firepower available to Eurozone governments, the ECB finds itself in an unenviable position. The onus remains on easy monetary policy to support economic growth in the Eurozone and the Central Bank is best served by erring on the side of caution. Put another way: they should wait until the they can see the whites of the eyes of inflation before normalising policy. Any tightening should be a gradual affair.
Mario Draghi’s term as ECB President expires in November 2019. He will want to be remembered for playing his part in pulling the Eurozone back from the abyss in 2012. He certainly will not want to be the ECB President who helped cause the very slow down his successor will face, with a largely empty box of tricks.
Today marks five years on from Mario Draghi’s now famous ‘whatever it takes’ remarks, widely credited with sparking a reversal in the Eurozone’s fortunes.
Below are five charts offering some insights into the European Central Bank’s successes and failures in the ensuing period, as well as some of the challenges that remain.
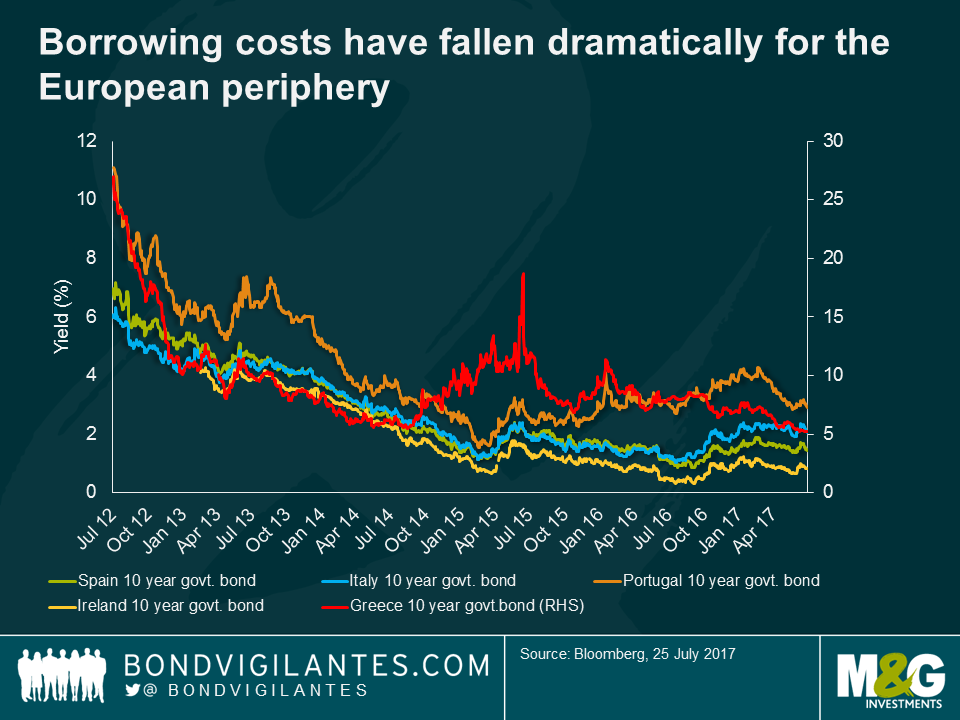
Five years ago, funding costs for the periphery had climbed to unsustainable levels. Spanish ten year debt traded at 7.5%, Italy at 7%, Portugal at 11% and Greece a whopping 27%. In part this reflected the redenomination risk into local currency. Finally acting as the lender of last resort, the ECB significantly decreased this risk, reopened market access for the likes of Spain and Italy and with it lowered their implied cost of funding. Over time (some) structural reforms, further monetary easing and improved growth has seen funding costs fall towards, and in some cases below current growth rates, offering a real prospect of debt sustainability for these economies. Greece’s return to market completes an astonishing recovery in fortunes.
Ultra-loose monetary policy penalised saving, reduced debt servicing costs and encouraged investors to take on risks. This has served as a backdrop for improved consumer sentiment, higher asset prices and a pick-up in consumption. The Eurozone has surprised recently as the global outperformer growing well above potential. Yesterday’s record print for the German IFO suggests growth may be tracking around 3% in H2 2017.

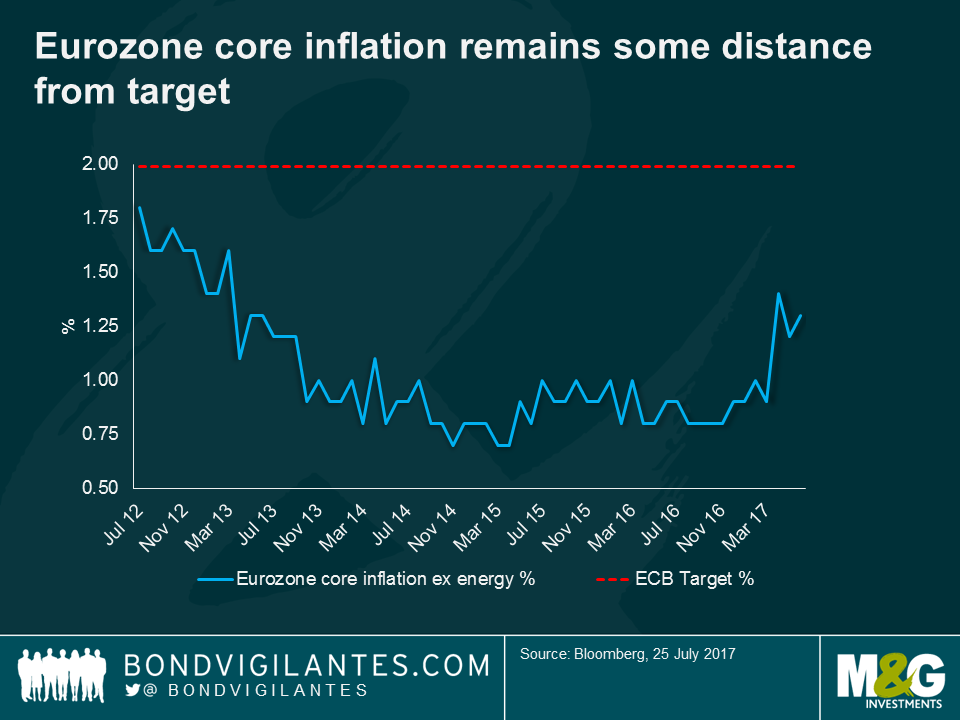
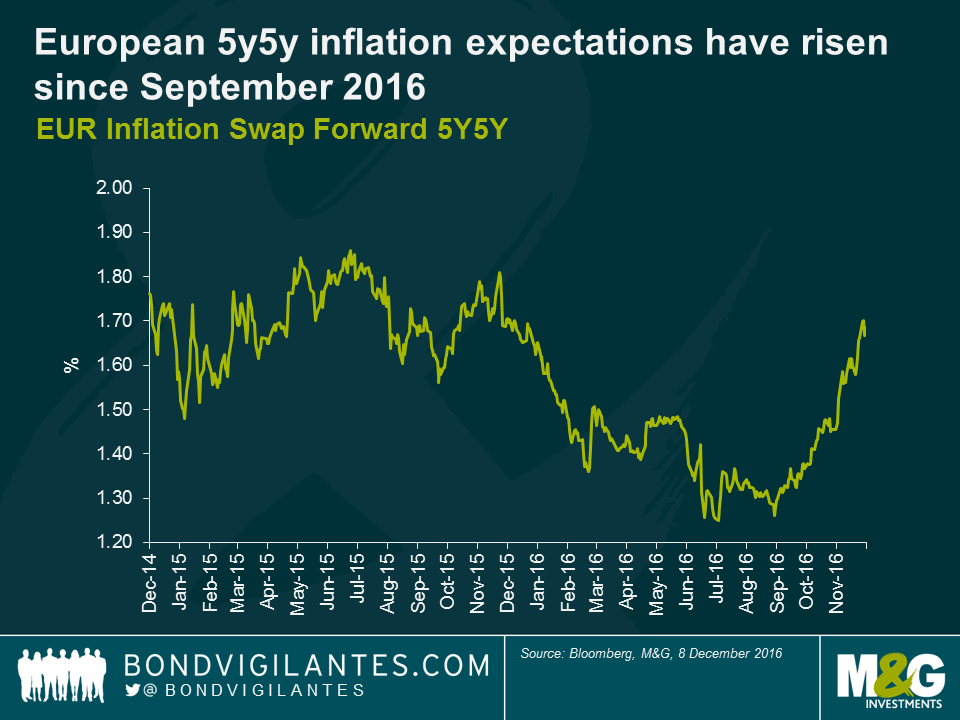
Despite the stabilisation seen in the Eurozone, lower borrowing costs and a generally improved economic outlook, the ECB continues to miss its inflation target. This has proven problematic given the ECB’s sole target is to deliver inflation of close to but below 2%. Whilst there are signs that inflation is trending back towards the Bank’s definition of price stability it has been very slow in the making. Any tightening of policy will likely be a protracted affair.
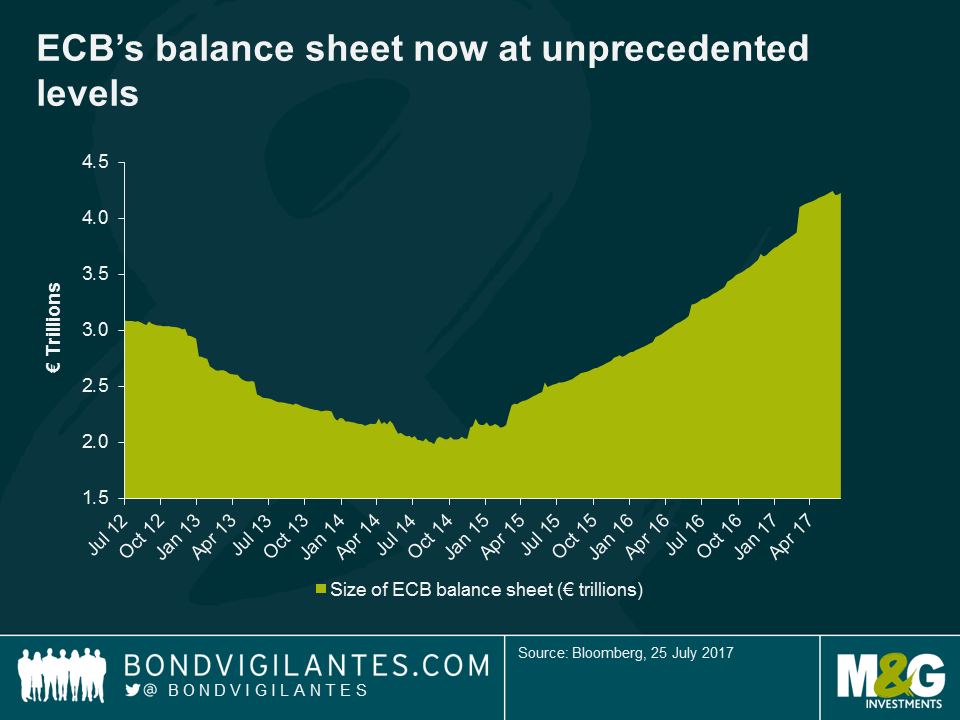
Having taken the refi-rate below the ‘zero-bound’ in 2014 the ECB still found itself facing the risk of a self-reinforcing deflationary spiral. Ultimately the Bank followed other central banks announcing in Jan 2015 that it would inject €1.1 trillion via bond purchases through to September 2016. The problem? Despite the significant expansion of its balance sheet the ECB was forced to extend its quantitative easing programme both in terms of length and to include corporate bonds. It now sits above a whopping €4 trillion. Draghi has since gone to lengths to stress that any tightening of monetary policy will be done in a gradual fashion. But there are clearly some on the Governing Council who worry about the negative consequences of an ever expanding balance sheet, the implications for the banking system, the Eurozone’s ‘addiction’ to debt and consequently the ECB’s ability to exit its ultra-loose stance.
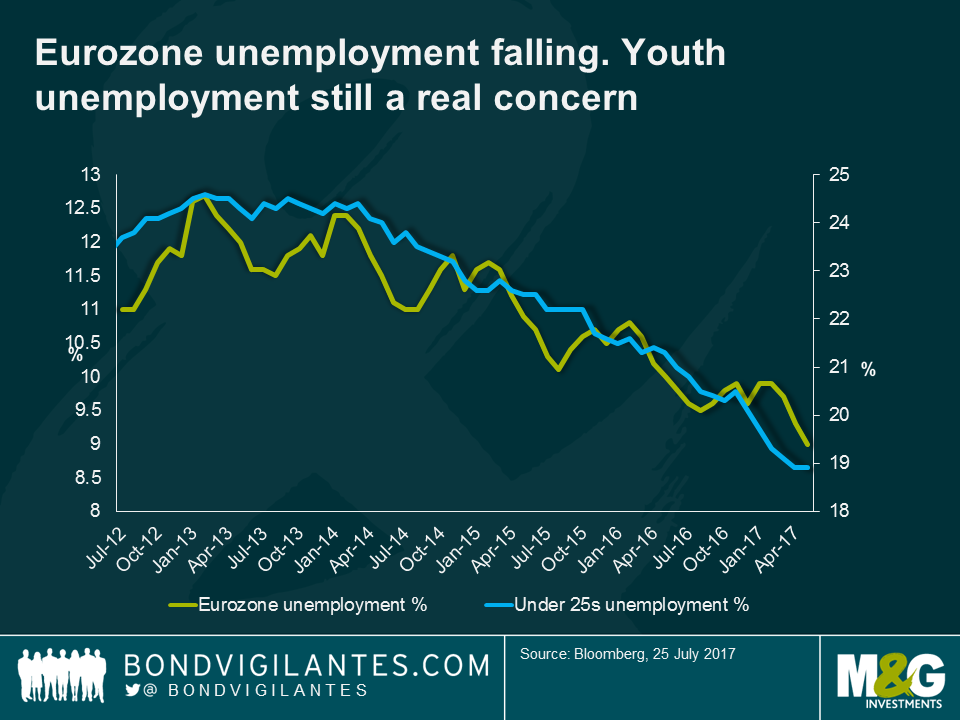
Whilst populism appeared to be sweeping across the developed world, the outcomes in the Dutch and French elections suggest that the Eurozone may have taken a different approach. However Italy’s lagging economic performance and a general election in 2018 offer the potential for an upset. Although levels of unemployment in the Eurozone have come down somewhat they remain elevated, especially amongst the younger cohorts.
Doomsday predictions claiming the beginning of the end for the Eurozone were two a penny back in 2012. Investors and economists queued up to argue that the single currency would not hold. Either peripheral countries would be forced out or the core would walk away so went the argument. Despite all the speculation, no country has left the Eurozone and markets currently appear much less concerned. This is perhaps the single most important measure upon which to judge the effectiveness of ECB policy over the past five years.
The votes are in and it’s pretty unanimous. Despite Mario Draghi’s best efforts to persuade otherwise, the market is clear that today’s announcements are tantamount to tapering. Frankly anything less than an extension of Euro 80bn per month, irrespective of the duration, was likely to have been taken as such, with scant evidence of the inflation target being achieved during the forecast horizon. Mario will have been well aware, but with market measures of inflation now discounting deflation risks the ECB hawks were always going to feel somewhat emboldened.
The reality, which we have observed before (see previous blogs), is that monetary policy has very likely reached its limits. For all the rhetoric that central banks will espouse to the contrary, the reality is that we have reached a tipping point. For each additional measure of monetary stimulus there is an equal or greater cost to be borne elsewhere in the economy- banks, insurers and savers the obvious losers.
The Eurozone may see some marginal benefit from fading fiscal headwinds in 2017 but these are unlikely to significantly move the needle. And the much hoped for structural reforms in Europe remain exactly that. This is Europe and red tape abounds.
The contrast with the US and the Federal Reserve is stark. Next week the Fed will surely hike rates. It should also find itself in a position to do so further in 2017, providing it with at least some ammunition should this seven year expansion be in its latter throws. With a US economy operating at full employment and likely to receive significant stimulus in the form of tax cuts and spending, the risk here has to be an overshoot in inflation with a central bank forced to pull hard on the handbrake.
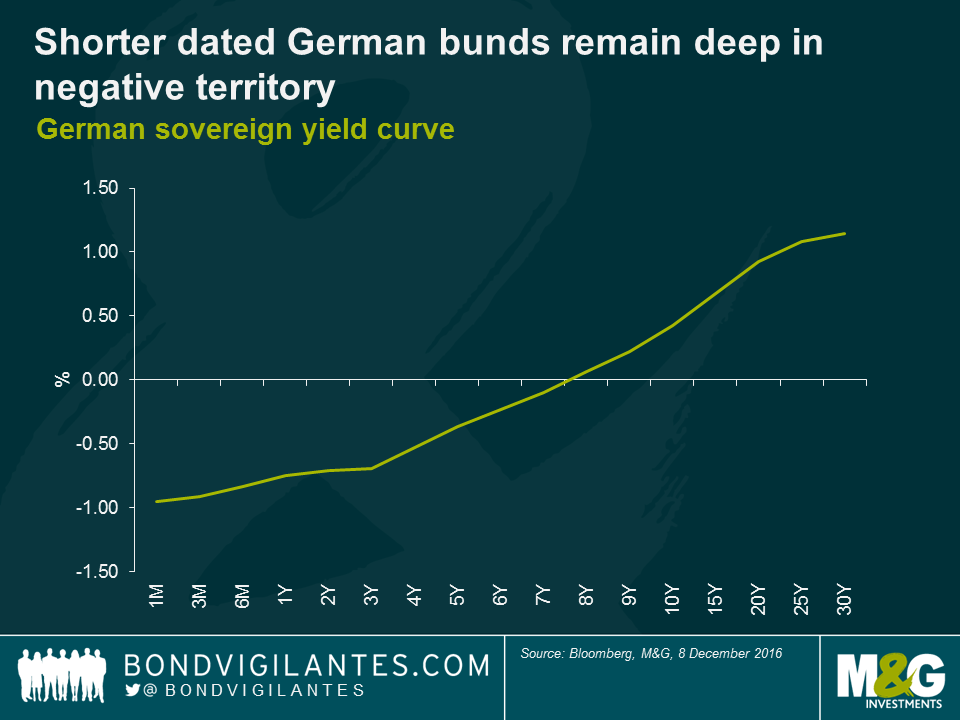
For the Eurozone, the most likely outcome for the economy is further muddle through, a very gradual closing of the output gap and no real prospect of hitting the near 2% inflation target until the end of the decade. Significant accommodation will be needed for years to come which is exactly what the shape of the German yield curve is telling us. The room to ease monetary policy in Europe if we were to run into a global slowdown in 2017/2018 is almost non-existent.
The irony for the ECB is that had it found the conviction to stimulate earlier and more convincingly it likely would have stood a greater chance of achieving its inflation and financial stability goals and, much like the Fed, would be well on its way to planning its exit today.
The votes are in and it is clear. For the second time in 2016 we have had a major rejection of the political status quo. Following on from the shock UK referendum result, a Trump victory is further evidence that many believe that we have reached peak globalisation and income inequality. The perceived losers of globalisation have turned the incumbent political system on its head, and with it we should expect change.
So here are five predictions:
In order to assess value in credit markets, bond investors usually make some assumption about the future path of corporate default rates. This assumption generally stems from macroeconomic forecasts (strong/weak growth = low/high defaults rates) or sector specific events (like oil price movements). Following this, it is possible to get an indication of whether investors are being over- or undercompensated for investing in corporate bonds by assessing the level of credit spreads.
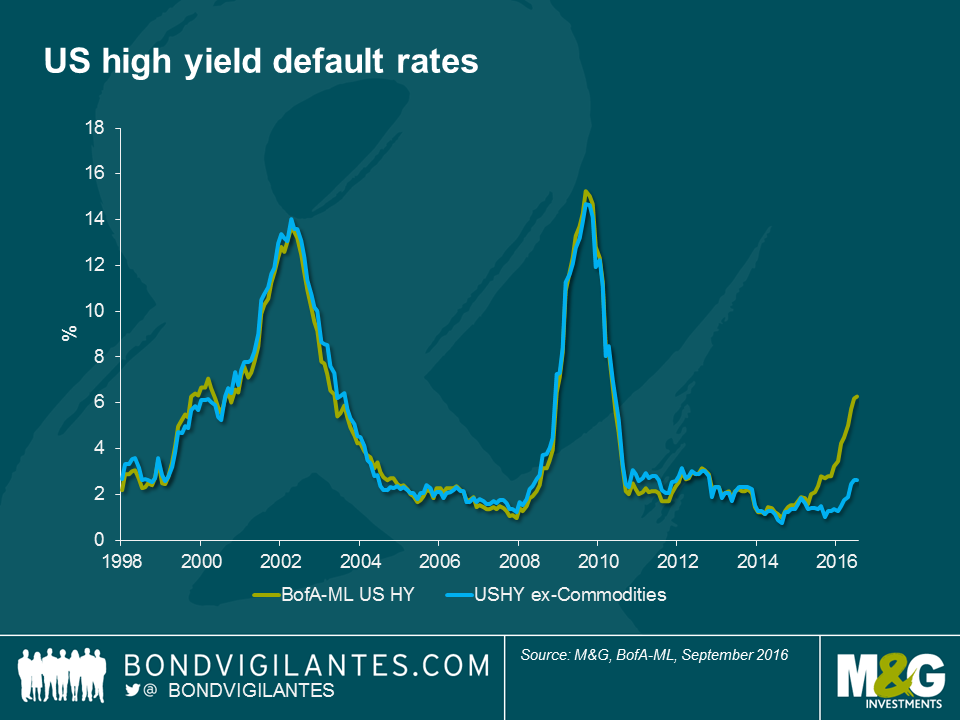
If this seems like a simplistic approach, it is. Default rates don’t give the full picture. It is important to add more information to the valuation assessment; specifically, in the event of a default how much money will investors get back? This is an increasingly important piece of information in a world where low interest rates and unconventional monetary policy has helped push high yield corporate bond prices back towards all-time high levels despite late cycle risks. Sometimes, it might be worth buying a default candidate if the level of recovery compensates for the cost of entry and the headache involved.
Over the past year and a half, US high yield recovery rates have plunged from 61% in December 2014 to a record low of only 23%. Because of the fall in recovery rates, the difference between the US high yield market price and recovery rates is at an all-time wide level. Those US high yield investors that own a bond when it defaults are now losing more money on average than ever before.
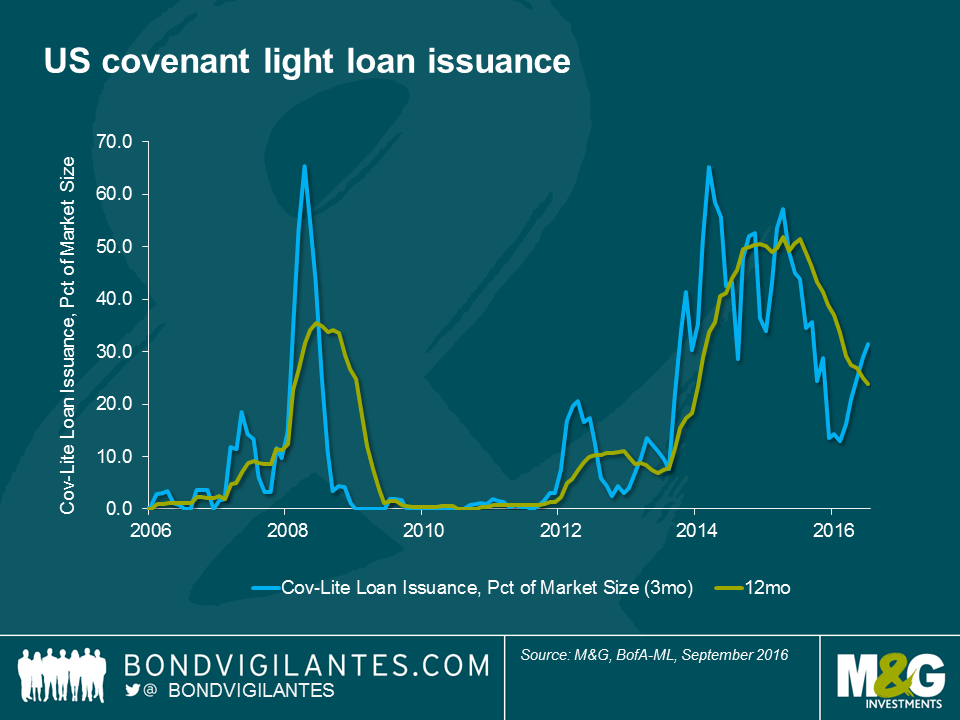
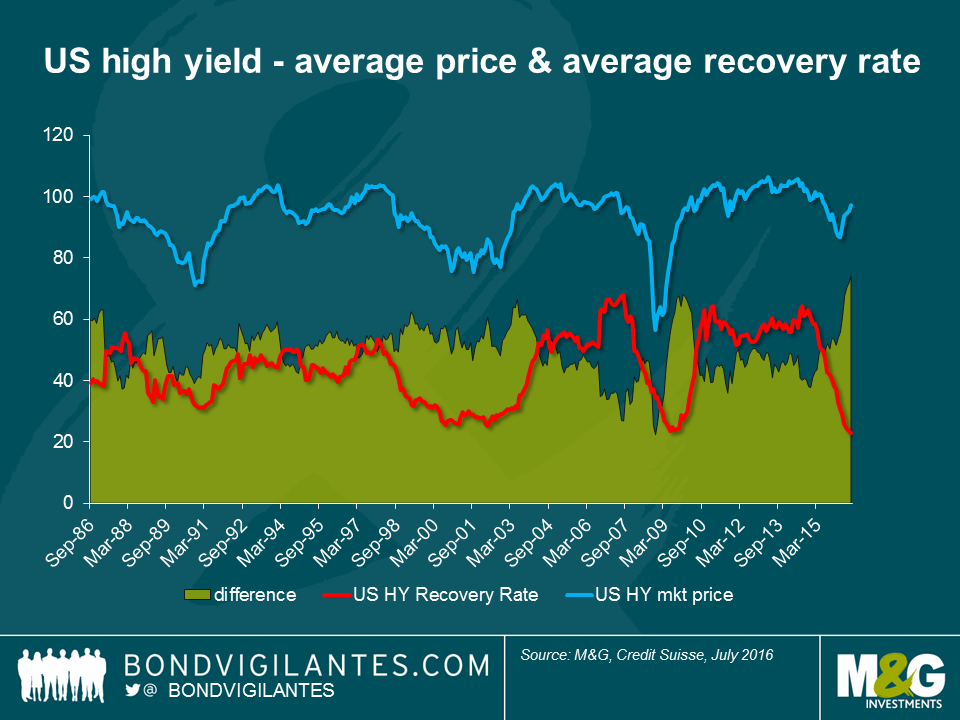 We think that there are a couple of reasons for the fall in recovery rates. Firstly, markets tend to leave investors as price takers for fear of missing the returns that other market participants are enjoying. In their quest to ‘stay invested’, bond holders will typically forgo covenant protections that will impact ultimate recoveries. One of the proxies that we pay attention to, given the close correlation to issuance standards in the high yield market, is the share of covenant lite issuance in the leverage loan market. The period of 2012 to 2015 saw a massive increase in covenant light loan issuance. This means that lenders have much weaker protection in the form of incurrence covenants rather than maintenance tests. The US high yield energy market is a case in point. Underpinned by $100 oil price, high yield investors paid far too little attention to bond documentation, leaving significant room for creditors to be “primed” (the act of granting a new lender higher claims priority over an existing creditor).
Secondly, an intended consequence of quantitative easing policies is the portfolio rebalancing effect, where investors increasingly turn to riskier assets in order to generate positive returns. One of the unintended consequences of this is the resulting misallocation of capital. Companies operating in an economic regime of quantitative easing take much longer to fail, as evidenced by the very low default rate of the last decade (with exception of the 2008 financial crisis period). In this environment, companies are incentivised to issue debt at unusually low yields, and are encouraged to allow cash to leak from the business in the form of distributions to shareholders and coupon payments to creditors. When the unfortunate time comes to wind up the business, creditors find that there is less cash to go around and more indebtedness, resulting in the low recovery rates we see today.
With recovery rates falling and default rates likely to rise from current low levels, those looking to get access high yield markets are going to have to “mind the gap” that has opened up between recovery and default rates. In an environment devoid of yield the attraction to chase income is only too understandable. Yet the risks are increasingly apparent and investors in high yield should consider their downside as well as the potential upside.
I attended a conference last week where European Central Bank (ECB) bashing was approaching fever pitch. The crux of the argument goes a little something like this:
“The ECB have lost the plot. Monetary policy has become impotent. The ECB is at the lower bound and the law of diminishing returns results only in an ever greater misallocation of resources, punishing savers and rewarding speculation, whilst losing credibility with markets and the wider public. Furthermore the ECB’s willingness to placate markets only serves to relieve pressure on much needed structural reforms.”
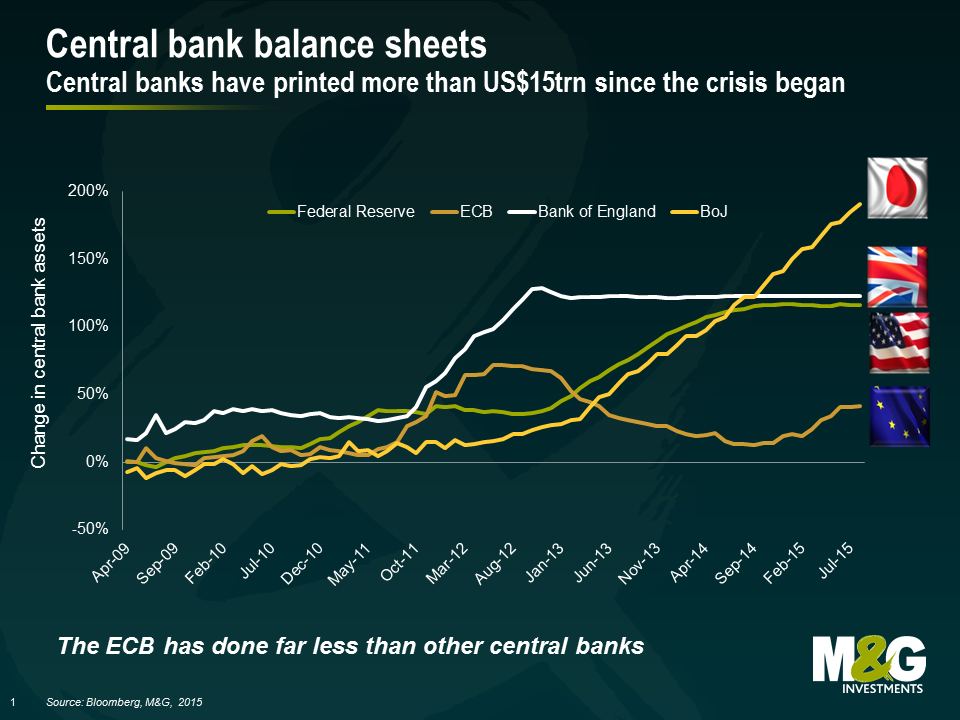
In my opinion, there could be some truth to the diminishing returns argument. It appears that each subsequent Federal Open Market Committee (FOMC) quantitative easing programme had a lesser impact than the previous on long bond yields, a key barometer of QE programmes. But the market has had to concede that the lower bound for monetary policy is not zero – 2 year yields in Germany, France, Italy, Spain, Sweden, Netherlands, Switzerland and Japan all sit well below. And the ECB has shown it has further room to expand its balance sheet by further scaling up its non-conventional measures. Let’s not forget that the ECB has still done considerably less than US Federal Reserve, the Bank of Japan, and the Bank of England. This might help explain why the Eurozone recovery has lagged that of the other major economies.
I believe the ECB should have done more monetary stimulus in order to support the Eurozone economy and done it sooner in order to meet its sole objective of achieving price stability. The ECB hoped that economically uncompetitive States within the Eurozone would pursue difficult structural reforms in order to become more competitive in the international marketplace. This hope has been misplaced. Whilst the heavily indebted nations of the Eurozone had taken some action, it is now clear that high unemployment rates, growing public and private sector indebtedness, and a fall in household consumption is what the ECB should have feared most. The irony is, it had all the monetary tools to assist the ailing Eurozone economy sooner. To those of us that don’t sit on the ECB’s Governing Council, it appears that the ECB has consistently and intentionally run tight monetary policy in order to avoid moral hazard in financial markets. This has come at the cost of supporting the real economy and failing in achieving its primary task – an inflation rate of below, but close to, 2%.
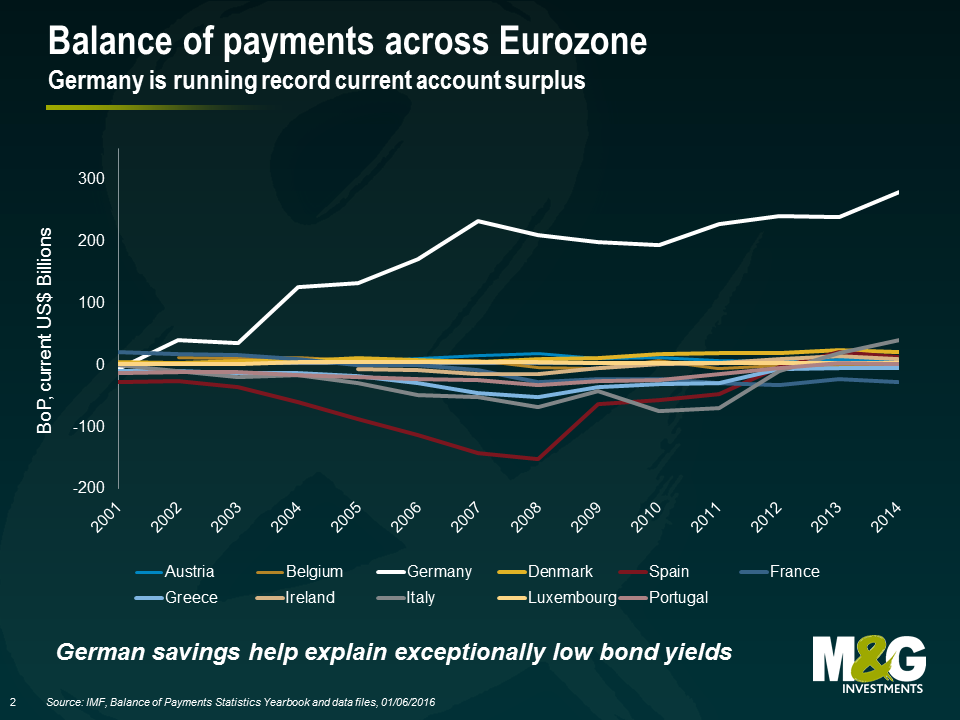
Of course, the ECB was dealt a bad hand to begin with. A currency union of diverse economies, absent fiscal union, is a fragile union at best. At the heart of the Eurozone’s fragility is Germany’s often overlooked and consistently growing current account surplus. Germany’s current account surplus is almost 9% of GDP. This is in violation of the European Commission’s Macroeconomic Imbalance Procedure, which limits surpluses to +6% of GDP. Martin Wolf from the Financial Times has labelled Germany as ‘the Eurozone’s biggest problem.’ Germany has the capacity to now borrow at negative or close to zero yields, yet the public investment in Germany is the second lowest in the OECD (1.5% of GDP), while net public investment has been negative since 2003. As we have pointed out previously, Europe needs a German fiscal stimulus package but won’t get it.
As the Eurozone’s largest economy and creditor Germany has been a major proponent of the Eurozone running a budget surplus. In order to acquire funds to service high debt levels, countries like Greece, Portugal, Spain and Ireland have had to attempt to move their fiscal balances from deep deficits to surplus positions. In order to achieve this, governments have had to implement harsh austerity measures, encouraging saving rather than investment. Consequently whilst Germany enjoys low unemployment rates, rising wages, higher house prices and a cheap currency; the Southern European economies have been mired in economic stagnation, recession and depression.
Addressing these fundamental fragilities is at the heart of the issue for the Eurozone. Ultimately this will require either large fiscal transfers from north to south, significantly higher inflation in Germany or many years of mass unemployment in Europe’s weaker economies.
Nearly ten years from the start of the financial crisis in 2008 it doesn’t feel like we are any closer to a real solution. Until politicians are willing, or more likely forced, to take some very difficult decisions the ECB will have to continue to shoulder the load and act as the de facto fiscal agent for the Eurozone. The criticism of its actions will continue.


Sign up to the Bond Vigilantes mailing list to ensure you never miss a great article from our expert Bloggers. We will email all new articles to your inbox, meaning you can stay on top of the world of Bonds.
I confirm that I would like to receive information about Bond Vigilantes and products and services from M&G Securities Limited.
We will use the email address and personal data you have shared with us to send you this information. For existing customers, submitting your contact details and requesting to receive this information from us, will replace any earlier choices you have made in respect of marketing information.
You can unsubscribe from marketing at any time, at which point we will not send any further marketing information to you, by selecting the unsubscribe link in all communications.