Debt Matters: Why It’s Time to Position Into Countries with Low Outstanding Debt Debt Matters: Why It’s Time to Position Into Countries with Low Outstanding Debt
By Robert Burrows
18 April 2024
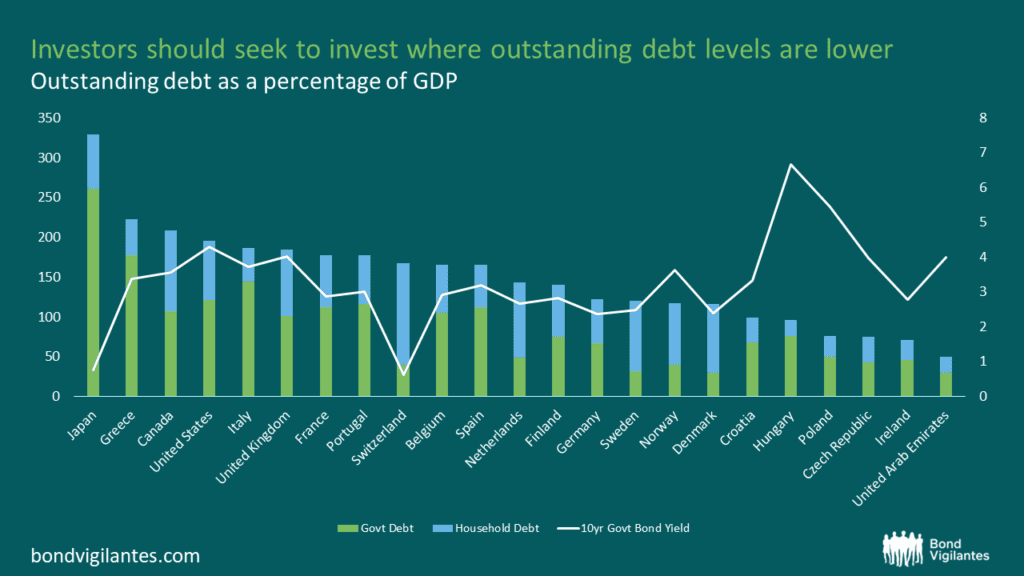
In an era of economic uncertainty and volatility, the importance of managing national debt has never been more evident. Investors seek stability and long-term growth opportunities, so the spotlight turns towards countries with low outstanding debt.
18 April 2024