Not all oil-exporting countries are the cracking winners you think. Not all oil-exporting countries are the cracking winners you think.
By Charles de Quinsonas
4 June 2026
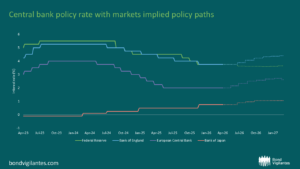
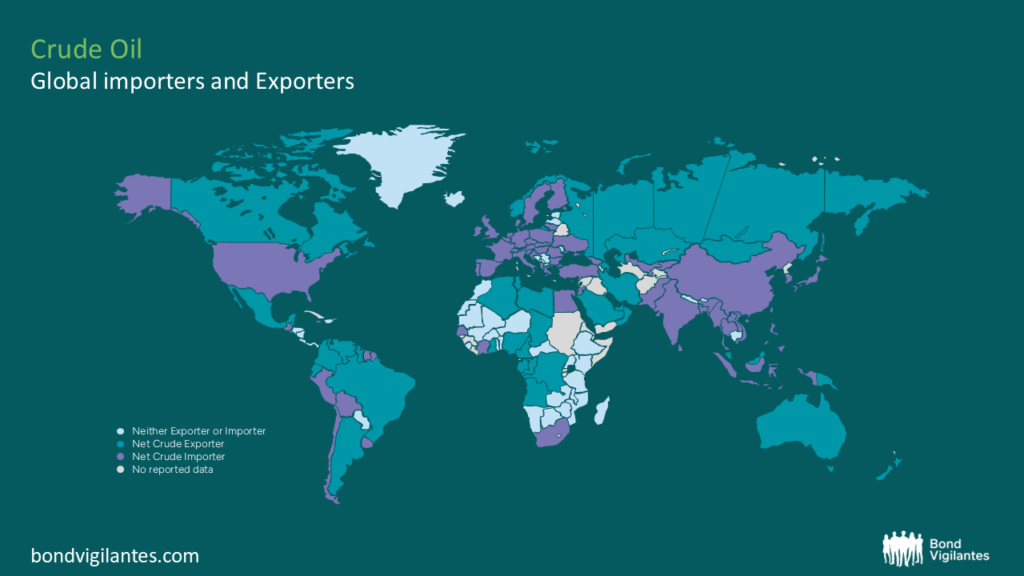
With headline-dependent oil price hovering at +/-10% around $100 per barrel, the rates market has been rapidly repricing as bond investors continue to analyse the impact of oil on inflation, monetary policy, and trade balances across developed and emerging economies. The World Bank provides a very useful chart (below) for identifying which countries are net crude oil exporters or importers (or neither). At a high level, it is not hard to form the view that Asia and Europe are the regions most affected by a...
4 June 2026