
Stamping down on foreign flows into UK property could be sterling suicide
So now we know what the Bank of England intends to do about the UK’s housing market, a market that Governor Carney has previously referred to as the biggest risk to financial stability and therefore to the economic expansion (the IMF and the EC had similar warnings).The answer, in short, is not much at the moment – while Carney is not “happy” with the buoyant UK housing market, he is willing to “tolerate” it.
Before wondering what to do – and what not to do – about the housing market, it’s worth asking whether the UK housing market is in a bubble. It’s not as crazy a question as you might think – in real terms (i.e. adjusting for inflation), UK house prices rose by just +1.2% per annum from 1974 to the end of 2013, and by 2.2% per annum from 1974 to the end of 2007. It was the early noughties when things got crazy, as UK real house prices saw double digit returns in four consecutive years from 2001-2004 – strip out these years, and UK real house price growth has actually been negative in the last four decades*. But even including 2001-04, if you consider that the UK’s productivity growth since the mid 1970s has averaged about 1% per annum, and that UK population growth has averaged 0.3% per annum over this period, then small positive real house price growth doesn’t appear hugely alarming.
That said, 40 year average price changes don’t tell the whole story. The performance of the housing market in the past year is remarkable – UK house prices were up 11.1% in nominal terms in the year to May according to Nationwide, which is still a long way short of the 2001-04 bubble years, but is the fastest pace since then. Meanwhile data from the ONS shows that nominal London house prices rocketed 18.7% in the year to April. These rates of growth are well in excess of inflation, and well in excess of wage growth.
What is causing the recent jump higher in house prices? By definition the answer is an excess demand versus a lack of supply, although almost all commentary on the UK housing market seems to focus primarily on the latter rather than the former. Public debate about UK housing has been strongly influenced by then MPC member Kate Barker’s government commissioned 2004 review of housing supply, where she argued that ‘the long-term upward trend in house prices and recent problems of affordability are the clearest manifestations of a housing shortage in the UK’, and that the UK needed to build up to 260,000 new homes per year to meet demand. In the decade since the report was published, less than half this figure has been built, suggesting a shortfall of 1 million houses has accumulated.
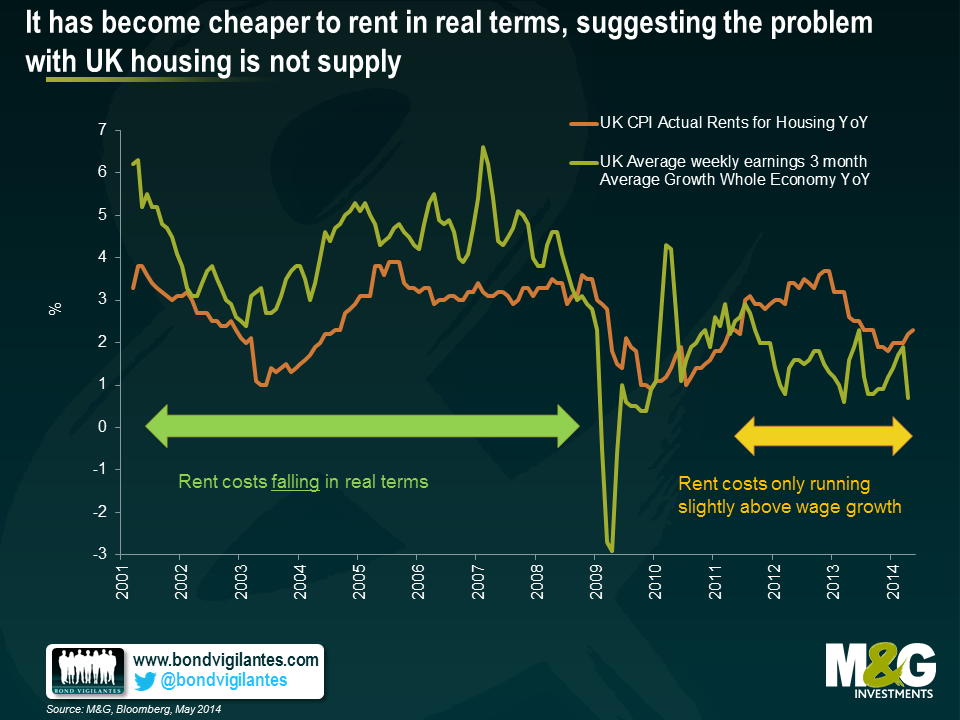
But is the spike in house prices really all down to supply? As Fathom Consulting have pointed out, if there was a housing shortage then why haven’t real rent costs jumped higher? The chart below plots nominal wage growth versus UK rent costs back to 2001 – rent costs were actually increasing at a slower pace than wages pre-2008, and have only been running fractionally above wage growth more recently. If there was a supply shortage, then we would expect to see real rent costs increasing quite sharply as people become forced to spend more on housing as a percentage of their income, but this isn’t the case.
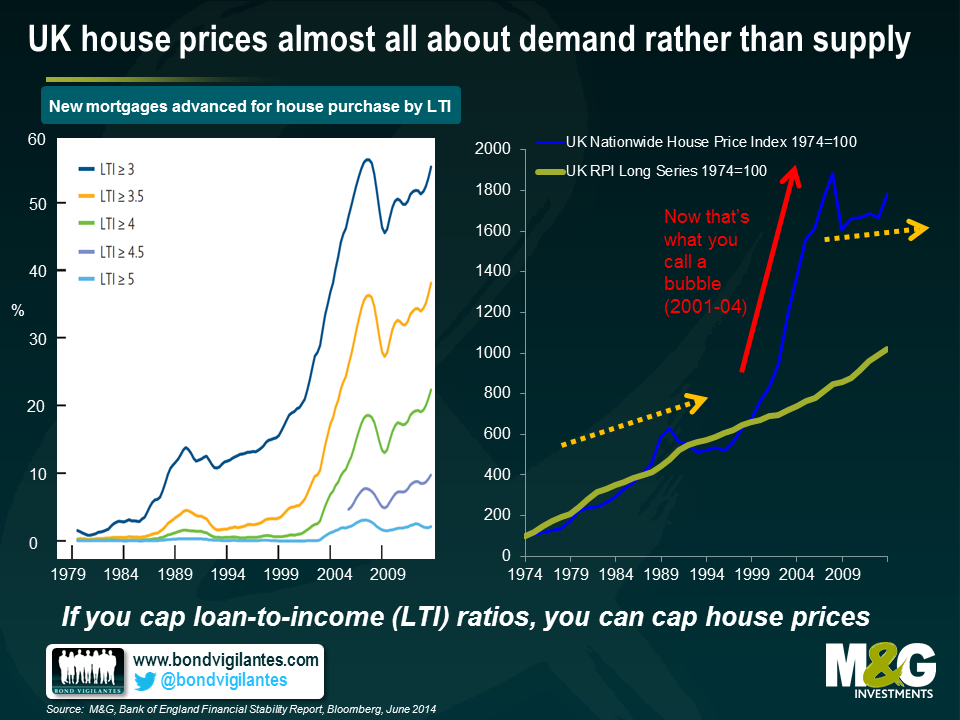
The next chart suggests that the pick-up in house prices that began last year is much more likely (as always) to have had more to do with demand, namely lower mortgage rates and easy mortgage availability. The left hand chart is from the Bank of England’s recent Financial Stability Report, and shows the loan to income ratio on new mortgages advanced for house purchase. Around 10% of new mortgagees are now borrowing at a loan to income ratio at or in excess of 4.5 times income. Over half of home buyers are now having to borrow at 3+ times income, which is a ratio about 5 times higher than immediately before the UK housing market crash of the early 1990s. It’s striking how closely correlated loan to income ratios (left chart) are with house prices (right chart). It suggests that limiting loan to income ratios will also serve to limit house price appreciation, although the correlation doesn’t necessarily imply causation. It could be that a jump higher in house prices forces buyers to take on more debt, since only additional debt will make it possible to get onto the bottom rung of the housing ladder**.
The other growing source of demand for UK property is likely to be overseas investors. When sterling collapsed post the 2008 crisis, the assumption was that the UK would see an export-led recovery thanks to a huge improvement in its competitive position. Unfortunately, this didn’t really happen, because the UK’s big export – financial services – was in little demand post crisis. UK exports did initially pick up, but today are only 10% higher than at their peak in 2008, and have moved sideways since 2011. Spain’s exports, in contrast, are almost 30% above 2008 levels in euro terms, despite the euro strengthening against sterling over the period.
Sterling depreciation may not have resulted in a surge in exports of UK goods and services, but it does appear to have led to a pick-up in a new kind of export – London’s housing stock. Savills, an estate agent, estimates that overseas equity into just prime London residential property was above £7bn in 2012, and presumably it was higher still in 2013. Overseas buyers have always been involved in London property thanks to market transparency, liquidity, political stability, a clear rule of law, decent education, and low taxes versus countries such as France or Spain, but the 2012 inflows were twice the amount seen in 2008 or 2009, and about a third higher than in 2006.
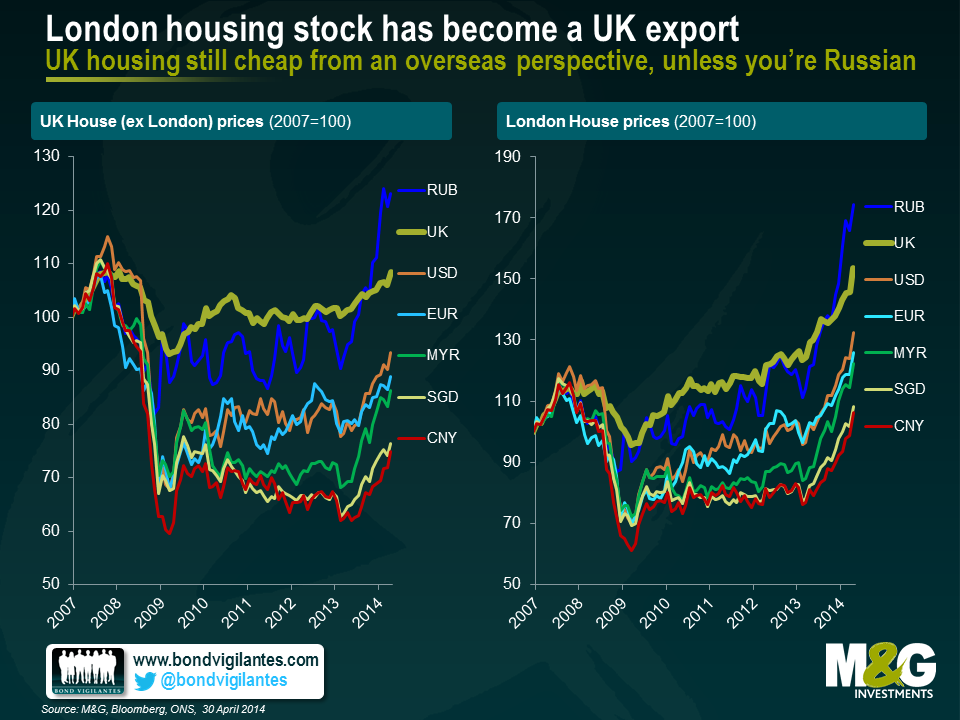
It’s easy to see why overseas buyers have taken a shine to UK property from the chart below. British houses feel far from cheap in local currency terms, but they look considerably cheaper from the perspective of all the traditional foreign buyers, with the exception of Russians. From the perspective of Chinese investors, London house prices are still 17.5% below their 2007 highs when measured in Chinese Yuan.
The Bank of England’s strategy for reducing domestic demand for UK housing via macro-prudential measures such as limiting loan-to-income ratios should be the primary way to tackle the destabilising effects of housing related indebtedness, and the Bank of England arguably could have done more. Stemming foreign flows into the UK housing market is much more attractive politically, but could be very unwise.
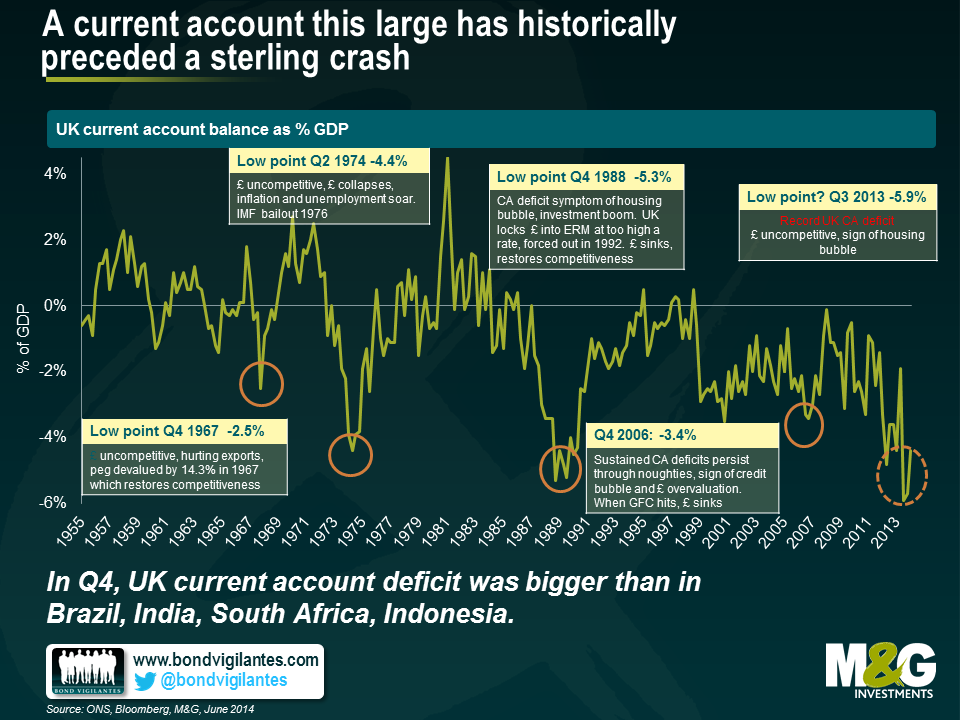
Data from last week showed that the UK’s current account deficit improved slightly in Q1 2014, but Q4 2013 was downwardly revised to 5.7% of GDP and Q3 2013 to 5.9%, a worrying new record. Of the so-called ‘Fragile 5’ emerging market countries, only Turkey had a bigger deficit in Q4.
A current account deficit is a broader measure of a country’s trade balance. The UK’s large deficit can be attributed to various factors (e.g. a sustained trade deficit, a deteriorating income balance which may partly reflect an increase in foreign companies taking over British companies, and sustained budget deficits), but generally speaking a chronic current account deficit is indicative of competitiveness problems. The chart below shows that a large and deteriorating UK current account balance has historically preceded a sterling crisis, where a sharp depreciation in sterling subsequently restored the UK’s competitiveness, and hence its current account balance. If you consider that foreigners buying new build houses in London is little different to foreigners mass buying Scotch Whiskey in terms of its effects on the national accounts, then proposals to tax foreign buyers of London property is the equivalent to taxing your own exports! Not a very clever thing to do with such a precarious current account balance. Note that taxing exports is considerably worse than protectionism, which typically involves taxing imports.
Macro prudential controls are a positive step and should help curb some of the local mortgage excess that has built up over the last couple of years. However, those pointing to supply-side factors as the primary reason for higher prices aren’t viewing the whole picture. UK property is cheap from an overseas perspective and will likely remain in demand to foreign buyers looking for solid returns in a low-yielding world. And beware the clamour of calls to stem foreign inflows into the UK housing market, which is turning into one of the UKs most in-demand exports. Of course, if macro prudential measures fail to take some of the heat out of the market, the Bank of England could always raise interest rates (if only they could remember how to….)
*This is calculated using UK RPI and the UK Nationwide House Price Index. Given there are methodological issues with both RPI and Nationwide data, it’s worth treating the calculation slightly cautiously – for example, UK RPI has averaged 0.9% higher than UK CPI since 1989, so real house prices appreciation is an additional 0.9% p.a. on a CPI basis.
**The recent nudge higher in both house prices and the move higher in first time buyer loan to income ratios is likely to have been assisted by the help to buy scheme (or the ‘help to sell scheme’, as we called it at the time), although given that as at the end of May, only 7313 houses were sold under the scheme with the total value of mortgages supported by the scheme at £1bn, there are other forces at play.
The value of investments will fluctuate, which will cause prices to fall as well as rise and you may not get back the original amount you invested. Past performance is not a guide to future performance.
17 years of comment
Discover historical blogs from our extensive archive with our Blast from the past feature. View the most popular blogs posted this month - 5, 10 or 15 years ago!


Bond Vigilantes
Get Bond Vigilantes updates straight to your inbox