
The downside of bonds
Government bond yields are extremely low across the globe. The highly unusual phenomenon of negative bond yields – even on debt issued by countries that still face a debt crisis – is now commonplace. In addition, investors are looking to protect themselves from the carnage in bond markets we have seen in recent weeks (for example, the “risk-free” German 2.5% 2046 bond is down -19% since the high price was registered on April 20). The much quoted German 10 year bund yield has risen from a low of 0.075% on April 20th to 0.56% at the end last week, but to put this in perspective, it has only taken 10 year bund yields back to where they were at the beginning of 2015.
So where should fixed income investors invest, particularly after the moves in yields we have seen in recent weeks? Should they remain in government bonds and enjoy the perceived safety of owning a risk-free asset, or should they be willing to accept higher levels of risk in order to chase the higher returns on offer in investment-grade and high yield corporate bond markets? Perhaps a more relevant question is: what is the potential downside of owning bonds?
Of course, it is not simply a matter of trying to maximise the return on investment. Another major consideration is the volatility an investor is willing to accept in pursuit of higher returns.
The chart below compares the drawdowns (peak to trough movements) in global government and global investment-grade corporate bonds since their respective inception dates (1986 for the government index and 1996 for global investment-grade corporates) and is based on monthly total return data.
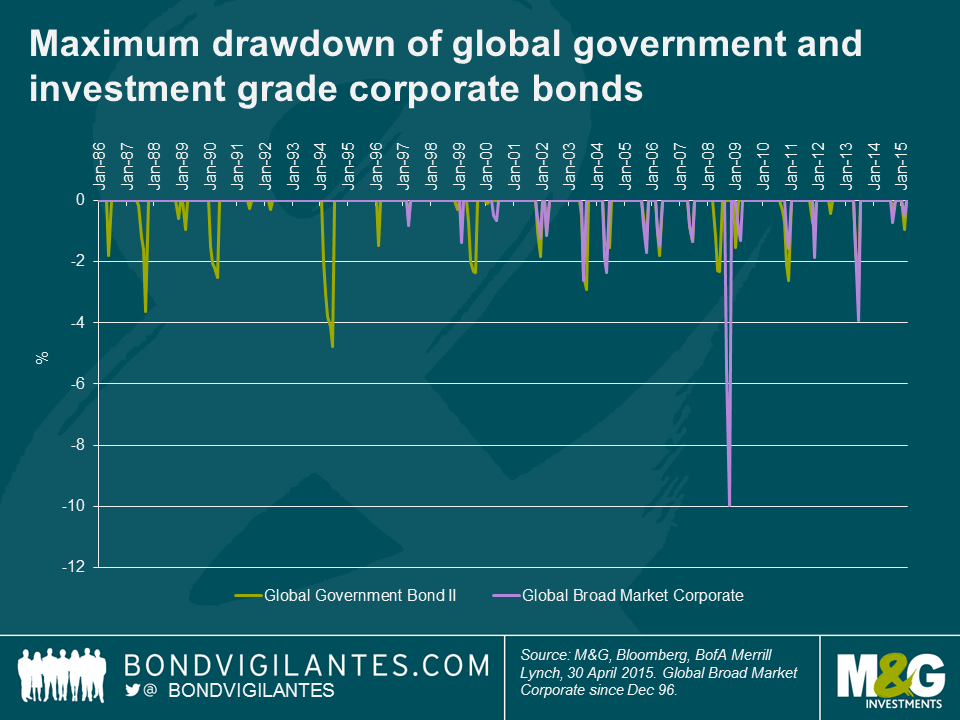
Since 1986, government bond investors have lost money in three calendar years. The magnitude of those losses is as follows: -3.1% (1994), -0.8% (1999) and -0.4% (2013). The reason that total returns have rarely been negative is because investors were receiving relatively high coupons and had a significant income cushion to protect against any capital downside. These days, total returns in government bond markets will largely be a function of capital movements, with income providing little support in a bear market for government bonds. Interestingly, the year after a negative returning year has historically been a fantastic time to own global government bonds with the asset class enjoying a total return of 16.9% in 1995, 8.1% in 2000 and 8.4% in 2014.
Government and investment grade corporate bond investors typically experienced a pretty smooth ride, though many will remember the great bear market sell-off of 1994. Even though there was a sell-off in government bonds in 1994, investors experienced a drawdown of around 5%. A drawdown of this magnitude in government bond markets has only occurred once in the past 29 years. The average maximum drawdown per calendar year since 1986 is only 1.5%. Hence government bonds enjoy a unique position in many investors’ portfolios, as they have been viewed as safe, they have been liquid, and they have let many investors sleep well at night.
Investment grade corporates have historically appeared to be a good alternative to government bonds with similar risk and return characteristics. They are more closely correlated to government bonds but are characterised by a lower interest rate risk profile. In addition, the historical default rate on investment grade corporates has been very low. Since 1970, the 5 year cumulative default rate on USD investment grade non-financial corporate bonds has been 1.1%. Given the global macroeconomic backdrop, we continue to believe that investment grade corporate bonds represent good value relative to government bonds, particularly as we think investors in the corporate bond market are being adequately compensated for a) default risk and b) liquidity risk.
Since 1997, the maximum drawdown was 10% in 2008, not helped by the historically very large weighting to financials as the world went into a major banking crisis. The average maximum drawdown since 1997 is 1.9% with an annualised return of 7.7%. Over the same time period, government bonds generated an annualised return of 7.0%.
Looking at the maximum calendar year drawdowns it quickly becomes apparent that high yield corporate bond investors suffer through greater volatility than the more defensive fixed income asset classes. There have been no less than six occasions since 1998 when the maximum drawdown in high yield was over 5% with an average annual maximum drawdown of 5.6%.
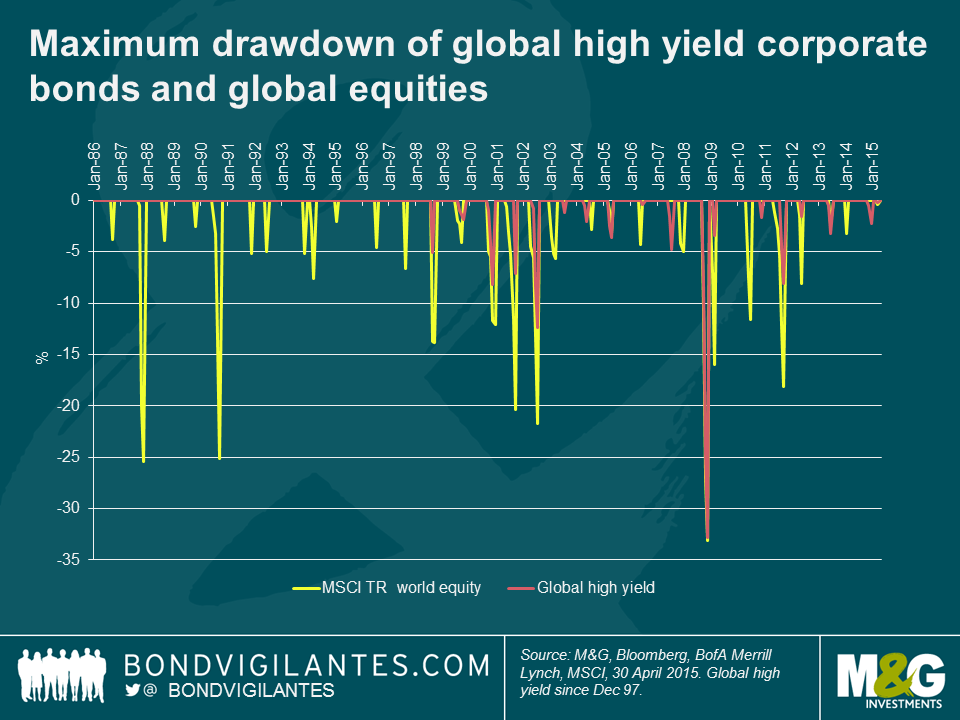
Over the past 29 years, the average annual maximum drawdown in the global equity market has been 9.4%. In this respect, high yield corporate bonds have a greater correlation to equity markets then traditional fixed income markets. The reason is high yield bonds and equities tend to respond in a similar way to macroeconomic developments, which can lead to similar return profiles over the course of a full market cycle. Equities are obviously a different asset class to high yield corporate bonds, but to a bond investor equities can be viewed as perpetual securities and therefore have a huge amount of credit spread duration. Additionally, unlike bonds, the owner of an equity usually has little or no security over a company’s asset base. High yield bonds tend to be less volatile than equities because the fixed income component of the total return provides an added measure of stability and the potential for capital appreciation means that high yield corporate bonds can offer equity-like (or better than equity) total returns in the long-run.
However, during bouts of market risk aversion, high yield bonds generally underperform the broader fixed income market. In 2008, facing a storm of forced selling global high-yield corporate bond investors experienced a 33% decline in the value of their investments. High yield also performed poorly because these highly levered companies have a lot more credit risk than investment grade companies (since 1970, the 5 year cumulative default rate on USD high yield non-financial corporate bonds has been 20.5%), and the macroeconomic outlook in Q4 2008 was the worst it has arguably ever been. Over the same period, government bonds appreciated in value by almost 5%. This highlights a benefit of government bonds – they tend to be uncorrelated with riskier assets.
Those high yield investors that avoided the temptation to sell during the dark days of 2008 have been duly rewarded by the market. From November 2008 until March 2015, global high-yield corporate bonds have generated a total return of 172% in an environment where global high yield default rates have been exceptionally low. Over the same time period, global equities have experienced a total return of 135%. In this sense, high yield corporate bonds have behaved more like equities rather than traditional fixed income assets like government bonds.
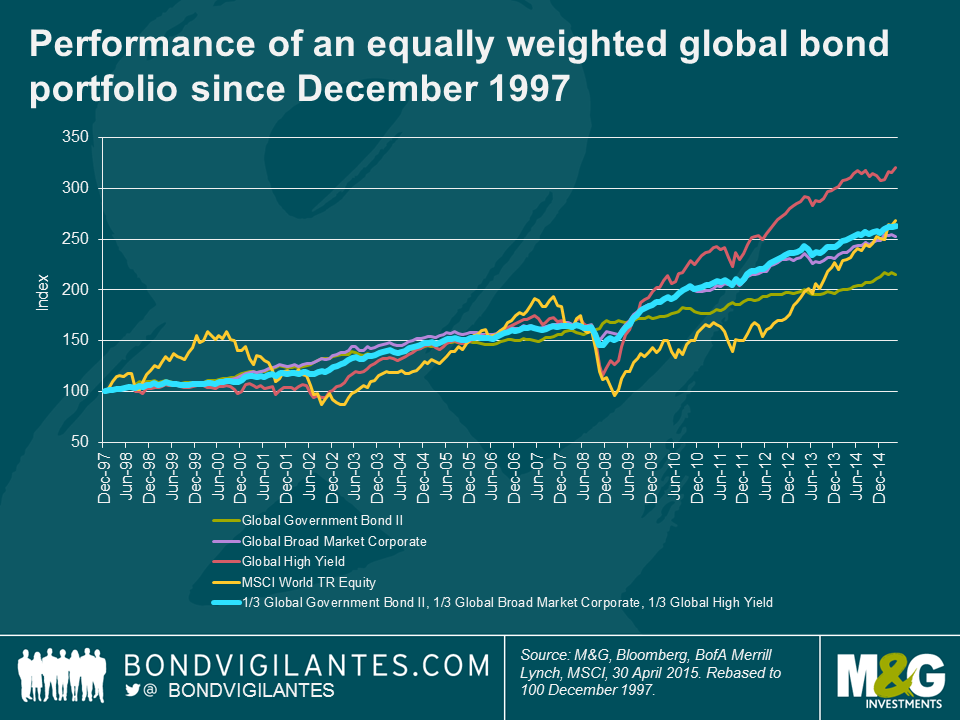
For those that are curious, the blue line in the chart below shows the performance of an equally-weighted portfolio of global fixed income assets since December 1997. This portfolio generated an annualised return of 7.9% (similar to global equities) with less than half the volatility of being invested fully in high yield or equities.
Whilst an historical analysis is interesting, is there anything that can be gained in order to assess potential future returns from fixed income assets?
It is possible to model (with some simplifying assumptions, like any move in rates is a one-off shock and the yields rise across the curve by the same amount and no move in currencies) for any movements of bond yields and corporate bond spreads and compare to the historic return profile for fixed income. It is simplistic but is useful as a rough guide to highlight the impact that lower yields could have on fixed income total returns.
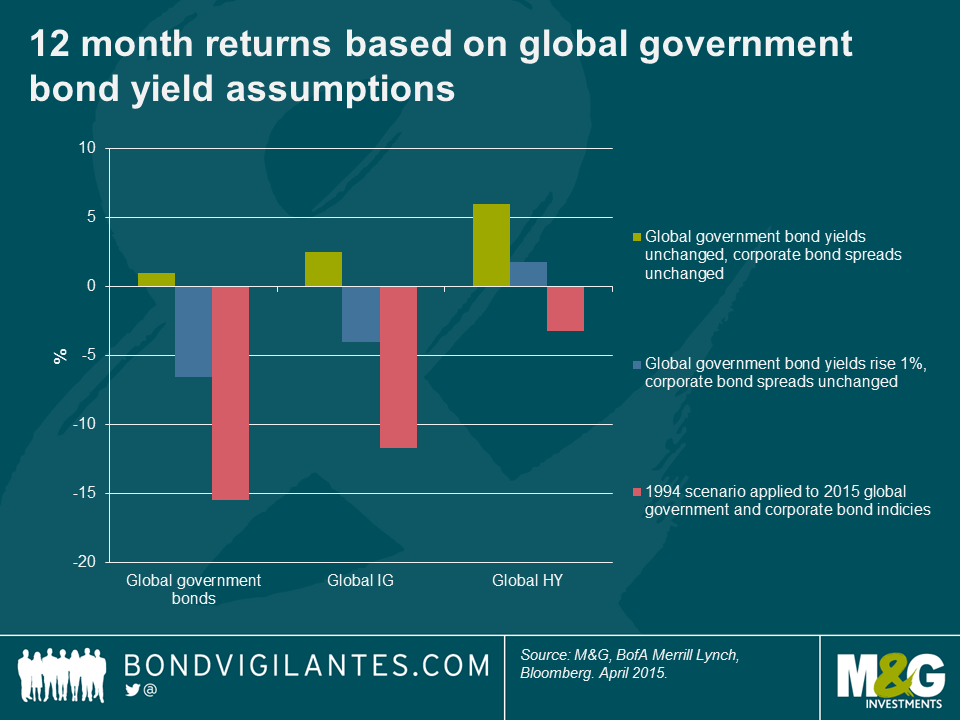
Firstly, assuming that government bond yields and corporate bond spreads do not change and investors receive the current yield to maturity on the fixed income asset classes, the expected 12 month total returns are:
- Global government bonds: 1.0%
- Global investment grade corporates: 2.5%
- Global high yield corporates: 6.0%
Secondly, looking at a scenario where government bond yields increase by 1% but credit spreads remain stable gives the following total returns over 12 months:
- Global government bonds: -6.6%
- Global investment grade corporates: -4.0%
- Global high yield corporates: 1.8%
Given that yields are at historic low levels, there has never been less of an “income cushion” to protect against the possibility of a fall in bond prices. Government bond yields only need to increase by 73bps in order to match the record drawdown experienced by government bonds in 1994.
Finally, the yield on the Global Government Bond index rose from January to November 1994 by 219bps. 1994 was the year that generated the maximum drawdown in global government bonds. An equivalent move today (and assuming no change in credit spreads) would result in the following total returns:
- Global government bonds: -15.5%
- Global investment grade corporates: -11.7%
- Global high yield corporates: -3.2%
The conclusions we can draw from this analysis are:
- Now more than ever, duration positioning is contributing to bond returns.
- It would not take much in terms of higher bond yields to cause a record drawdown in government bonds. Interest rate hikes or higher inflation could cause a significant move higher in bond yields.
- Future returns from fixed income are likely be much lower than investors have historically experienced.
- Government bonds have and do experience losses. Arguably, the chances of losses have never been greater given the collapse in bond yields around the world.
- If corporate bond spreads were to rise (due to investors pricing in a higher default premium) in tandem with higher government bond yields the above return scenarios would be optimistic.
Of course, there are some very good reasons to own government bonds which I have previously written about. High global debt levels, structural deflationary forces and the global savings glut mean that over the long term, government bond yields may not increase to levels seen a couple of years ago. As the drawdown analysis above shows, government and investment grade corporate bonds tend to be less volatile, have lower drawdowns and have proven to be less correlated with higher risk assets like high yield corporate bonds and equities.
For those looking at moving out of government bonds given low yields, based on a risk and return basis investors might view investment grade corporates as a good alternative, and historically investment grade assets have shown a relatively low probability of generating a negative return in a calendar year. However, investors should be aware that investment grade corporate bonds have proven to be closely correlated to government bonds. Subsequently, any sell-off in government bond markets will likely hit IG corporate bond returns as well. The collapse in corporate bond yields to extremely low levels has reduced the income contribution of total returns, though the credit spread on offer is rewarding in an environment of low defaults and solid economic growth.
In a world of ultra-low yields and lower future returns from fixed income, many may be tempted to invest in riskier assets. High yield corporates are more closely correlated but exhibit lower volatility to equities. High yield corporate bonds experience far greater volatility than more defensive fixed income asset classes and hence investors should be prepared to experience drawdowns in their portfolios over the course of a market cycle. That said, the higher yield on offer does protect against any possible increase in yields, as does the shorter duration profile of the high yield asset class.
Looking at historic returns, drawdowns and correlations give a useful guide to how fixed income returns might be impacted in a world of rising yields. However, the collapse in yields across the fixed income spectrum now means that investors are at greater risk of higher drawdowns than ever before, and the income component of their total return is unlikely to adequately compensate for any hits to capital returns like it would in the old days.
The value of investments will fluctuate, which will cause prices to fall as well as rise and you may not get back the original amount you invested. Past performance is not a guide to future performance.
17 years of comment
Discover historical blogs from our extensive archive with our Blast from the past feature. View the most popular blogs posted this month - 5, 10 or 15 years ago!


Bond Vigilantes
Get Bond Vigilantes updates straight to your inbox