
Three of our most popular charts
We often use Twitter to share the charts that we think are interesting, but probably don’t warrant the extra analysis of a blog. With this in mind, I’ve had a look to see which charts were most favourited or retweeted by our followers at @bondvigilantes and provided a little more detail than 140 characters can allow.
- Fed Loan Officer Survey show US banks have tightened standards for six consecutive quarters. Rarely seen outside recessions.
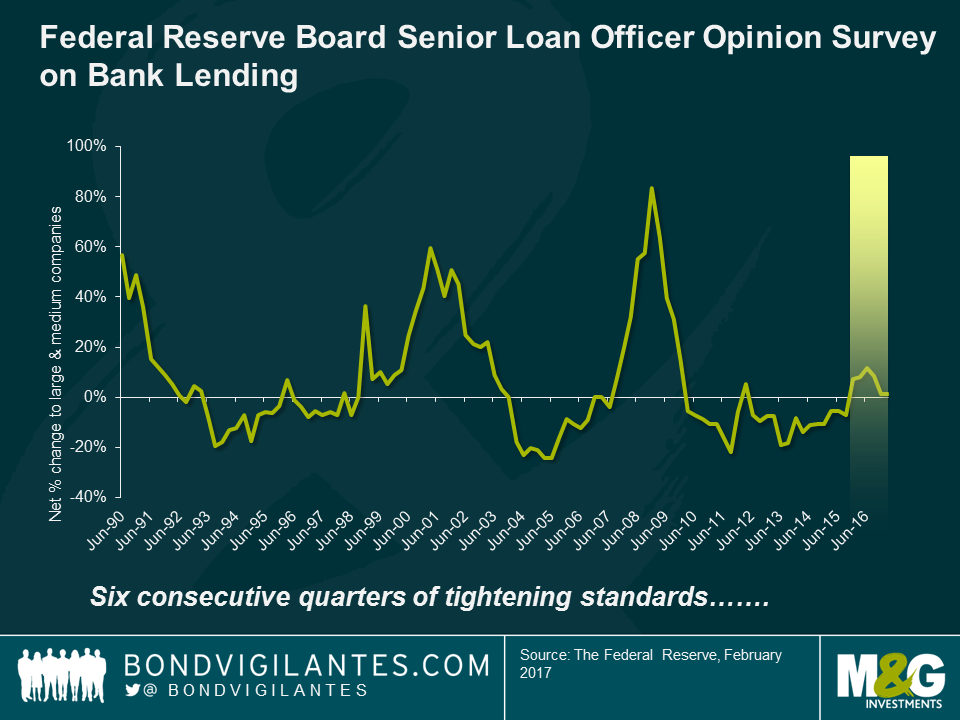
Every quarter, senior loan officers of large US banks are asked by the Federal Reserve how their standards for approving business loans have changed from the previous quarter. Looser standards suggest credit is easier to obtain, so companies and individuals can invest and spend, which leads to higher economic growth. A tightening in standards suggests credit is harder to obtain, and hence economic growth may slow.
Lending standards and growth in loans and output are negatively correlated, so lending standards can be predictive of economic growth. As the chart above shows, it is rare to see US banks tighten standards for six consecutive quarters outside of a recession, and with the FOMC likely to hike interest rates on Wednesday, credit may become increasingly difficult to come by, particularly if the firm or individual has a poor credit rating.
- According to @JPMorgan, total EM debt universe has grown to +$16.3trn – that’s 3x the size of DM IG and 9x that of DM HY.

In a world where many fixed income investors are paying to lend to developed market governments, and corporate bond yields are around all-time lows, emerging market bonds are increasingly being viewed as an area for investors to allocate to in search of higher returns. The universe of emerging market fixed income issuers is large and diverse, and non-financial EM corporate bond markets in particular have grown considerably in response to the disintermediation of banks. Local market issuance has become increasingly important in recent years (especially in Asia) as local savings institutions have evolved to support local debt markets. In global bond markets, the stock of debt issued by EM corporates is now larger than their developed market equivalents. Turning to government bond markets, the stock of developed market sovereign debt ($25.0 trillion) remains far greater than the emerging market sovereign bond market ($8.5 trillion). This reflects the lower levels of indebtedness of emerging market governments.
- For bond investors: Debt $20,000,000,000,000 caps for sale. Only $60bn of US debt to go.
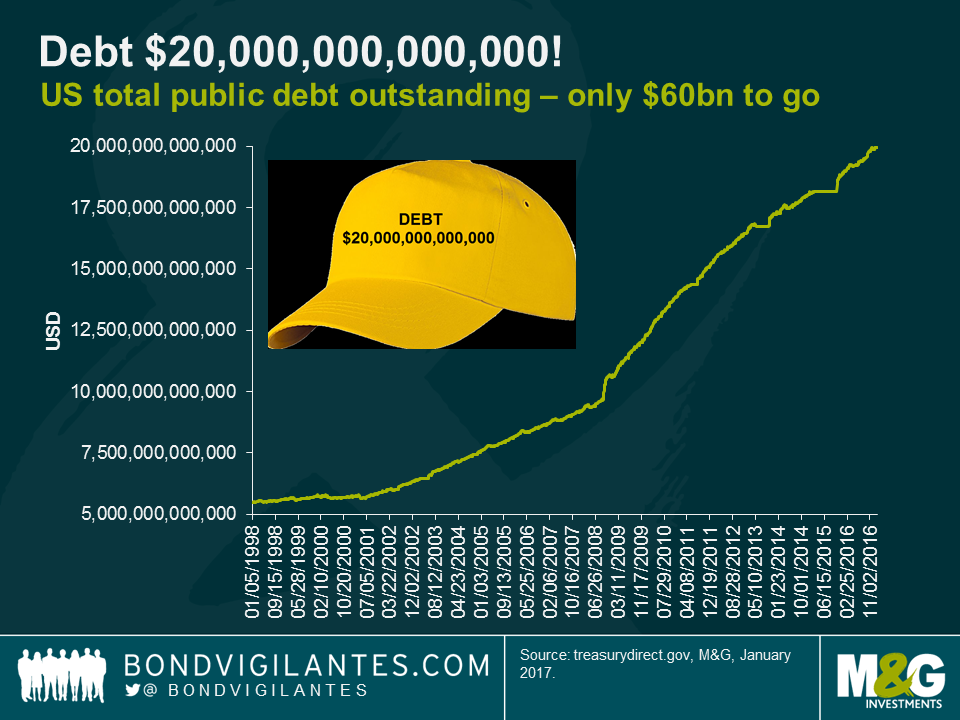
With the Dow Jones Industrial Average making headlines for closing above 20,000 for the first time, it was interesting to note that US total public debt outstanding looks set to rise above $20 trillion. Whether it does or not will depend upon the U.S. Congress raising the government’s debt limit. The level of US public debt outstanding has more than doubled since the financial crisis.
The U.S Treasury Department’s ability to raise debt will be suspended later this week, with Treasury Secretary Steven Mnuchin stating that state and local government bond issuance will begin to cease until Congress raises the debt limit. The Congressional Budget Office thinks that unless the debt ceiling is raised, the U.S. Treasury would run out of cash to pay creditors in about six months, resulting in an unprecedented US default. Whilst markets are not currently focused on the debt ceiling, the clock is ticking, and Mnuchin has made it clear that the issue is critical and requires urgent attention from Congress.
The value of investments will fluctuate, which will cause prices to fall as well as rise and you may not get back the original amount you invested. Past performance is not a guide to future performance.
17 years of comment
Discover historical blogs from our extensive archive with our Blast from the past feature. View the most popular blogs posted this month - 5, 10 or 15 years ago!


Bond Vigilantes
Get Bond Vigilantes updates straight to your inbox