
A pretty good indicator of USD/EUR exchange rate movements
After four calendar years of price appreciation, it looks like the US dollar will end 2017 deeply in negative territory. The dollar has fallen by almost 12% this year versus the euro and around 8% on a trade weighted basis. More surprisingly, the sharp depreciation of the dollar against the euro has occurred in a period when central bank policy has diverged, resulting in the yield differential between 2 year US Treasuries and German Bunds widening, going against the broad relationship of the past 10 years.
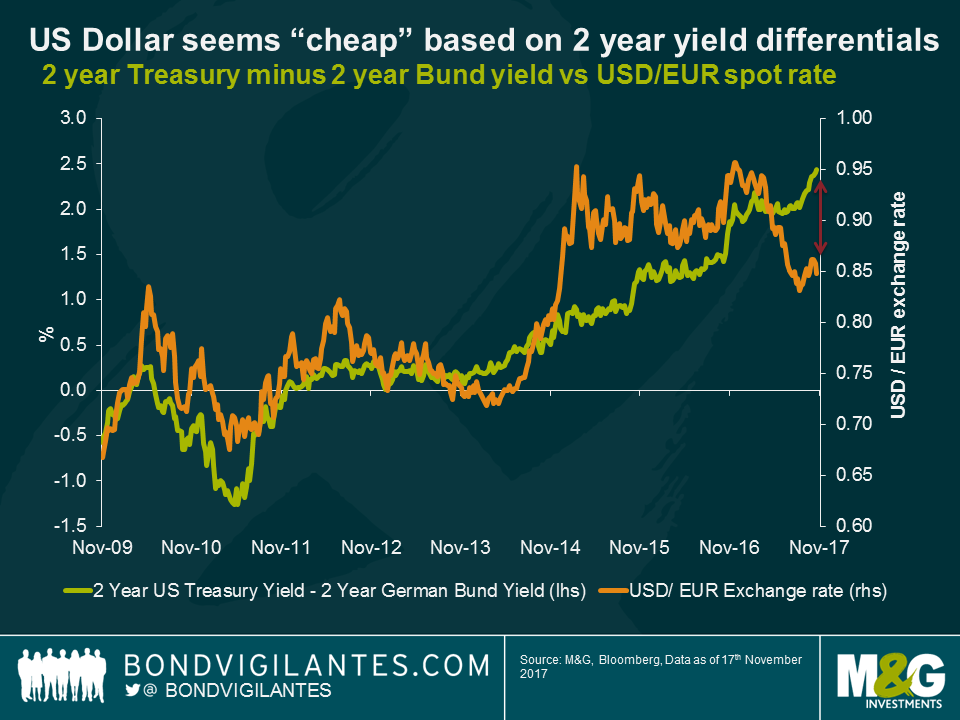
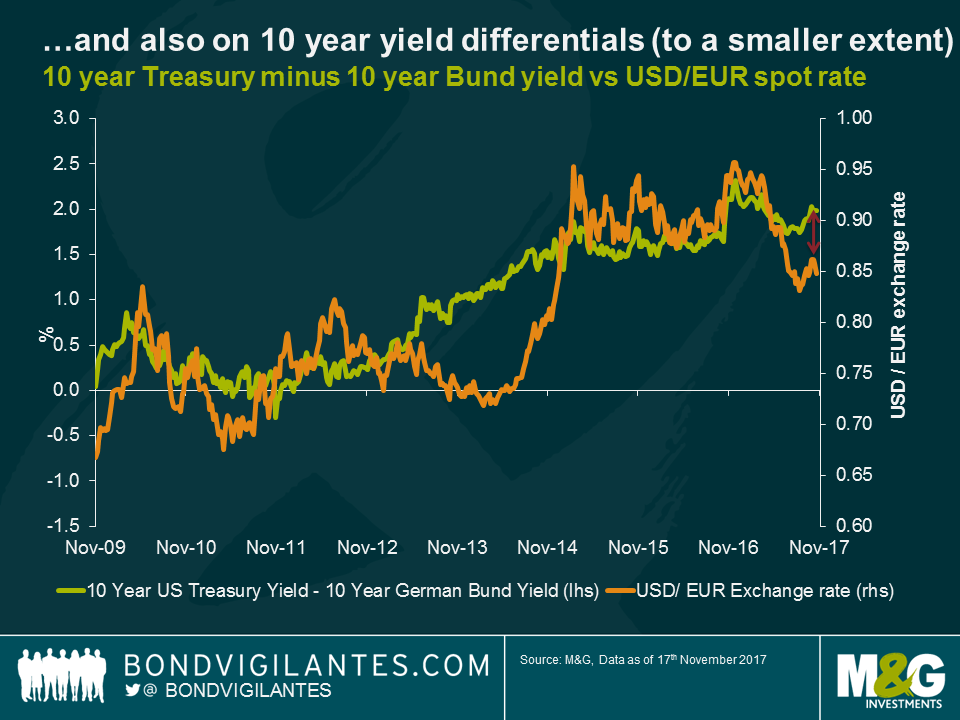
We recently pointed out some some of the reasons behind the US dollar’s weakness versus the euro despite rising yield differentials here. In addition, it’s worth pointing out that the current dislocation between US and European government bond yields and currencies is probably exacerbated by two additional and slightly more technical factors. Firstly, given the fact that the ECB has been buying a disproportionate amount of Bunds relative to other European government bonds, the current Bund yield is significantly depressed, increasing the yield differential with US Treasuries. If the US versus Europe yield differential is calculated using a capital key weighted average of German, French, Dutch, Belgium, Spanish, Italian, Portuguese and Irish 2 year government bonds instead of Bunds, the EUR / USD dislocation does not appear as extreme. Calculated in this way, 2 year European yields would be approximately 0.2% higher, reducing the yield differential with Treasuries by around the same amount. Secondly, the flat shape of the US yield curve suggests the US dollar is not as cheap relative to the euro as the 2 year differential chart would suggest. If 10 year US Treasury versus German Bund yield differentials are used, the US dollar still looks undervalued, but to a smaller extent.
Nonetheless, even using the slightly modified methodologies mentioned above, the USD still appears undervalued versus the Euro relative to what the yield differential would suggest. Given that this relationship has been quite strong since the global financial crisis, an interesting exercise has been to look at the relationship from a longer term perspective in order to compare the current valuation gap to what has occurred historically. By chain linking movements of the underlying euro currencies to the euro before 1999 and comparing them to the difference between 2 year Bund yields and 2 year Treasury yields, I produced the chart below, which goes back to the mid 1970’s.
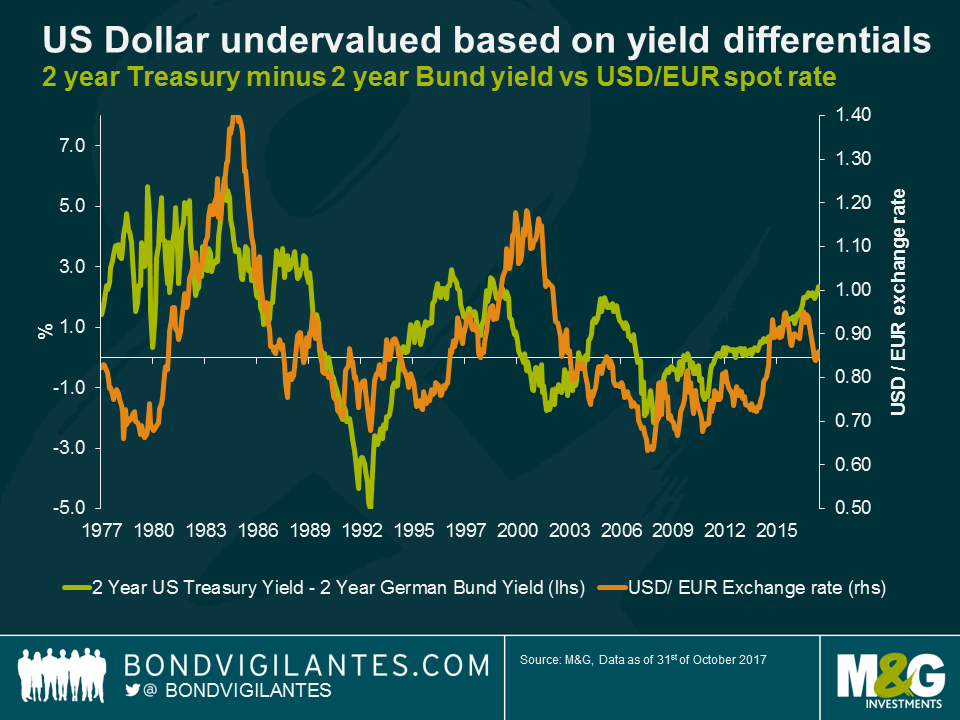
While taking a longer term view confirms that there is a positive relationship between yield differentials and the USD/EUR exchange rate, it also shows that over the past 40 years there have been times when the relationship has broken down quite drastically. One of the reasons this may be the case is that in the 70’s and 80’s, capital markets were not as global as they are today, so investors were less able to arbitrage yield differentials between the US and Europe (i.e. Germany before 1999 in this case) in the same way.
In addition, the fact that bond yields have fallen quite dramatically over the period makes interpreting the chart more challenging, as one is less likely to see today the same level of yield divergence as in the past. One way to adjust at least in part for this factor is to use real yield differences (which I have approximated in the chart below by using nominal yields minus trailing year-on-year inflation rates) rather than nominal yields and compare these to the historical USD/EUR exchange rate.

The chart above shows that adjusting for differences in inflation between the US and Germany improves the relationship significantly, especially during times of inflation surprises or significant inflation divergences between the two countries. Another argument that can therefore be put forward to explain the USD “cheapness” today when measured by yield differentials is that it may have been caused by consistently higher inflation expectations in the US relative to Europe in recent times.
Over the past forty years there have been a couple of instances where the relationship between yields and exchange rates have broken down for a prolonged period of time. The first of these two instances occurred between Q1 1994 and Q1 1996 and coincided with what is known as “the Bond Massacre” (we have previously written about this here), a period where the US Fed hiked rates by 2.5% in a single year, wreaking havoc in bond markets. The second instance was from early 1999 to late 2002 and corresponds to a major confidence crisis for the newly introduced euro (the euro had a rough start, see here for example).
Despite the relationship breaking down more recently, the yield differential between two year US Treasuries and 2 year German Bunds remains a relatively good predictor of exchange rate movements over the long term. Those predicting further weakness of the US dollar relative to the euro in 2018 (the forwards market suggests EUR/USD at 1.21 in Q4 2018 despite expectations of further rate hikes from the Fed) would do well to remember this relationship.
The value of investments will fluctuate, which will cause prices to fall as well as rise and you may not get back the original amount you invested. Past performance is not a guide to future performance.
17 years of comment
Discover historical blogs from our extensive archive with our Blast from the past feature. View the most popular blogs posted this month - 5, 10 or 15 years ago!


Bond Vigilantes
Get Bond Vigilantes updates straight to your inbox