
Panoramic Weekly: Fake (trade) news sink markets; bonds rally
Global bond markets rallied over the past five trading days as plunging oil prices, weak US data and disappointment over the real impact of a 90-day trade truce between the US and China led to a sharp flattening of the US yield curve, which is now only 12 basis points from inversion. The flattening intensified after US President Trump toned down his recent comments about the US-China trade agreement struck over the weekend in Buenos Aires. The appointment of Robert Lightizer, a renowned US trade hawk, to lead the next round of trade negotiations didn’t help either. The environment was further dampened by a global equity sell-off, disappointing PMI European data and violent, anti-austerity riots in Paris. Britain’s own troubles also intensified as the crucial Dec. 11 Parliamentary vote on Brexit approaches.
Only four of the 100 fixed income asset classes tracked by Panoramic Weekly failed to gain on the gloom, including US leveraged loans, which usually do well in a rate rising environment. The market-implied probability of a Federal Reserve rate hike next week fell to 74%, down from 80% last week. European high yield also failed to deliver positive returns, dragged down by Italy’s ongoing woes over its budget deficit. Long duration bonds fared best, given their higher sensitivity to interest rates: UK inflation-linked bonds soared 3.4% over the past five trading days, while 25-year Treasuries returned 2.7%. Doubts over US growth punished the dollar, fuelling a rally in Emerging Market (EM) sovereign bonds and currencies. EM currencies were also underpinned by further rate hikes in South Korea and Pakistan. Credit spreads mostly widened given the generally pessimistic tone, but the drop in the underlying sovereign base rate offset the fall, helping most corporate asset classes still deliver positive returns.
Heading up:
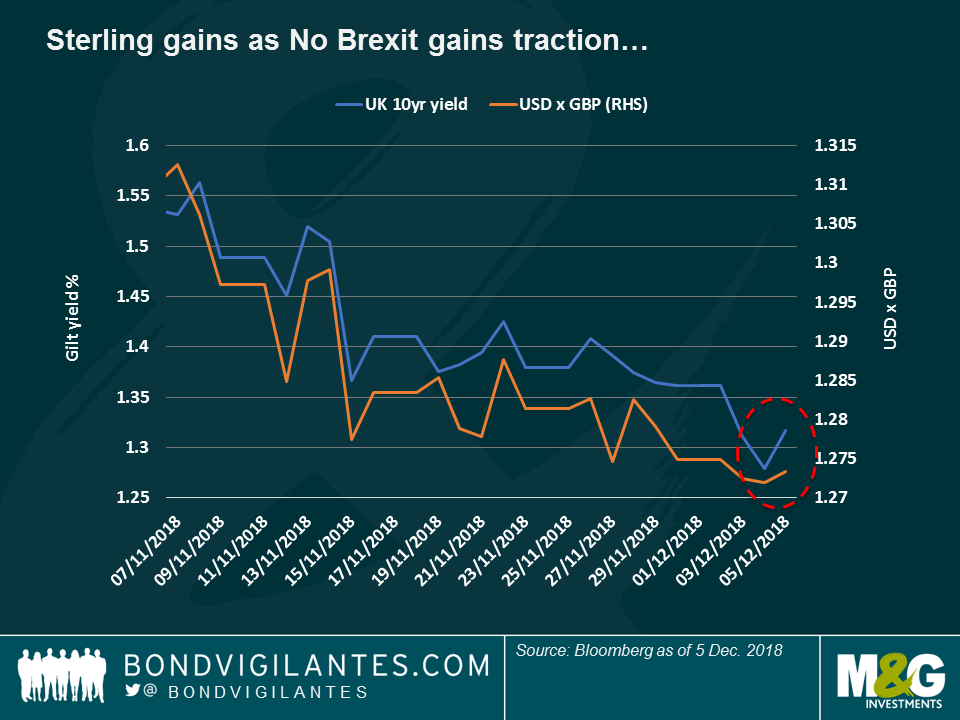
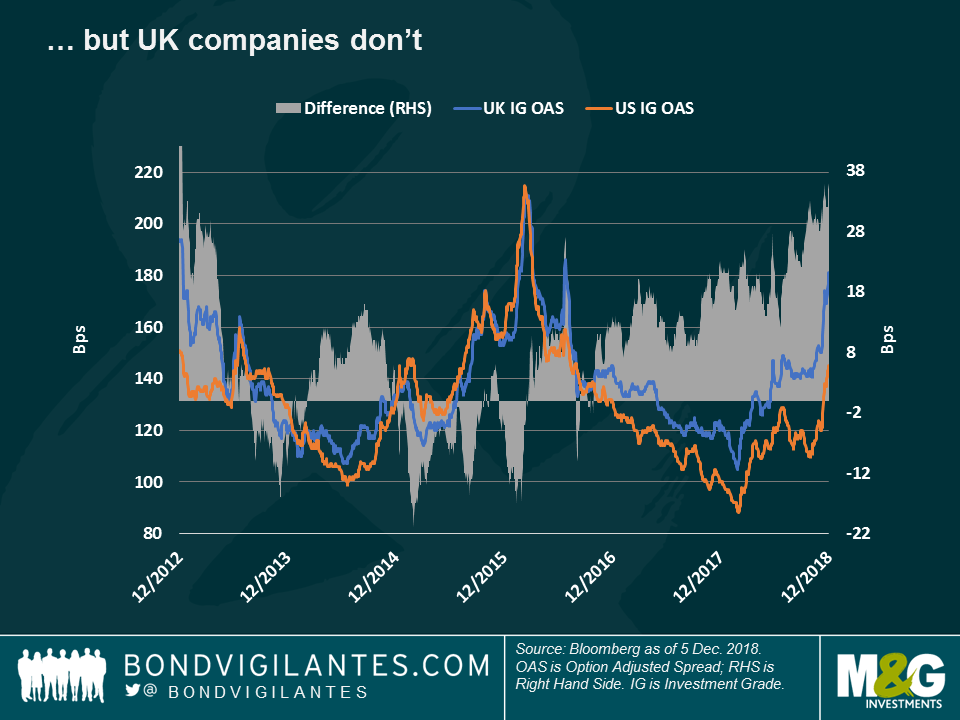
UK – to Brexit or not to Brexit: In truly Shakespearean dramatic style, the House of Commons pushed to increase its say in case Prime Minister Theresa May’s Brexit deal doesn’t pass the Dec. 11 vote in Parliament as widely expected. At the moment, potential outcomes remain wide open including: a Conservative leadership challenge, a general election, a second referendum on EU membership, a postponement of the decision to leave, and even a revocation of the agreement entirely. Financial markets interpreted developments as a sign that staying within the EU is an increasing possibility, something which fuelled a slight appreciation in the pound. As seen in the first chart, gilt yields also rose, on lower safe-haven demand. Inflation expectations slightly eased, as a stronger pound helps contain import price growth. UK companies, however, didn’t see any relief: the difference between the risk premium that investors demand to hold UK Investment Grade bonds relative to their US peers continued to widen, reaching 36 basis points (bps), the highest since 2012, at the height of the European sovereign debt crisis. After two tumultuous years of negotiations, at this stage only one thing seems certain – we haven’t seen it all yet.
EM yields – compensating for risk? EMs have had a tough 2018, mostly driven by fears of weaker global growth, a rising dollar and country-specific troubles in Argentina and Turkey. One of the asset class’s flagship indices, the JP Morgan gauge of EM sovereign US dollar-denominated debt (EMBI), has plunged 5% so far this year, also dragged down by the poor performance of oil-exporting countries, such as Brazil, Mexico and Venezuela. The price drop, however, has lifted the EMBI’s yield to 7%, the highest since the index was created in 2009 – a level at which some investors feel compensated for risk.
Heading down:
US yield curve – curving: Bond investors usually like curves because convexity enhances gains and reduces losses – but not everybody likes the curves that are on offer now: the difference between 10- and 2-year Treasury yields has plunged to a mere 11 basis points, the lowest since 2007 and nearing the inversion line – usually a sign of recession. As seen in the chart, curve inversions have often preceded recessions (grey bars), usually triggered by either an asset bubble burst (like the dot.com bubble in the early 2000s or the Mortgage-Backed Securities implosion in 2007), or by a succession of rate hikes, which damage growth. Some observers were expecting the 2-10 curve to eventually invert next year, although this week’s events might have brought such an outcome a bit closer: the 5-2 year curve has already inverted, having reached -0.967 basis points this week. Observers in this camp argue that the recent, sharp increase in the US Treasury 2-year rate, the world’s de facto discount rate, will most likely hit growth and reduce earnings. Other investors, however, believe that US growth and corporate earnings, albeit a bit slower, are still solid. According to consensus estimates, the US economy is set to grow by 2.9% this year, 2.6% next, and 1.9% in 2020.

US BBBs – Geee: The lowest-ranked credits among US Investment Grade (IG) corporate bonds continued to suffer from a decade of relentless size growth – and some specific stories: the spread over Treasuries that US BBB-rated companies have to pay spiked to 174 basis points (bps) on Wednesday, the highest in more than two years. The asset class has also been hit by mounting investor concerns over General Electric, the US industrial titan that has embarked on a deleveraging and asset sale programme in order to shore up its books – don’t miss Mario Eisenegger’s blog: Can General Electric ease the pain of BBBs?
The value of investments will fluctuate, which will cause prices to fall as well as rise and you may not get back the original amount you invested. Past performance is not a guide to future performance.
17 years of comment
Discover historical blogs from our extensive archive with our Blast from the past feature. View the most popular blogs posted this month - 5, 10 or 15 years ago!


Bond Vigilantes
Get Bond Vigilantes updates straight to your inbox