Markets
Gold prices: beyond inflation and real yields
By Robert Burrows
25 April 2024

This week has seen risk-off sentiment back with a vengeance as the Coronavirus outbreak dominates news headlines globally. Thus, investors are flocking to historically safe assets like low beta currencies, government bonds or investment grade corporate bonds with low default risks. However, can Japanese assets like the yen, nominal government bonds (JGBs) and inflation-linked government bonds (JGBIs) still be considered safe havens?
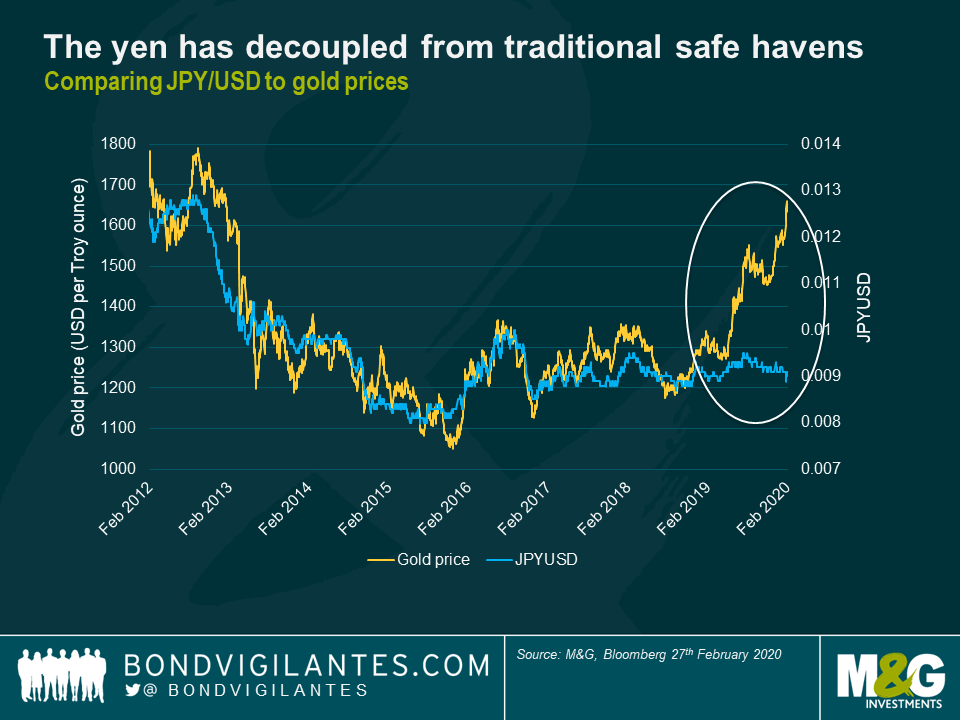
Looking firstly at the yen, the currency rallied during last year’s tensions in the middle east but has since reversed its gains against the dollar and USD/JPY recently hit new lows since 2017, despite the Coronavirus outbreak theoretically boosting the case for haven flows. Whilst this may be partly due to Japan’s proximity to the virus origin point, there are also a number of indicators that highlight that the yen is less correlated with traditional safe havens than it used to be. The chart below highlights how JPY/USD cross currency used to follow gold prices, an indicator of the health of the global economy, very closely until the end of 2018. 2019, however, saw a significant decoupling of this trend as the yen seems perpetually reluctant to converge back to its theoretical fair value.
Historically, both gold and the yen have been driven by the rush to safe haven assets, as well as real interest rate expectations. In the current global low rate environment, along with extensive quantitative easing in Japan and structural changes in the yen market, the yen has lost considerable purchasing power over time, whereas gold has the reputation of being the only form of money to protect purchasing power over long periods of time. Importantly, when the Bank of Japan (BoJ) embarked upon their ambitious monetary stimulus campaign two decades ago, Japan was one of the few low-rate markets, meaning that risk-on moods used to spur investors to engage in the yen-carry trade. These positions would then be closed out when geopolitical risks or weak economic data encouraged investors to de-risk portfolios. Thus, the yen was likely being ‘over-traded’ in line with market sentiment. Nowadays, with global rates having fallen in line with Japan (so called ‘Japanification’), less active currency carry trades are taking place, likely leading to the yen trading within a narrower band of fluctuation than in the past.
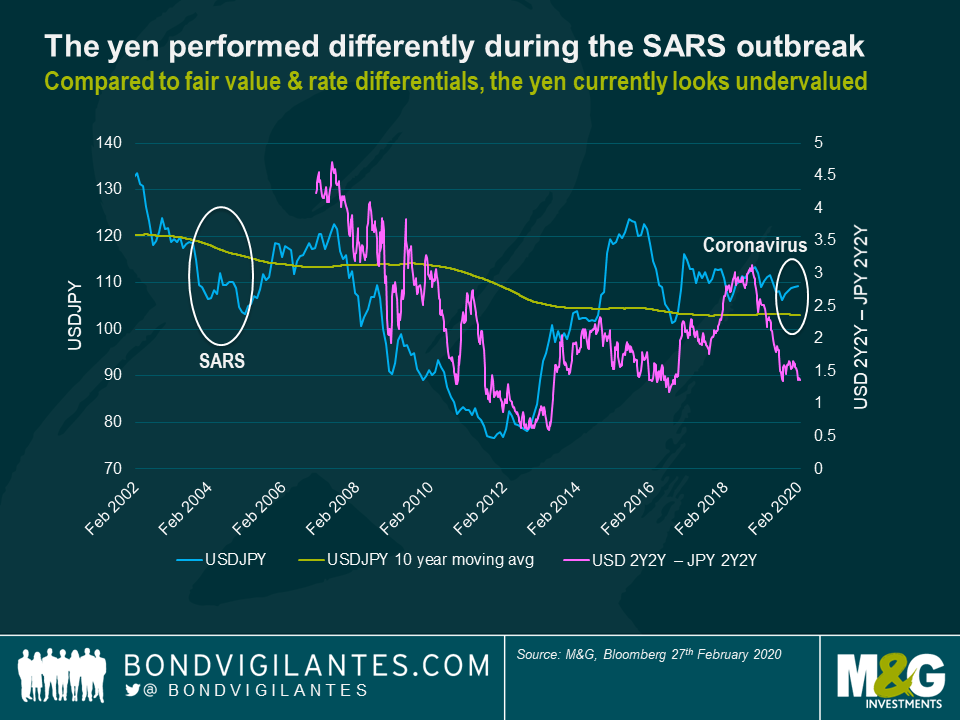
Comparing current USD/JPY moves to the period covering the SARS pandemic (2002-2004) in particular, the turnaround in the behaviour of the yen could be partly linked to how other developed market currencies like USD & EUR are less risky relative to the yen than they used to be. The dollar is currently offering higher liquidity and yield, presenting a more practical option as a safe haven currency to many investors. This is coupled with the fact that the Japanese economy is now struggling, showcased by a 6.3% economic contraction in the last quarter of 2019. The political situation is increasingly fragile as the decision to hike sales tax rates at a time when Japan may be on the brink of recession has come under fierce criticism. Fears are also growing that Prime Minister Abe’s poor handling has expanded infection of the virus, particularly with respect to his decision to keep thousands of passengers and crew confined on a cruise ship. It is no surprise that three surveys last week found that the approval rating of his cabinet has dropped, which could negatively impact the yen as the political outlook looks increasingly uncertain. Speculation that the BoJ may announce further monetary stimulus, only a couple of months after the previous round, has inevitably grown. Additional BoJ stimulus undoubtedly has negative implications for the yen and further highlights the attractiveness of a positively yielding dollar. Conversely, from a valuation perspective, compared to (two year) rate differentials the yen sell off may be overstated against the dollar, with potential room to revert, although the relationship between the cross currency and yield differentials seems to have loosened in recent years.
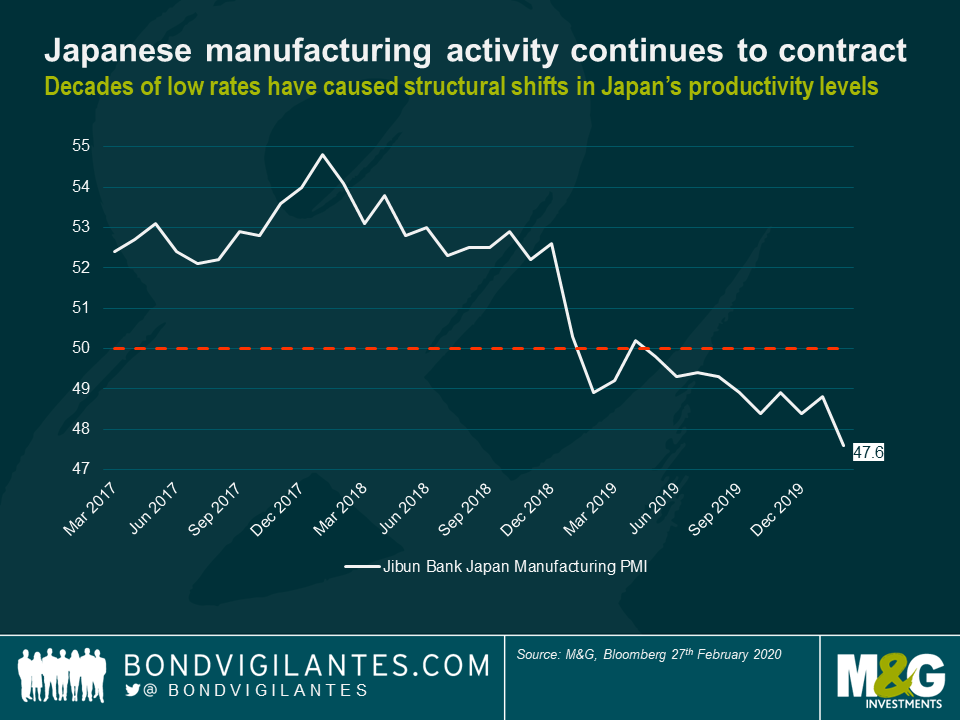
Speaking of rates, it is important to understand how extended monetary stimulus is structurally changing the economic fundamentals that underpin the yen. Years of low interest rates have kept a lid on the currency, benefiting exporters and allowing the hugely indebted Japanese government to continue to borrow inexpensively. On the other hand, it has also meant that cheap loans have kept unproductive companies alive, slowing efforts to revitalise an economy struggling with slowing growth, very low inflation, lacklustre productivity gains and an ageing population. Along with weak manufacturing PMI numbers as Japanese economic activity is being hit by the coronavirus, it is perhaps no surprise that the yen is not performing in line with expectations, despite the current risk-off environment. While Japan’s healthy current account surplus suggests that it could reclaim its safe haven status once the virus crisis has ebbed, strong US fundamentals and the dollar being seen as the current safe haven of choice could continue putting pressure on USD/JPY as we progress through the year.
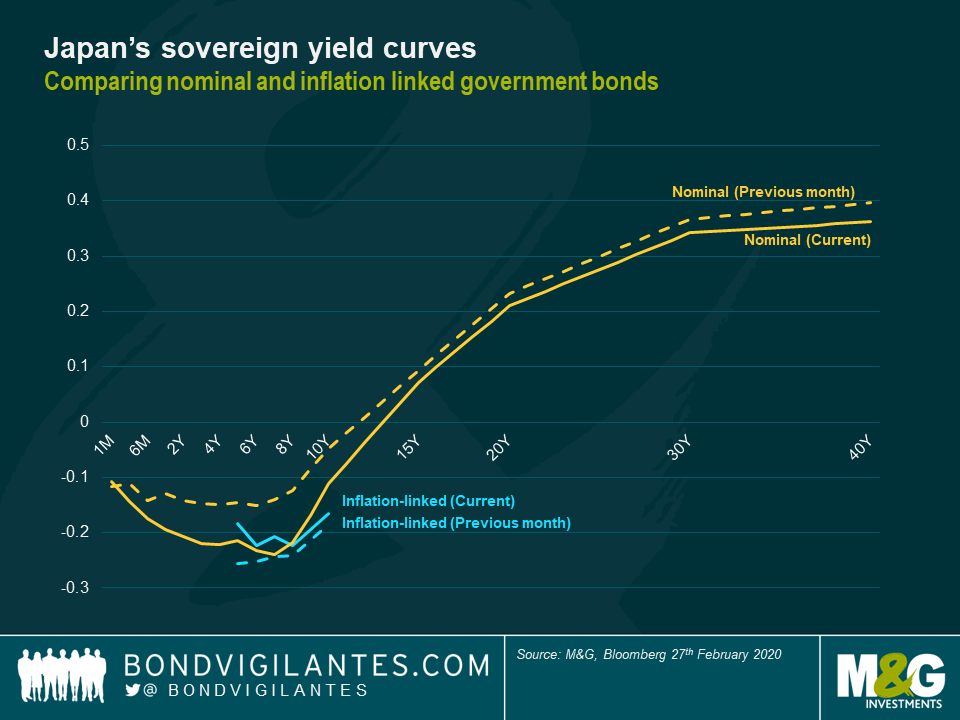
While yen depreciation may keep the market complacent about a potential rate cut, economic fundamentals are undoubtedly deteriorating and Japan may fall into a technical recession if the negative impacts from the virus outbreak persist. What is interesting is how the yen, and other currency moves since the outbreak, seem to be pricing in the macro risks significantly more than government bonds and credit spreads. As investors seem deterred from Japan as a whole, we would expect JGB yields to have widened along with other sovereign bonds that are linked to China (Malaysia, Indonesia etc). Contrastingly, almost every position of the yield curve has tightened compared to last month, with the belly of the curve in particular coming in around 10 basis points. Furthermore, the 8-10 year part of the curve has steepened slightly so 10Y or even 15Y paper currently shows some value in terms of roll. Comparing the nominal curve to the linker curve, breakevens are currently near zero and yields on JGBIs have barely moved compared to the last month, with the 7Y nominals actually trading through the linkers at the time of writing. This potentially shows how their illiquidity prevents them from following the movement of nominal yields. Further stimulus could push JGB yields down even further, but breakevens are already so low that to stop the nominal curve trading through the linker curve, natural market correction could spur demand for the linkers. Once the hunt for alternative safe havens other than the dollar resumes, investors may look at JGBIs as offering the most attractive option (vs nominals and the yen), although the negative carry trade at all parts of the curve could deter yield-hunters. Historically, yen depreciation has boosted buying flows for JGBIs, although so have rising oil prices, so the current plummet of oil could explain why the linkers haven’t really moved.
To conclude, can Japanese assets still be seen as safe havens in risk-off environments? It will be interesting to see how the yen behaves during a macro shock that is not centralised in Asia and thus not directly linked to Japanese growth. In general, markets don’t seem to have fully written off the yen, as it currently seems to be reversing its initial losses. It is likely that it will retain its safe haven status from a macro level purely due to the fact that trading fluctuations compared to history are significantly narrower. There probably needs to be a significant recession on a microeconomic level (rather than a technical one) to feed through to investors selling out of JGBs as a place to park their cash. The currency situation is very fluid and it seems that the short term outlook does have some upside, whereby the yen will likely continue reverting back to pre-virus levels once the initial shock of the outbreak ebbs. Even if the epidemic gets significantly worse, the yen could do well if pressure is taken off Asia as cases increase worldwide. If the risk-off sentiment continues, investors could also reach full allocation to USD/be deterred from buying treasuries when yields are at record lows. They may thus be forced to buy yen-denominated assets as an alternative haven, especially as it is now even cheaper on valuation, rather than add risk back into their portfolios. The bottom line: we think it might be slightly premature to stockpile food and only buy the dollar (or gold), as Japanese assets still have room to revert back to their traditional safe haven status.
Emerging market (EM) banks appear to be a defensive asset class – who’d have thought it? It certainly goes against everything we learned in the Great Financial Crisis (GFC). Surely banks are pro-cyclical beasts whose performance surges in times of economic plenty and struggles in more recessionary periods? In the world of Emerging Markets credit, however, things seem different. At least for senior bonds, much EM bank paper today behaves much as its developed market (DM) cousins did before the GFC, trading tight to other sectors due largely to assumptions of sovereign support. The key difference is that, while developed markets did indeed support their banks in 2009, the size of the sector relative to GDP meant that the cost was so high that the western world has vowed never to repeat the experience. Emerging Market banking sectors, by contrast, are generally smaller relative to GDP, are often state-owned and/or central to delivering government policy. While idiosyncratic stories will create exceptions to this rule, I generally agree that the propensity of sovereigns to protect banks is higher today in EM than in DM, which is one factor that explains the low-beta nature of the Financials component of our index. We must grasp this simple truth to avoid underperforming in a sector that accounts for around half of the face value of outstanding benchmark bonds in the EM universe.
The JP Morgan CEMBI BD index is one of the most widely-used indices for EM corporate bonds. It has grown tremendously over the past decade and now contains $2.4tn of hard-currency corporate paper. Financials make up 30% of the index, though the face value of outstanding financial paper is closer to 50% of the total if we exclude index country weightings. State-owned banks make up 57% of total financial bonds. Looking across the regions, Asia accounts for 37% of the CEMBI, with LatAm at 28% and the Middle East at 17%. The CEMBI is a relatively high-quality index 57% of the index is Investment Grade, with just 43% of bonds in the High Yield category.
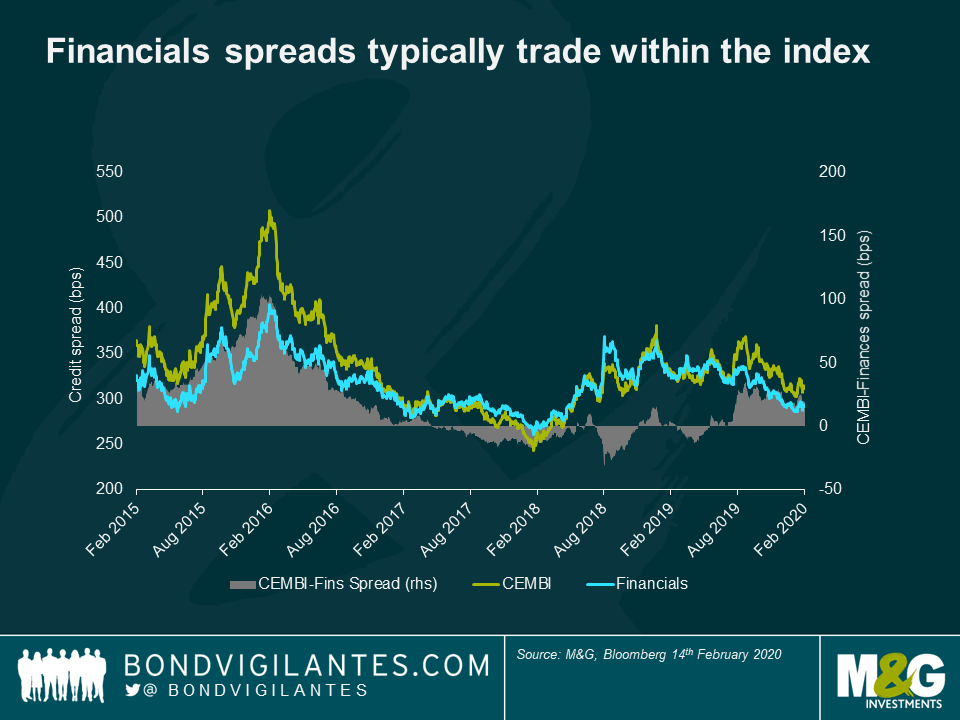
The Financials part of the CEMBI is a low-beta play. However, there are two important caveats: banks whose sovereign is distressed typically underperform that sovereign considerably, while subordinated debt is far more volatile than senior. I believe that investing in positive sovereign stories and avoiding sovereign distress scenarios is the primary consideration. The chart below makes this point quite nicely. Over the past five years, Financials have generally traded tighter than the EM corporate bonds index (CEMBI). The most pronounced risk-off period was the oil sell-off from summer 2015 to 1Q16, where banks performed significantly less badly than the overall corporate or sovereign indices. They also underperformed in the subsequent rally in 2016-17.
The next risk-off period began in February 2018 and lasted about a year. In this instance, Financials traded more in line with the index because the generic risk-off environment (driven by the emergence of the US-China trade war) was complemented by the financial crisis in Turkey. Turkish banks are the third-largest financial debt issuers in the index, meaning that their bonds’ underperformance had enough weight to move the whole index wider. This can be seen most clearly in the spike in Financial spreads in August 2018, which was caused by the Turkish Lira crisis. This sovereign event caused significant underperformance in Turkish bank bonds. As the crisis faded, normal service was resumed, with Financials now trading tight to the index again following the rally in 2H19. It is notable that during the volatile period over the past couple of weeks, Financial spreads have hardly moved. We also observe that there have not been many periods over the past five years where Financials have traded wide to the index.
So what explains the generic defensiveness of an asset class whose constituents remain volatile in times of individual sovereign stress? A glance at the make-up of the universe goes some way to explaining why. The charts below show that, of the $323bn of financial bonds outstanding, $180bn is Asian, of which $148bn comes from China, Hong Kong, Korea and Singapore – all high-quality jurisdictions. Moreover, $137bn of this Asian paper is senior unsecured. A large proportion of financial debt, then, is senior and issued by investment grade entities. It is a high quality asset class in the context of its index.
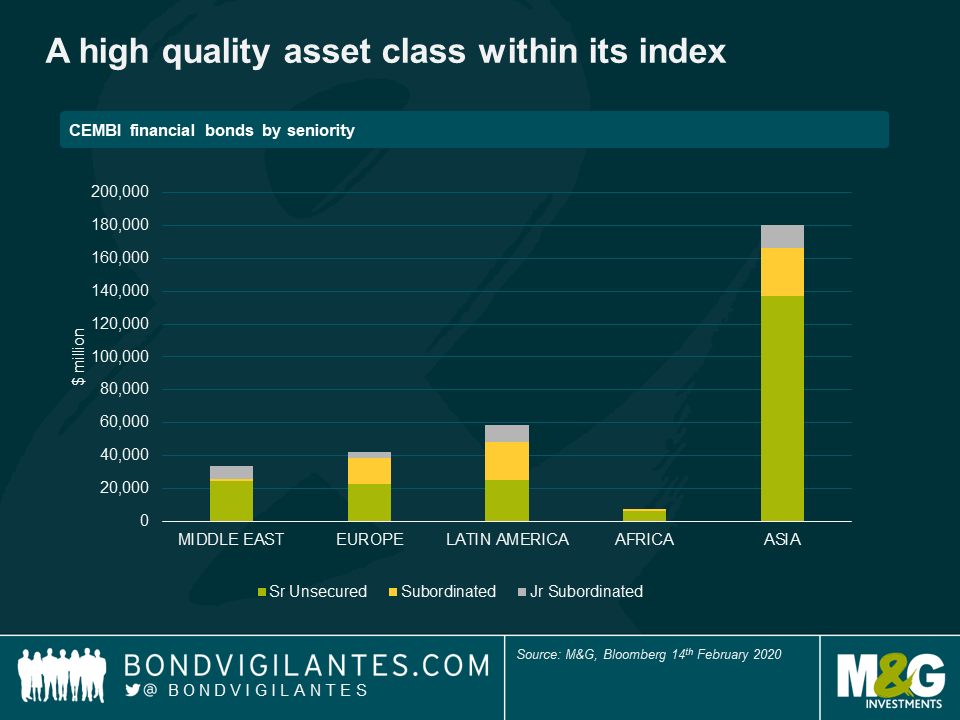
Let us now turn to the issue of assumptions of sovereign support. Developed market investors have got used to the idea that banks will (theoretically) not benefit from further government bail-outs in times of stress. Taxpayer money must never again be put at risk as it was in 2009, an idea that has gained credibility as Western banks have issued more and more bonds that can be bailed in – so-called Additional Tier 1 bonds (AT1s), Tier 2 bonds (T2s) and even non-preferred senior bonds. Such buffers are still under construction in most of EM, where regulatory advances have been varied. For instance, while most LatAm jurisdictions now comply fully with Basel III, Vietnam is just leaving the world of Basel I. This goes some way to explaining why around half the stock of bank bonds in Emerging Europe and LatAm is subordinated, which is necessary to fulfil bail-in requirements, while the Asian banks universe (56% of total financial bonds outstanding) is still dominated by senior unsecured paper (see Chart 1 above). As most financial issuers are either sovereign-owned or systemically important, it is unthinkable that governments will voluntarily allow senior bonds to default. This assumption underpins a huge amount of the investable universe, explaining why bank exposures are generically defensive.
There are two caveats to this – sovereign stress and subordinated debt. These make sense, since sovereign support must be questioned if the sovereign is struggling (will it be able to help its banks?) or there is subordinated debt available that could be bailed in relatively uncontroversially (should the sovereign save these bonds?). The best recent example of sovereign stress causing volatility in bank bonds spreads in Turkey, whose currency crisis in August 2018 caused significant underperformance in otherwise strong banks. The chart below shows the TCZIRA (Ziraat Bank) 23s rising to a spread of 400bp over the sovereign from around 100bp beforehand, which equated to a cash price of 85.

Meanwhile Turkish bank subordinated debt fell to a cash price of around 55, even in the case of the strongest banks like AKBNK (Akbank). The greater volatility is justified because of additional fears of bail-in for subordinated debt. While I think there is greater resistance to bail-in of sub debt in EM than there is in the developed world (e.g. subordinated debt may not have conversion triggers, or very low ones, and in many cases there are a number of prescribed steps to be taken before bail-in is allowed, such as recapitalisation and/or liquidity assistance), it is nonetheless universally true that bank rescues globally have seen all subordinated debt sacrificed (a recent example in DM would be Portugal’s Banco Espirito Santo, while in EM we have Russia’s Otkritie).
We should add one important point here: when bail-in occurs, all subordinated debt tends to be wiped out, regardless of whether it is technically part of the bail-in regime or not. The Otkritie bonds in question were issued in 2012 before the advent of bail-in debt but were sacrificed nonetheless. This is an important point because “old style” (i.e. non-bail-in) bonds have tended to trade tight to “new style” (bail-in) bonds. To me, the risks of bail-in are identical, so I would avoid any subordinated debt that trades tight on this basis.
Unsurprisingly, Middle Eastern and Asian banks are the most defensive names, due to strong fundamentals and high ratings. I think that we are paid much better for taking AT1 risk in the Middle East than is the case in Asia (see chart), where defensively minded investors could consider looking at senior paper. Likewise, I do not believe that we are rewarded for venturing down the capital stack in LatAm banks, though I should stress that some subordinated and high-yield opportunities still exist in this area, particularly in Mexico. For those of a more bullish mindset who do not share my cautious view on Turkey, Emerging European sub debt offers a good pick-up over senior.
Or, better yet, bulls should just buy corporates in sovereigns they like. And that’s coming from a banks analyst.

We started 2019 with credit at levels we perceived to be pretty cheap. The run since then has been remarkable, with spreads today close to all-time lows. What should one be doing with credit risk at this point?
There are reasons to remain bullish on credit, and fully invested. First, we remain in a goldilocks economic environment for bonds, with low growth and low inflation. These economic climes tend to be the very ones in which credit, particularly investment grade credit, performs well. Likewise, fears of imminent recession appear to be declining in the US and UK, while in many other parts of the world economic growth continues relatively unthreatened. The onset of recession tends to see credit spreads widen.
In investment grade credit, investors are overpaid structurally in spread based on historical default rates, and this remains true today (see chart below). Demographics and other factors have combined to mean that the bond market is in rude health technically, with a continuous wall of cash still finding its way into fixed income. Central bankers, contrary to the expectations of many (including the writer), have started 2020 once again on the dovish front foot, with policymakers at the Fed, ECB and BoE all talking about how much capacity they have to stimulate from today’s starting point of ultra-low rates and large back books of QE.
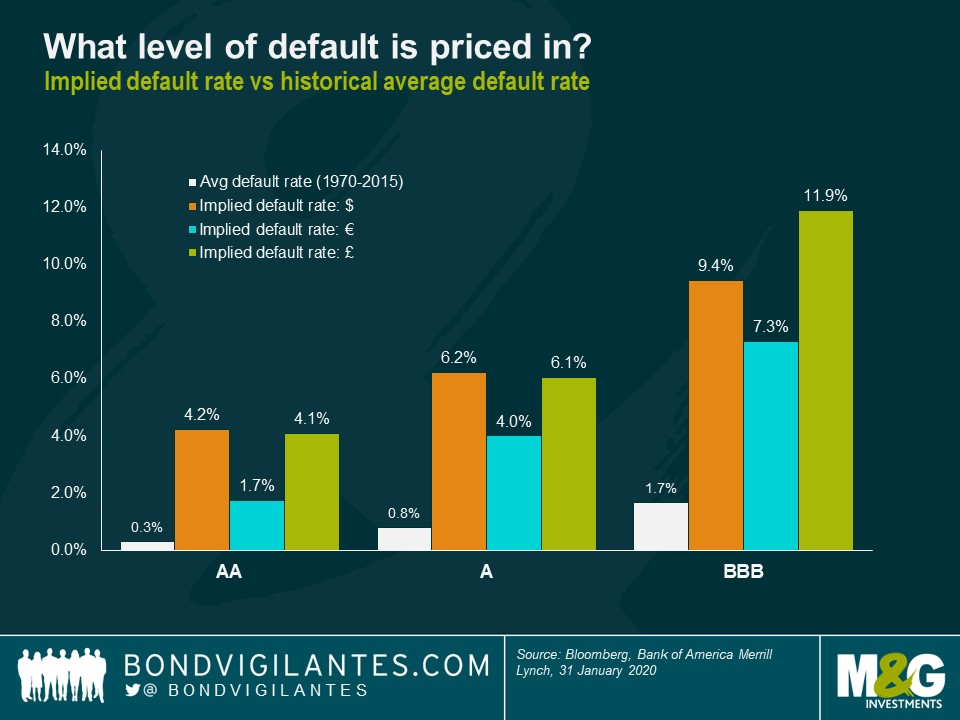
In terms of valuations, I guess one could say that spreads have been tighter, albeit only in very different circumstances many years ago and very briefly earlier this year and in Q1 2018. But the chart below shows where spreads are relative to their medians since 2006: Euro IG, GBP high quality (AA and A rated), and HY and IG CDS indices are all in the tightest 20% of their historical ranges. At the other end of things, the list of opportunities in which spreads are wider than their long-term medians has shrunk to US CCC HY, frontier market hard currency government bonds, and dollar denominated long dated BBBs. In the investment grade universe in which I am qualified to comment, we still see a number of attractive opportunities in long US BBB credit, even after the last few months of exceptional spread performance.

All in all, from this point I will be watching the credit market largely from the sidelines. I have watched spreads give up all their cheapness over the last 12 months and have sold bonds and names as I have thought they have become rich. Whilst I recognise the goldilocks economy we live in, and have reasonable confidence in the durability of this low inflation environment, I do not have as strong a view on growth on either side. There are reasons to be positive on the possibility that we see higher global growth, requiring policy tightening: we are seeing a bounce back in confidence after the UK election, and this may continue with any tailing off in the rate of spread of the coronavirus, the US election cycle, wage gains in much of the developed world, and an end to austerity (most presently in the UK). Then again, the virus’ spread has not yet reached plateau, Brexit uncertainty still looms large (and will do all year), ‘populist’ parties are still ascendant all over Europe, and central banks surely do not have huge flexibility to act on any of these growth-harming issues from here (which is presumably why they are all engaged in telling us how much room they have to loosen anyway).
To my mind, with spreads at these levels and economic conviction low, I am concerned about a problem primarily of valuation. The last time spreads were at these levels, we spent the rest of the year wishing we had sold more risk (2018) and we never got rising defaults or an economic recession. We just had a valuation rejection. Yes, investment grade credit spreads still overcompensate significantly relative to defaults, and with a wall of money coming into the market (another echo of 2018’s early weeks), we may well see spreads grind tighter for some months yet. But with the level of compensation on offer now so near all-time tights, and with so much uncertainty and noise around, I have said cheerio for now. There will surely be better opportunities to come.
With European media outlets focusing on the coronavirus and storm Ciara this week, only little attention was given to the Irish general election held on Saturday. Undeservedly so, I’d argue, considering that the election results mark a seismic shift in Irish politics. The surge of Sinn Féin, winning 24.5% of the first-preference vote, de facto ended the two-party dominance of Fine Gael (20.9%) and Fianna Fáil (22.2%) — a constant in Irish politics since the country gained independence nearly a hundred years ago.
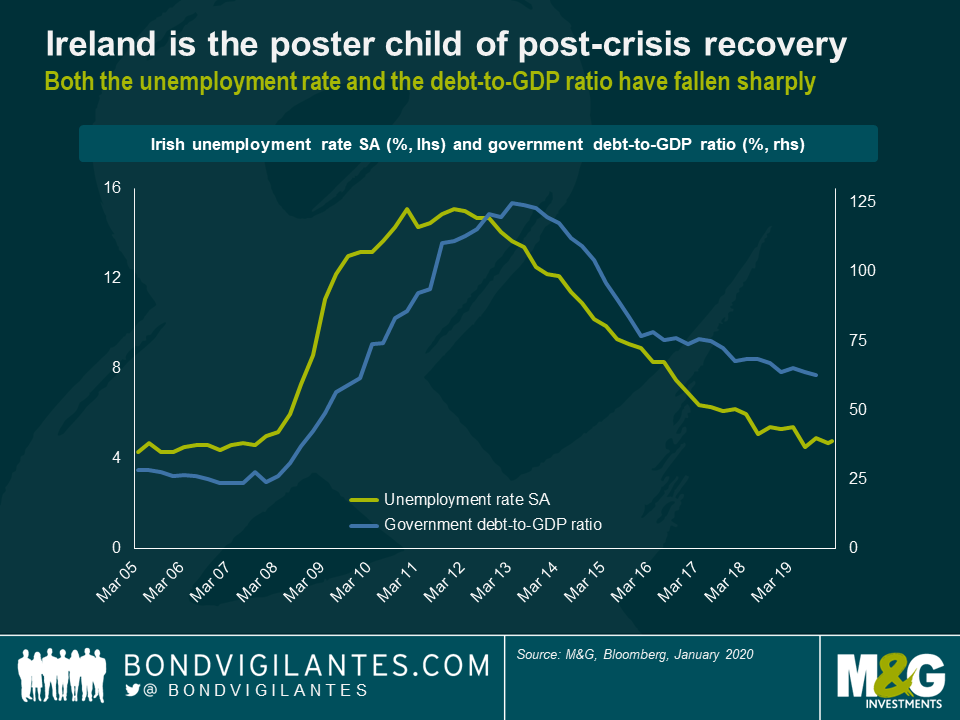
At first glance, the strong shift of votes towards Sinn Féin, who had positioned themselves as a left-wing anti-establishment party in the runup to the election, seems rather counterintuitive. Judging by most economic metrics, the recovery of Ireland after the European debt crisis has been a truly remarkable success story. For instance, the Irish unemployment rate, which had peaked at around 15% in 2021/12, has fallen by two thirds and is now below 5%. The government debt-to-GDP ratio has roughly halved from its 2013 peak (c. 125%) to currently c. 63%, which is in striking distance to the 60% debt limit specified in the Maastricht Treaty. Consequently, funding conditions have improved dramatically for Ireland. At the height of the debt crisis in 2011, the yield of 10yr Irish government bonds shot up to a whopping 14%, forcing Ireland to accept bailout loans. In contrast, the current Irish 10yr yield is c. -0.1% — pretty much in line with the French 10yr yield — which illustrates how profoundly market perceptions on Ireland have improved in recent years.
But why did Irish voters decide to shake up the political status quo when mainstream politics had helped produce such impressive results? Sinn Féin’s unwavering pursuit of an all-Ireland agenda sets them apart from their more moderate political rivals Fine Gael and Fianna Fáil. An exit poll taken at the Irish election on Saturday suggests that a significant percentage of the electorate (57%) are in support of referendums on Irish unity north and south of the border within the next five years — a key political goal of Sinn Féin.
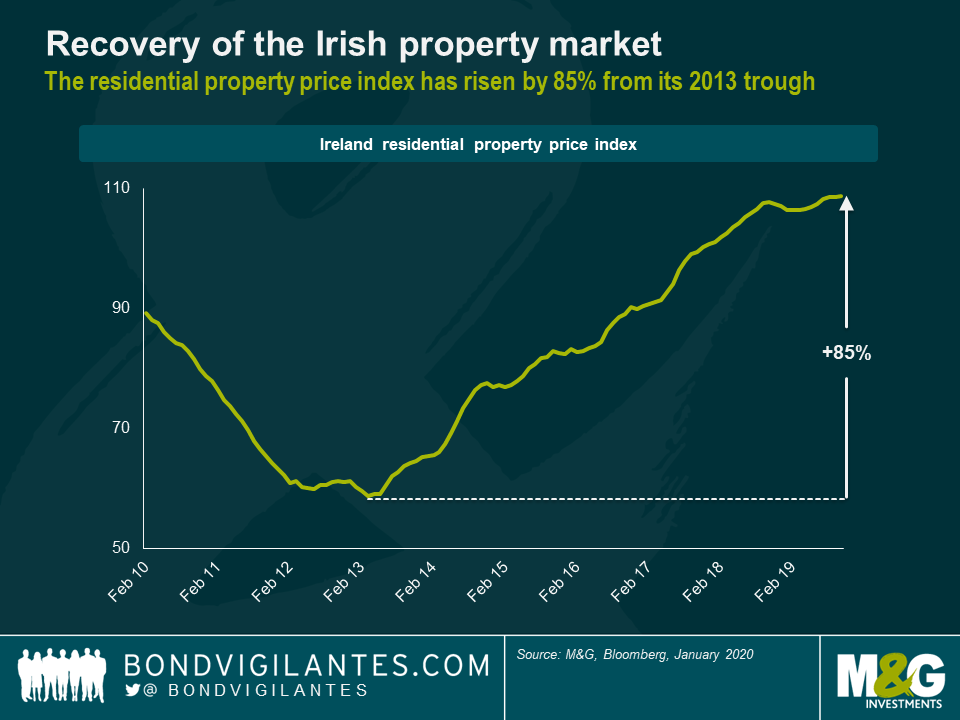
Although the question of Irish unity may have been a factor for some in the election, there were other factors cited as being more important that unity at play as well. When voters were asked in exit polls on Saturday what was most important to them in deciding how to vote, social issues — namely healthcare and housing — were topping the list. While the Irish economy as a whole has recovered superbly from the grave dislocations caused by the European debt crisis, it seems a significant proportion of the Irish people feel rather left behind. For instance, the Irish residential property price index has risen by c. 85% from its 2013 trough, which is great news for Irish home owners, of course. But, on the flipside, it has become a lot harder for young people and low-income families to get on the proverbial property ladder. Hence, Sinn Féin’s promise to build 100,000 new social and affordable homes, in addition to other left-wing policies, fell on sympathetic ears.
Since social issues seem to have played a crucial role the Irish election, it is worth comparing Ireland to other European countries with regards to key societal metrics. The Gini coefficient, for instance, is a statistical measure of dispersion and is typically applied to quantify the level of income inequality within a population. Lower values indicate lower levels of inequality, and vice versa. Interestingly, Ireland ranks close to the bottom of the Gini range within its European peer group. Sure, the usual suspects (e.g., Norway or the Netherlands) exhibit even lower Gini coefficients. But the level of income inequality in Ireland is significantly below EU average, lower than in Germany, Spain, Italy, Greece or the UK. The picture is slightly less benign for Ireland when it comes to the percentage of people at risk of poverty or social exclusion, another important social indicator. Ireland appears to be a halfway house between core European countries (Germany, France, Belgium, the Netherlands, etc.) with values below 20% and southern periphery countries, such as Spain and Italy, with values beyond 25%. That being said, it’s worth pointing out that Ireland’s poverty risk figure is still below EU average.

So, what lessons can we learn? Frankly, I think it is pretty remarkable that in a country like Ireland, which has been highly successful over many years based on most economic metrics, a left-wing anti-establishment party can swoop up nearly a quarter of votes in a general election. It serves as a stark reminder that even seemingly stable political landscapes can easily erode, when large parts of the population feel that they have been excluded from the spoils of economic growth. Even though Ireland’s Gini coefficient and poverty risk are not flashing red by any stretch of the imagination, social issues, such as housing or healthcare, were very much on people’s minds. These topics are all too familiar in most other European countries and we should thus expect anti-establishment movements challenging the status quo to gain political momentum elsewhere as well. And, just to be clear, within democratic systems these election results are a perfectly legitimate expression of the will of the people.
But there are certain risks attached, of course. When political constellations become more complex, it can become rather difficult to form stable governments. As a reminder, it took Germans half a year to forge a new government after the last federal election. This sluggishness, which affects consensus building and decision-making in fragmented parliament more broadly, can be costly especially when acute crises arise that demand an immediate response. For investors like ourselves, proper assessment of political risk becomes more relevant as election results get less predictable. We shouldn’t be lured into a false sense of security by long-standing political orders but factor in fragility and the expected market volatility that goes along with it.
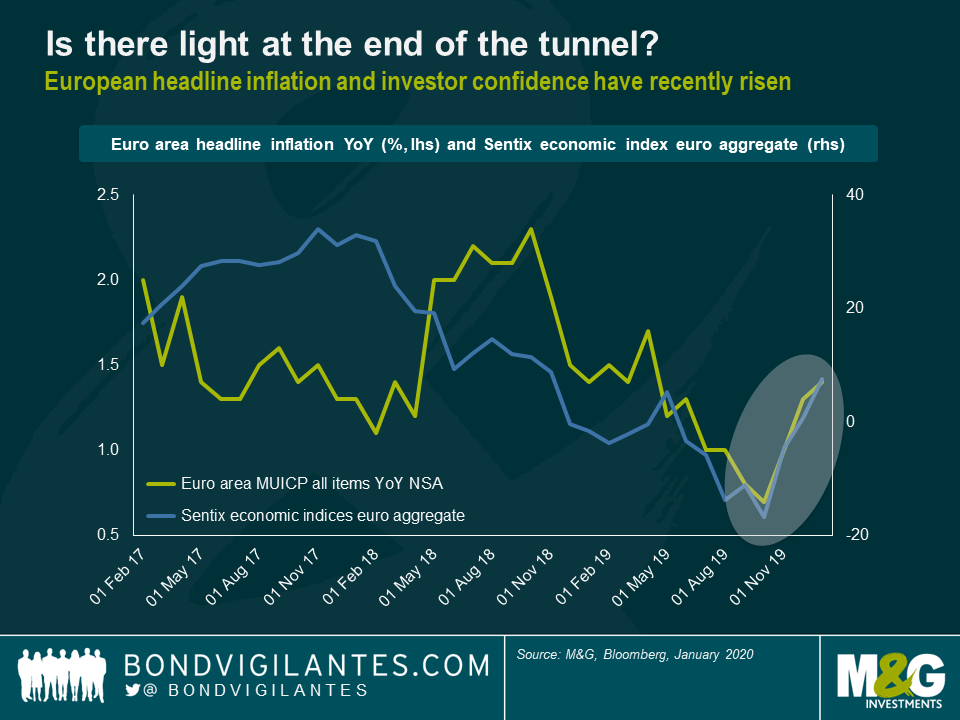
Lately a growing number of indicators have suggested that the European economy might be out of the woods, heading towards a more robust recovery. For instance, while European inflation remains significantly below the ECB’s inflation target of close to but below 2%, it is worth highlighting that the year-on-year headline rate has in fact doubled from 0.7% in October 2019 to 1.4% in January 2020. Even the manufacturing PMI for the euro area, one of the biggest causes of worry to European investors throughout 2018, seems to have bottomed out in September 2019 and is now back on a mild upward trajectory. Sentiment amongst European investors has also improved considerably. Take, for example, the Sentix economic index for the euro area — a gauge for investor confidence — which has sharply rebounded from its October 2019 low-point, climbing in January 2020 to its highest level since November 2018.
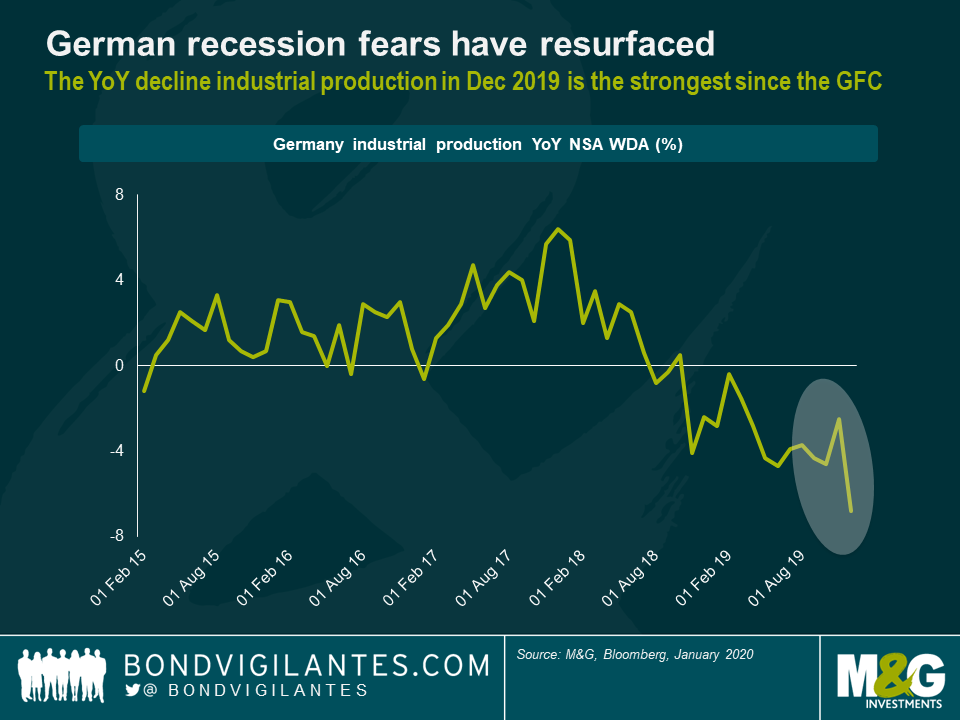
The key question is, of course, whether Europe has genuinely turned the corner or not. I’d argue that it is way too early to give the all-clear signal. First of all, despite the recent green shoots, economic growth in Europe remains anaemic and fragile. In fact, Q4 2019 marks with only 0.1% real GDP growth the weakest quarter in the euro area since Q1 2013. The economies of France (-0.1%) and Italy (-0.3%) outright contracted. In addition, recession risks around Germany have resurfaced with a vengeance. On a year-on-year basis, German industrial production dropped by 6.8% in December 2019, the strongest decline since the global financial crisis. So, things may well get worse before they get better in Europe.
Furthermore, there are several material tail risks lingering in the background that could further darken the outlook for the euro area.
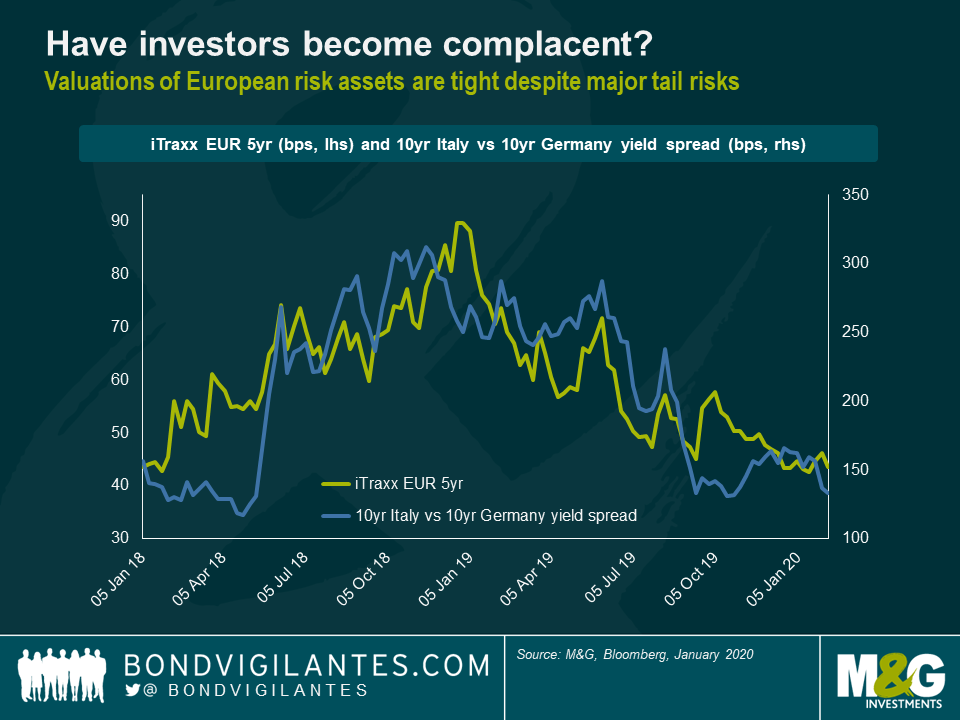
In light of these risks — and considering the persistently weak growth data—I find the valuations of European risk assets rather astonishing. At current levels there is hardly any margin for error left. For example, iTraxx EUR 5yr, a bellwether of the European investment grade credit market, is currently trading only at around 44 basis points (bps) and the yield of 10yr Italian government bonds is a measly 130 bps above the 10yr Bund yield. Essentially, there is hardly any margin for error left as we are (almost) back to market levels last seen at the beginning of 2018. And this is what I find surprising, because back then the mood in markets was distinctly more upbeat than today, borderline euphoric. The prevailing narrative was all about global synchronised growth and European recovery. Political risks in Europe were hardly talked about. In short, market participants became complacent.
We all know what happened next in 2018. Trade wars suddenly escalated, anti-establishment parties Lega and 5 Stars chalked up large gains in the Italian election in March 2018 and global economic data took a nosedive. As a result, investor sentiment soured and markets rapidly entered a prolonged risk-off phase causing risk assets across the board to produce deeply negative annual returns. I am not suggesting that history has to repeat itself. But I can’t help feeling that markets have again gotten ahead of themselves and complacency is reigning supreme. Sure, there is ample support from central banks, from the ECB in particular, providing favourable technicals and thus propping up asset prices. But just as a reminder, the ECB was buying assets to the tune of €30 billion a month from January to September 2018 — 50% more than at the moment — and markets still sold off in a meaningful manner. I therefore believe a rather cautious stance towards European risk assets is warranted. Reducing market risk exposure and trading up in credit quality seem prudent measures to me at this point.


Sign up to the Bond Vigilantes mailing list to ensure you never miss a great article from our expert Bloggers. We will email all new articles to your inbox, meaning you can stay on top of the world of Bonds.
I confirm that I would like to receive information about Bond Vigilantes and products and services from M&G Securities Limited.
We will use the email address and personal data you have shared with us to send you this information. For existing customers, submitting your contact details and requesting to receive this information from us, will replace any earlier choices you have made in respect of marketing information.
You can unsubscribe from marketing at any time, at which point we will not send any further marketing information to you, by selecting the unsubscribe link in all communications.