


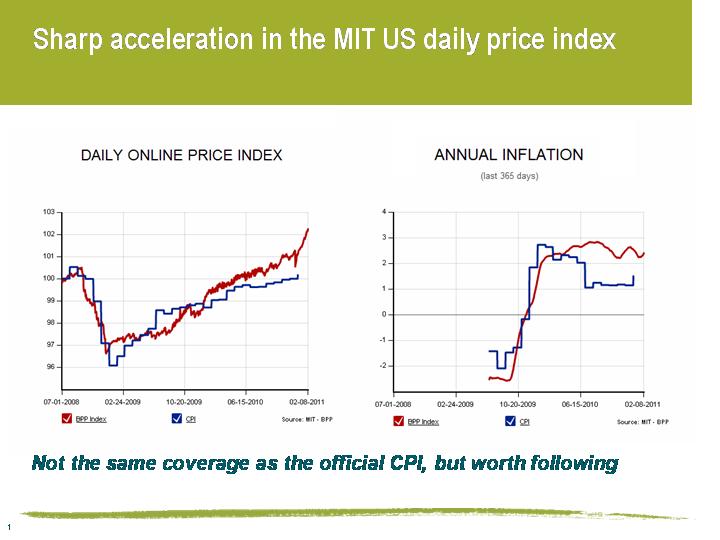
The Billion Prices Project – a daily estimate of inflation
I came across this daily CPI estimate in a Bloomberg article this morning. Called the Billion Prices Project (BPP), it’s run by two MIT academics and aggregates 5 million online prices on a daily basis. Whilst the basket of goods is always going to be somewhat different to that used in the official data, the trends that the BPP model picks up can give a real-time guide to the direction of inflation. For example in 2008, following the collapse of Lehman, the BPP started showing price falls within a week – the official US CPI data didn’t reflect that prices were falling for another 2 months.
The chart below shows the latest US readings – it’s perhaps worrying to note a significant acceleration in prices in recent weeks – and the year on year numbers are showing 2.25% inflation on the BPP measure compared with 1.5% on the official Bureau of Labor Statistics numbers.
Sadly there is no UK model at the moment (it’s being updated) – it would be very interesting to get a feeling for the pass through rates for January’s VAT hike – did stores pre-hike VAT in December, wait until the 4th January, or most worrying, perhaps they have waited until the end of the sales and are implementing the hikes now?
The value of investments will fluctuate, which will cause prices to fall as well as rise and you may not get back the original amount you invested. Past performance is not a guide to future performance.
19 years of comment
Discover historical blogs from our extensive archive with our Blast from the past feature. View the most popular blogs posted this month - 5, 10 or 15 years ago!


Bond Vigilantes
Get Bond Vigilantes updates straight to your inbox