Markets
Gold prices: beyond inflation and real yields
By Robert Burrows
25 April 2024

The ratings agencies are at it again. Yesterday, S&P (the largest credit ratings agency) announced that it has placed Moody’s (its biggest competitor) on credit watch negative. S&P cited one of the reasons as being the computer bug that is believed to have resulted in Moody’s accidentally giving AAA ratings to some Constant Proportion Debt Obligations (CPDOs), a form of structured credit. According to the Financial Times, Moody’s may have intended to rank the CPDOs as much as four notches lower.
Hang on a second. S&P gave the very same CPDOs an AAA rating, and that was without any computer bugs. So one agency is concerned another agency has failed in not coming to the same conclusion as itself. It would be a laughing matter, if not for the fact that investors and regulators rely on these agencies so heavily. It takes me back to February last year – see Stefan’s article here on the Icelandic debacle.
A great quote today from Northern Rock’s chairman, as reported on Bloomberg : “If house price were to decline 5, 10 or 15 percent, that would seriously impede fulfilling the [recovery] plan”
UK Housing Minister Caroline Flint’s Cabinet briefing notes as at 13th May, as shown here : “Given present trends, [houses] will clearly show sizeable falls in prices later this year – at best down 5 per cent -10 per cent year on year”
If a UK government bailout can’t save Northern Rock, then I’m not quite sure what can.
Figures announced on Friday showed that Japan’s economy grew at a headline-grabbing annualised rate of 3.3% in the first quarter of this year, way ahead of expectations of 2.5%. Commentators have focused on strong export growth, although one reason for the surprise may be because the Japanese don’t adjust their growth figures for leap years. The Japanese aren’t the only ones not to adjust for leap years – a quick internet search shows that as at 2004, New Zealand, Mexico, Ireland, Denmark, Portugal and Switzerland didn’t either.
Not adjusting for leap years seems a bit of an error. In a non leap year, Q1 has 90 days. In a leap year it has 91 days, so Q1 in a leap year is 1.1% longer. That’s 1.1% more time for consumers to spend money. In fact, with the exception of people getting paid by the hour or by the day, the world worked for free on February 29th. Not bad for companies’ profit margins.
Which leads onto quite an important point. Q1 corporate earnings have on the whole exceeded expectations (which is usually the case), but did the forecasters take account of the leap year in their various earnings models? Maybe some did, but it’s likely that many didn’t. If the leap year effect wasn’t incorporated into forecasts, then Q2 earnings estimates may be over-optimistic (reflecting the earnings surprise from Q1). This may lead to disappointment when Q2 earnings are announced (all other things being equal, of course).
What is the real level of food price inflation? Are the official numbers released by the Office of National Statistics (ONS) understated? Well the ONS is under attack from both sides. On one front there’s J Sainsbury’s CEO, Justin King, who yesterday claimed that the official food inflation annual number of 6.6% is way too high. Real food inflation, he said, is just 2%. The discrepancy comes because the ONS doesn’t recognise the price cuts that customers achieve through supermarket BOGOF (Buy One Get One Free) deals and other voucher based promotions – the ONS simply compares the shelf price of a tin of beans from month to month. Tesco has also said that food price inflation is not as high as the headlines proclaim.
On the other front is the Daily Mail. The Mail has calculated its own food inflation index, and finds that inflation in its grocery basket is running at 15.5% per year. The 74 comments from readers (our world record on this blog is 3) are almost unanimous that this survey reflects their own experiences. “The Mail’s Cost of Living Index is a brilliant and simple idea. When can we expect to see the government response to this and give an explanation why they still want to use the CPI instead?” (Derek from Hull). And this is a problem – for what its worth I think that the ONS data is pretty robust in comparison with the Mail’s snapshot of 40 odd items (you can read about the ONS food basket here) – but if people start believing that inflation is back, then it becomes much harder to fight it.
So bond fund managers find themselves in a difficult situation. There is no greater enemy to the fixed interest investor than inflation – what if we’re wrong in our view that a period of below trend growth coupled with the credit crunch will lead to disinflationary pressures reasserting themselves from 2009 onwards? So what’s our danger signal? We have to keep a close eye on wage growth. Workers’ real incomes have been stagnant now for four years, as Mervyn King discussed in the Q&A following yesterday’s Inflation Report briefing. Salaries haven’t kept track with productivity growth and inflation. As long as this remains the case, and earnings growth remains below 4.5% (it’s currently 4%), then it’s difficult to see how the UK can enter into an inflationary spiral. With profit growth deteriorating, and unemployment rising, why would employers give inflation busting wage hikes? And if wages hikes aren’t forthcoming, then higher food (and energy) costs are just going to hit incomes harder. In an economy where the savings rate is zero, and where credit is hard to come by, there aren’t many options. Consumption will have to fall – and consumption is 2/3rds of UK GDP. We all thought it would be housing that would tip the UK into recession – but could it be French bread (+44%), tea bags (+67%) and butter (+62%)?
It was announced yesterday that UK consumer prices climbed 3.0% in April from a year earlier, ahead of expectations of 2.6% and a big jump from 2.5% recorded in March. The Bank of England today said that the inflation rate is likely to breach the 3% maximum limit for “several quarters” and that there could be a “number” of letters to the Chancellor explaining why inflation has breached this 3% upper limit. Gilts have sold off aggressively – 10 year gilt yields were at 4.6% immediately before the announcement, and broke above 4.8% today. That equates to a drop in price of about 1.7% in just two days.
Rising inflationary pressure has meant that we’ve had a growing number of queries from investors for our view on index-linked gilts. Index-linked gilts have significantly outperformed fixed interest gilts recently. Over the year up to the end of last week, the median return for the IMA Index-Linked Gilt sector was +11.7%, while the median return for the IMA UK Gilt sector was 5.0%. This outperformance is largely due to building inflationary pressure, but is also in no small part due to ongoing demand from pension fund managers, who seek to match long term assets with their long term liabilities.
Following this index-linked rally, what inflation rate is the market pricing in? Well we can see what the market is expecting by taking the yield on a fixed interest gilt, and then subtracting the yield on an index-linked gilt of the same maturity. This gives what is called the breakeven inflation rate.
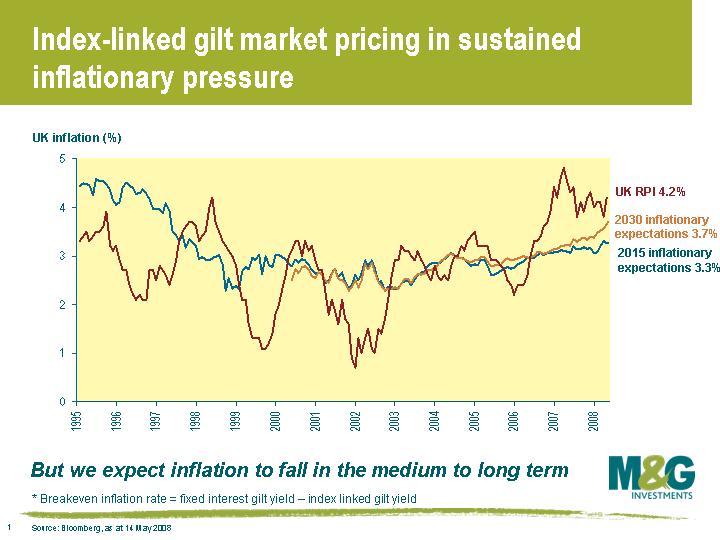
This chart shows how both RPI and the market’s inflationary expectations have changed over time (note that index-linked gilt returns are still linked to RPI, rather than CPI). The red line shows that RPI was 4.2% in April, and has fallen back from the 4.8% hit in March last year (which was the highest recording since July 1991). However even though RPI has fallen a little, inflationary expectations have steadily risen since the beginning of 2003. Inflationary expectations over the next decade are the highest since 1997, when the Bank of England was made independent. Longer term expectations are higher still (though this breakeven inflation rate is being distorted a little by the pension funds).
So, are index-linked gilts attractive? If you believe that RPI will remain at current levels, or perhaps continue to rise over the long term, then yes – they look more attractive than fixed interest gilts. But if you share our view that disinflationary pressures will come to the fore over the next couple of years (see Jim’s comment here), and that RPI will fall back towards trend level (or lower), then fixed interest gilts look more attractive.
Scylla & Charybdis were two sea monsters living on opposite sides of the Strait of Messina posing a very serious threat to passing sailors of the day. Avoiding one typically meant taking great risk passing too closely to the other. The phrase, believed to be the progenitor of the phrase ‘between a rock and a hard place’ is where the European Central Bank finds itself today; presiding over increasingly weak economic data and stubbornly high inflation readings.
Unlike the Fed whose psyche bears the scars of the Great Depression (and thus likely to risk inflation in favour of growth) the ECB remains eternally cognisant of the hyper inflationary years of the Weimar Republic. The ECB yesterday left its benchmark re-financing rate, as expected, at 4% and continue to focus, as per their mandate on the “upside risk to price stability.” However recent economic data has suggested the economy has begun to cool. Manufacturing ex-Germany continues to slow, whilst exports continue to be hampered by the strength of the Euro. The housing correction underway in countries like Spain, Italy & Ireland is undermining consumer confidence and consumption is hampered by real disposable income hits from surging energy and food prices.
Ultimately slower European and global growth should lead to lower European inflationary expectations enabling the ECB to respond with interest rate cuts, though perhaps not for some time yet. In fact if you go back a few years to 2003 you can find evidence of the ECB willing to cut rates despite inflation above its 2% comfort zone.
As an aside risk assets have been enjoying something of a renaissance since the Fed organised the bailout of Bear Stearns through JP Morgan in March. The Merrill Lynch European High Yield Constrained Index returned 5.31% during the month of April, recovering most of the losses it saw through the first quarter of the year. This week, however, feels somewhat range bound. In a report from earlier this week, Goldman Sachs used the analogy of the corporate bond markets heading for the ‘horse latitudes’- pretty apt I thought, once I’d looked it up!
Richard is talking through recent goings on in fixed income markets on Monday May 12th at 10am. If you are interested then you can register here.
And for something completely unrelated, this clip reappeared in my inbox recently. If you missed it the first time around, it’s from an England vs Germany legends football match that took place in 2006. Watch the new Mayor of London attempt to dispossess former German international footballer Maurizio Gaudino. Germany beat England 4-2.
Economic statistics go in and out of fashion like mullets and hoola-hoops. When I started in bond markets the obsession was with the monthly government borrowing number, the PSBR. This was at the time that the Conservative government was borrowing heavily in the middle of the last UK recession – the current numbers are just as high, but now the market doesn’t bat an eyelid. When Richard Woolnough started the market would eagerly await the publication of the shipping forecast, bringing news of the tides and winds, and the progress of the ships bearing spices and `baccy from the far Indies (actually to be fair it was the monthly Trade Deficit number). Nowadays, despite a fleeting interest in the CPI numbers, the focus of the markets is on the US employment data, known as the Non-Farm Payrolls, released on the first Friday of every month.
After four full years of positive monthly payrolls growth, 2008 has so far seen four negative prints. So far we’ve seen nothing like the -300,000 per month job loss prints that we saw in the tech recession of 2001, but it’s clear that we are seeing rising US unemployment. However, last Friday’s print at -20,000 was better than the markets had feared (-80,000 was forecast) and risky assets (equities, high yield, credit) rallied on the hope that things might be better in the economy than anticipated. BUT – here’s the problem. The reported number from the Bureau of Labour Statistics (BLS) is pretty much made up.
There’s an adjustment put in there to estimate new businesses that might have been set up (or indeed to have folded) since the BLS last did a proper survey. It’s called the birth/death model. In the case of April’s survey, the BLS added an additional 267,000 jobs to the US economy on the basis of their model – they implied that lots of jobs would have been created through new construction companies for example. In other words, without what they call their “birth/death” adjustment, the US economy would have lost a massive 287,000 jobs rather than the 20,000 reported loss. The BLS themselves realise that this guestimation is likely to be wrong, and we can expect subsequent revisions when better data is produced. Our economist, Steven Andrew, and I visited the Fed this time last year, and discussed the use of the birth/death model with them – the Fed official stated that people who look at the birth/death model in any detail are – to quote – “hobgoblins”. And perhaps we are, but I’m happy to take a bet that given the collapsing US housing market and stagnant commercial property market, new construction companies were not springing up throughout the US in April this year, and that come the revisions, things will look a bit bleaker than the statisticians implied.


Sign up to the Bond Vigilantes mailing list to ensure you never miss a great article from our expert Bloggers. We will email all new articles to your inbox, meaning you can stay on top of the world of Bonds.
I confirm that I would like to receive information about Bond Vigilantes and products and services from M&G Securities Limited.
We will use the email address and personal data you have shared with us to send you this information. For existing customers, submitting your contact details and requesting to receive this information from us, will replace any earlier choices you have made in respect of marketing information.
You can unsubscribe from marketing at any time, at which point we will not send any further marketing information to you, by selecting the unsubscribe link in all communications.