The ECB finally realised it had no choice and fired its bazooka in December. The impact has been huge. Two year Italian government bond yields have more than halved from the high of 7.5% seen at the end of November. Many hedge funds who were betting on Italian government bonds selling off have either changed views and taken profits or have been stopped out of their positions as the market has gone against them. Real money investors have been returning to the Eurozone sovereign bond market after a long absence. Just as Italian bank bond yields spiralled upwards with the Italian sovereign, so they have plummeted down too, and banks have been able to issue bonds to the market again this year (albeit almost solely covered bonds or senior bonds so far). The chart below highlights just how much Italy’s borrowing costs have fallen.
Those who doubt the sustainability of the ECB’s policies are entirely correct when they argue that hurling liquidity at the Eurozone debt crisis does nothing to solve the structural problems at the heart of the Eurozone. If you put lipstick on a zombie sovereign or zombie bank, it’s still a zombie. The potentially terminal problems of huge competitiveness divergence between countries (ie current account imbalances) are still to be resolved. One answer is total fiscal union, which requires Northern Europe to take on Southern Europe’s debts and Southern Europe to let Northern Europe tell it what to do (exceptionally unlikely). Alternatively, it requires Germany and the Netherlands to be willing to run consistently higher inflation rates than the rest of Europe (also unlikely). As Milton Friedman succinctly pointed out in 1999 (see Q&A session), “the various countries in the euro are not a natural currency trading group. They are not a currency area. There is very little mobility of people among the countries. They have extensive controls and regulations and rules, and so they need some kind of an adjustment mechanism to adjust to asynchronous shocks—and the floating exchange rate gave them one. They have no mechanism now”.
But just because the ECB’s policy response hasn’t addressed the underlying problems, it doesn’t mean the response is immaterial. Quite the opposite. We know from 2009 how powerful the effect on markets can be when central banks fully deploy their balance sheets. In light of this, the rally in the riskier fixed income assets that we’ve seen of late arguably has further to go, and in the past few weeks I’ve even bought Italian government bonds for the first time ever.
The flip side is that the current yield levels of core government bonds is a concern, and duration appears less attractive. In May last year, government bond yields were more than 1% higher than they are today and yield curves were much steeper. It was expensive to be short duration at the time, as argued here. The situation has changed a bit since then, presumably because of Eurozone stress and perhaps also because of China. If Europe is no longer in a downward spiral (indeed the crucial Eurozone PMI data released this morning suggests there has been a bounce in economic activity in January) then government bonds really do look vulnerable.
Last week conventional gilts of all maturities briefly traded – but failed to close – below the 3% level. The continuation of the gilt bull market has now reached an important psychological level, with the ascendant bulls seeing a 3% yield as a barrier to be overcome before the yield continues to grind lower, while the gilt bears are hoping that the 3% yield barrier (the 3 percent handle) will not be breached. We discussed this change of big figure yield (change of handle) in a previous blog where the four handle was lost. Sadly the Two Ronnies didn’t write a 3 handle sketch, but if they had we imagine a 21st century version could have gone something like the below.
In a hardware shop. Ronnie Corbett is behind the counter, wearing a warehouse jacket. He has just finished serving a customer.
CORBETT <muttering>: There you are. Mind how you go.
(Ronnie Barker enters the shop, wearing a scruffy tank-top and beanie)
BARKER: Three Candles!
CORBETT: Three Candles?
BARKER: Three Candles.
(Ronnie Corbett makes for a box, and gets out three candles. He places them on the counter)
BARKER: No, three candles!
CORBETT <confused>: Well there you are, three candles!
BARKER: No, three kindles! kindles for reading!
(Ronnie Corbett puts the candles away, and goes to get 3 kindles. He places it onto the counter)
CORBETT <muttering>: Candles. Thought you said “three candles!’ (more clearly) Next?
BARKER: Got any pods?
CORBETT: Pods. What kind of pods? iPods, pea pods?
BARKER: iPods,
CORBETT: How many?
BARKER: Three
CORBETT: black, red, green, purple, pink, orange, rainbow, mauve, tangerine, white
BARKER: White
CORBETT: White iPods
BARKER: 3 iPods white
(Ronnie Corbett gets out a box’s of iPods, and places them on the counter)
CORBETT (pulling out three different sized iPods): What size?
BARKER <looks puzzled>
CORBETT: What size 16gb, 32gb, 64gb? what size?
BARKER: Six foot six
CORBETT; Six foot six!
BARKER: High pods for working in, high white pods
CORBETT <muttering>: It’s pre-fabricated high workstation pods, we call them, in the trade. Work pods!
(He puts the box away, struggles with three huge boxes, and places them on the counter , then puts the iPod box away)
BARKER: Pads
CORBETT: You’re ‘avin’ me on, ain’t ya, yer ‘avin’ me on?
BARKER: I’m not!
CORBETT iPads , you mean iPads
BARKER: Pads
CORBETT <getting really fed up>: Padded soft eye pads, or skinny hard iPads?
BARKER: Soft eye pads
CORBETT; <double checking> Two or three!
BARKER; <looks down quickly quizzically> Two.
CORBETT <muttering, as he goes down the shop>: Eye pads. See any eye pads? (He sees a box , and picks it up) Tidy up in ‘ere.
(He puts the box down on the counter, and empties it aggressively)
BARKER: (picks them up, and looks at them, puts them back on the counter). Bit small.
CORBETT; Bit small, bit small, what do you men a bit small!
BARKER: Soft high pads fer me knees! For when I’m gardening!
CORBETT <almost at breaking point>: You are ‘avin’ me on, you are definitely ‘avin’ me on!
BARKER <not taking much notice of Corbett’s mood>: I’m not!
CORBETT: (He takes back the eye pads , and gets a pair of high gardening knee pads, and places them on the counter) Go on give it your best shot!
BARKER: Washers!
CORBETT <really close to breaking point>: What? Dishwashers, floor washers, car washers, windscreen washers, back scrubbers, lavatory cleaners? Floor washers?
BARKER: ‘Alf inch washers!
CORBETT: Oh, tap washers, tap washers? <He finally breaks, and makes to confiscate his list> Look, I’ve had just about enough of this, give us that list. <He mutters> I’ll get it all myself! (Reading through the list) What’s this? What’s that? Oh that does it! That just about does it! I have just about had it! <calling through to the back> Mr. Jones! You come out and serve this customer please, I have just about had enough of ‘im. He wants to buy a gilt yielding more than three percent!
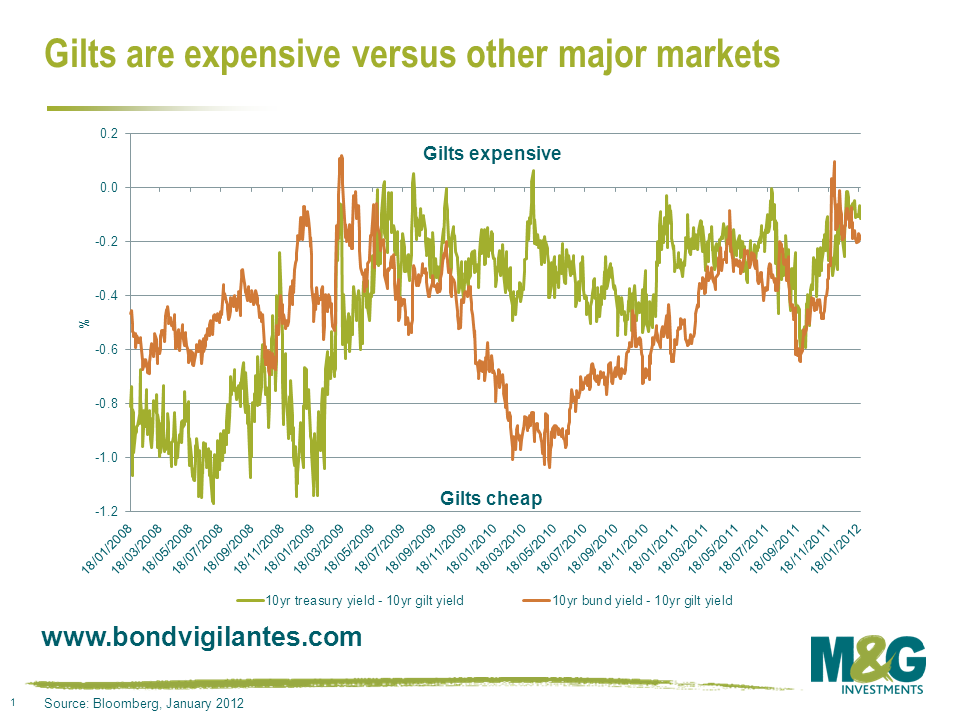
Looking at the gilt market on an absolute yield basis, 3% is a crucial level. The question is, which way will gilt yields go? As fund managers we also think in relative terms when we ask ourselves a question like this. Looking at gilts versus other large high quality government bond issuers like the US and Germany, gilts look expensive.
They are also historically expensive versus current inflation and equity valuations. Therefore from a fundamental basis gilts look relatively dear which will satisfy the bears, while the bulls will point to further quantitative easing as the one reason why gilts can continue to rally from here.
On Friday we had a Dumb and Dumber moment in the office when a colleague for a few seconds thought that Australia had lost its AAA rating. The error was quickly realised (it was Austria that was downgraded) and Australia kept its AAA rating across the board that it has had with Moody’s and S&P since 2002 and 2003 respectively (although Fitch only upgraded Australia’s foreign currency rating to AAA in November 2011).
There were however some disturbing figures that came out of Australia on Friday – foreign investors bought a record AUD$23.9bn (=US$23.9bn) of Australian government bonds in Q3 2011, resulting in foreign ownership soaring to 80.4%, which is also a record. Judging by the price action on Aussie bonds and the Aussie Dollar in Q4, foreign ownership is likely to have jumped further in Q4. For us, this is worrying as heavy foreign ownership of government bonds can be very dangerous, particularly when this is combined with a country running a current account deficit (i.e. the country is reliant on capital inflows from abroad). Ireland and Portugal, which saw similar levels of foreign ownership before the crisis hit, are great (or poor?) examples of how this combination can leave a country’s exchange rate and solvency very exposed if the country hits a crisis.
Of course, Australia does have some big advantages over the Ireland of 2006. Australia has the ability to print its own currency and set its own interest rates (just ask the Irish how much they would like this power right now). Secondly, despite the massive expansion in credit and house prices that Australia has experienced over the last two decades, Ireland’s was comparatively greater. The run up in Australian house prices since 1990 is reflective of a massive increase in household debt (fuelled by the Aussie banks) and is not the product of more fundamental factors such as population changes or rental income equivalents. Additionally, there is likely to have been a change in demand, as years of rising prices that have made the Australian housing market one of the most expensive markets in the world on price-to-income and price-to-rent ratios (as The Economist pointed out last November) have probably changed household formation dynamics.
Australia’s current account deficit is currently only 1.5% of GDP which is far from alarming. However, on a cumulative basis, Australia has averaged a deficit of 4.8% since the beginning of 2003 which should have investors’ alarm bells ringing. The credit bubble in Australia (credit bubbles usually accompany large credit account deficits) has never really popped (we wrote about Aussie housing market here). The end of a bubble is always difficult to predict and identifying the trigger for such an unwind is similarly fraught with difficulty. Given that markets are extremely sensitive to the potential for asset price bubbles bursting and with the effects of such events still in mind, the Australian housing data are key to AUD maintaining its lofty levels. Something else that is worrisome is that the Australian banking sector dwarfs the size of Australia’s economy at 3.5 times nominal GDP (Ireland’s banking sector was 4.4 times GDP in 2008). The key challenge facing the Australian banking sector is its exposure to the housing market, with about two thirds of assets on the banks books consisting of housing loans.
The following chart shows the AUD/USD currency rate versus foreign ownership of Australian government bonds going back to 1989. It appears that there is a positive correlation which makes a lot of sense – obviously if foreigners are buying government bonds in large size then the currency should strengthen. In fact, we think this is precisely why the British Pound has been surprisingly strong over the last six to nine months as the UK government is one of the few AAA sovereigns still standing and has been the beneficiary of a huge safe haven bid. Of course, if this safe haven status gets called into question, which could easily happen in both Australia and the UK, then capital outflows would leave their respective currencies extremely vulnerable. On this front the UK’s current account deficit of 4% of GDP recorded in Q3 2011 wasn’t exactly encouraging – since 1955, it has only been worse in Q2 1974 (which preceded sterling’s 1975-76 collapse and IMF bailout) and from Q4 1988 to Q2 1990 (which was a symptom of the UK’s housing bubble and preceded the pound’s sharp fall after it was booted out of ERM in 1992)
The obvious catalyst for the popping of the great Aussie bubble is China, as that’s essentially all that matters if you’re taking a view on Australia’s economy. Almost 70% of Western Australian and Queensland mining exports go to China. If China has a hard landing then Australia is in serious trouble, and even if it has a soft landing then Australia may be in trouble anyway. If China wobbles or the Australian housing market starts to correct, the RBA would be forced to cut interest rates as it did late last year, reducing the Aussie Dollar’s appeal as a higher yielding currency. The Aussie Dollar is only just over 3% below its strongest ever on a trade weighted basis, and we think that leaves it looking very vulnerable. With the market pricing in a reduction in the RBA cash rate of 1% to 3.25% by August, will the hot money fly away from Australia in the summer?
This post was originally published on 11.01.12 in English and has been translated for our German readers.
2011 hat der Euro gegenüber dem US-Dollar 3,2% verloren. Nach allem, was 2011 in Europa passiert ist, sind viele überrascht, dass der Euro nicht schwächer abgeschnitten hat. Zahlreiche Kommentatoren rechnen für 2012 mit einer deutlichen Schwächung des Euro.
Wie es bei Wechselkursen meistens der Fall ist, lässt sich die Entwicklung des Euro gegenüber dem US-Dollar größtenteils mit der Veränderung der Erwartungen für die kurzlaufenden Zinssätze erklären, die an den relativen Renditedifferenzen zwischen den kurzlaufenden Anleihen der verschiedenen Währungsräume abzulesen sind. Die Stärke des Euro gegenüber dem US-Dollar in der ersten Jahreshälfte war auf die unterschiedlichen geldpolitischen Strategien der Fed und der EZB zurückzuführen. Die Fed blieb bei ihrer Aussage, dass sie für einen längeren Zeitraum einen außergewöhnlich niedrigen Leitzins beibehalten würde (und ging im August sogar noch einen Schritt weiter, als sie erklärte, dass „die Wirtschaftslage wahrscheinlich bis mindestens Mitte 2013 ein außergewöhnlich niedriges Leitzinsniveau rechtfertigen wird“). Die EZB dagegen hob im April und im Juli letzten Jahres munter die Leitzinsen an, obwohl der ganze Markt diesen Schritt als unsinnig verurteilte. Wie zu erwarten (siehe hier), begannen die Märkte kurz nach der zweiten Zinserhöhung vorwegzunehmen, dass die EZB gezwungen sein würde, ihre Zinsschritte wieder rückgängig zu machen (was sie dann auch im November und Dezember tat). Der Euro schwächte sich im restlichen Jahresverlauf ab.
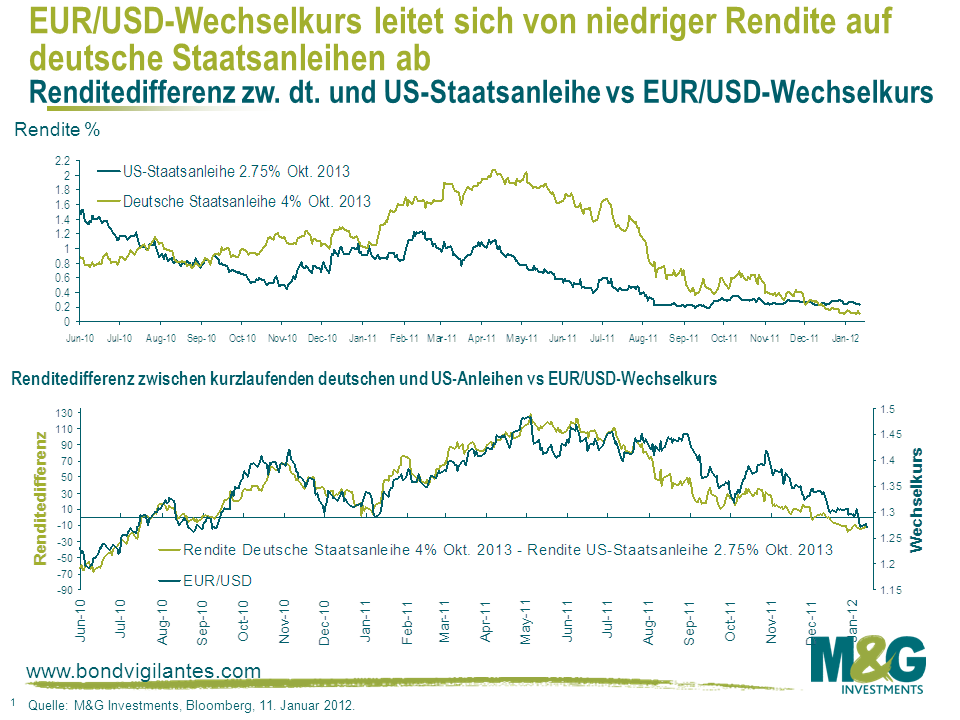
Die obere Grafik zeigt die Renditen auf deutsche und US-Staatsanleihen mit Fälligkeit Oktober 2013. Das untere Diagramm zeigt die Entwicklung der Renditedifferenz zwischen deutschen und US-Anleihen im Vergleich mit dem EUR/USD-Wechselkurs. Die Korrelation ist – wie erwartet – recht stark ausgeprägt. Allerdings befindet sich der Euro jetzt auf einem 15-Monats-Tief gegenüber dem US-Dollar, und dieser Abwärtstrend kann nur anhalten, wenn eine der folgenden drei Entwicklungen eintritt:
1. Die Fed müsste ihre Meinung drastisch ändern und die Leitzinsen vor Mitte 2013 anheben, was eher unwahrscheinlich ist.
2. Die normale Korrelation zwischen dem EUR/USD-Wechselkurs und den kurzlaufenden Anleiherenditen müsste komplett zusammenbrechen. Das ist durchaus möglich.
3. Die Renditen auf deutsche Staatsanleihen müssten sehr negativ werden.
Was den dritten Punkt anbelangt, so ist es Deutschland tatsächlich erstmals gelungen, Anleihen mit 6-monatiger Laufzeit mit negativer Rendite zu begeben (siehe hier). Wenn man sich allerdings das untere Diagramm ansieht, muss man davon ausgehen, dass für einen Rückgang des EUR/USD-Wechselkurses auf 1,15 die Renditen für kurzlaufende deutsche Staatsanleihen bis zu 90 Basispunkte unter die Renditen für kurzlaufende US-Staatsanleihen fallen müssten. Zweijährige US-Staatsanleihen rentieren gegenwärtig mit +0,24%, die Renditen für die deutschen Titel müssten also unter -50 Basispunkte fallen. Die Folge wäre eine interessante Konstellation, bei der Anleger in zweijährigen deutschen Staatsanleihenfutures („Schatz“) short gehen, den Kontrakt nicht rollen und bei Fälligkeit Geld geschenkt bekommen können (wenn sie die Volatilität verkraften können).
Könnten die Renditen auf deutsche Staatsanleihen sehr weit ins Negative rutschen? Wenn die Anleger zunehmend die weitere Existenz des Euro in Frage stellen, sind negative Renditen auf deutsche Staatsanleihen eine durchaus rationale Folge. Diverse Analysten haben versucht zu ermitteln, wie neue D-Mark, Francs, Lire, Peseten oder Drachmen gegenüber dem Euro notieren würden, und jeder scheint damit zu rechnen, dass die neue D-Mark gegenüber dem aktuellen Niveau des Euro zulegen würde. Die Spanne der Erwartungen ist allerdings recht breit gefächert: Einige Analysten nehmen eine Aufwertung von 5% an, andere bis zu 40% (ich selbst bin, nebenbei bemerkt, nicht überzeugt, dass eine neue D-Mark höher notieren würde als das aktuelle Kursniveau des Euro, wenn man bedenkt, welchen Schaden ein Zusammenbruch des Euro im deutschen Bankensektor anrichten würde). Natürlich ist das alles reine Spekulation; es lässt sich aber kaum abstreiten, dass eine neue D-Mark viel stärker wäre als beispielsweise ein neuer französischer Franc und insbesondere eine neue spanische Pesete, italienische Lira oder griechische Drachme.
Zunehmend negative Renditen auf deutsche Staatsanleihen und wachsende Renditeabstände zwischen Deutschland und anderen Ländern wären also eine rationale Reaktion auf die steigende Wahrscheinlichkeit, dass die Eurozone auseinanderbricht und die deutschen Staatsanleihen in eine neue D-Mark redenominiert werden. Die Redenominierung in eine neue D-Mark könnte dem Inhaber einer kurzlaufenden deutschen Staatsanleihe mit einer Rendite von -0,5% einen Wertzuwachs von vielleicht 40% einbringen, oder vielleicht sogar einen Wertzuwachs von 90%, wenn der Anleger in Griechenland wohnt. Die negativen Renditen auf deutsche Staatsanleihen könnten sehr leicht noch negativer werden, wenn das Risiko eines Auseinanderbrechens der Eurozone zunimmt, was zu den hier erörterten Problemen führen würde. Der Euro könnte also noch deutlich schwächer werden.
In 2011 the euro underperformed the US dollar by 3.2%. Given everything that’s occurred in Europe, many people have been surprised that the euro has not been weaker, and numerous commentators continue to call for a much weaker euro in this calendar year.
As usual with FX rates, most of the euro’s behaviour versus the US dollar can be explained by changes in expectations of short term interest rates, as seen by the relative differences between the regions’ short dated government bond yields. The euro’s strength against the US dollar in the first half of last year was due to the contrasting approach of the Fed and the ECB. The Fed continued to state that it would maintain an exceptionally low Fed Funds rate for an extended period (and then in August went a step further by stating that “economic conditions….are likely to warrant exceptionally low levels for the federal funds rate until at least through mid 2013”). Meanwhile, despite almost the whole market telling them it was daft, the ECB merrily hiked rates in April and July last year. Very predictably (see here), soon after the second hike, the markets promptly began to anticipate the ECB having to reverse its hikes (which it subsequently did in November and December) and the euro weakened over the remainder of the year.
The top chart shows the yield on German and US government bonds maturing in October 2013. The bottom chart shows the difference in the two yields plotted against the EUR/USD exchange rate, and the correlation is strong as you’d expect. However, the euro is now at a 15 month low versus the US dollar, and for this weakening trend to continue, we need one of three things to happen. Firstly, the Fed needs to do the unlikely, have a big change of heart, and hike rate rates before mid-2013. Secondly, which is quite possible, the normal correlation between EUR/USD and short term bond yields needs to completely break down. Or thirdly, German government bond yields need to get very negative.
Regarding the third point, Germany did indeed manage to issue 6 month bills at a negative yield for the first time (see here). If you eyeball the bottom chart, though, for EUR/USD to go to 1.15, you may need short dated German government bond yields to be as much as 90 basis points below short dated US government bond yields. Two year US government bonds currently yield +0.24%, so you’d be looking at German yields below -50 basis points. You’d end up with the interesting dynamic of investors going short of two year German government bond futures (the ‘Schatz’), not rolling the contract, and making free money (if they can ride out the volatility) at maturity.
Could German government bond yields get very negative? Well if investors increasingly doubt whether the euro can remain in existence, then negative German government bond yields are a totally rational outcome. Various analysts have had a stab at guessing where a new Deutschemark, Franc, Lira, Peseta or Drachma would trade versus the euro, and everyone seems to expect the new Deutschemark to strengthen against where the euro currently trades, although the range is huge with some going for 5% appreciation and some as much as 40% (for what it’s worth I’m actually not convinced a new Deutschemark would necessarily trade higher than where the euro currently trades given the damage that a euro breakup would do to Germany’s banking sector). It’s all obviously a total guess though as nobody has any idea, however it’s hard to argue against a new Deutschemark being a lot stronger than, say, a new French Franc and particularly a new Spanish Peseta, Italian Lira or Greek Drachma.
So increasingly negative German government bond yields, together with widening yield spreads between Germany and other countries, would be a rational response to the rising probability that the euro breaks up and the German government bond is redenominated into a new Deutschemark. Redenomination into a new Deutschemark could end up returning the holder of a -0.5% yielding short dated German government bond perhaps a 40% capital gain, or maybe even a 90% gain if the investor is living in Greece. Negative German government bond yields can very easily become more negative as the risk of breakup increases, leading to the problems discussed here. And the euro could therefore weaken a lot further.
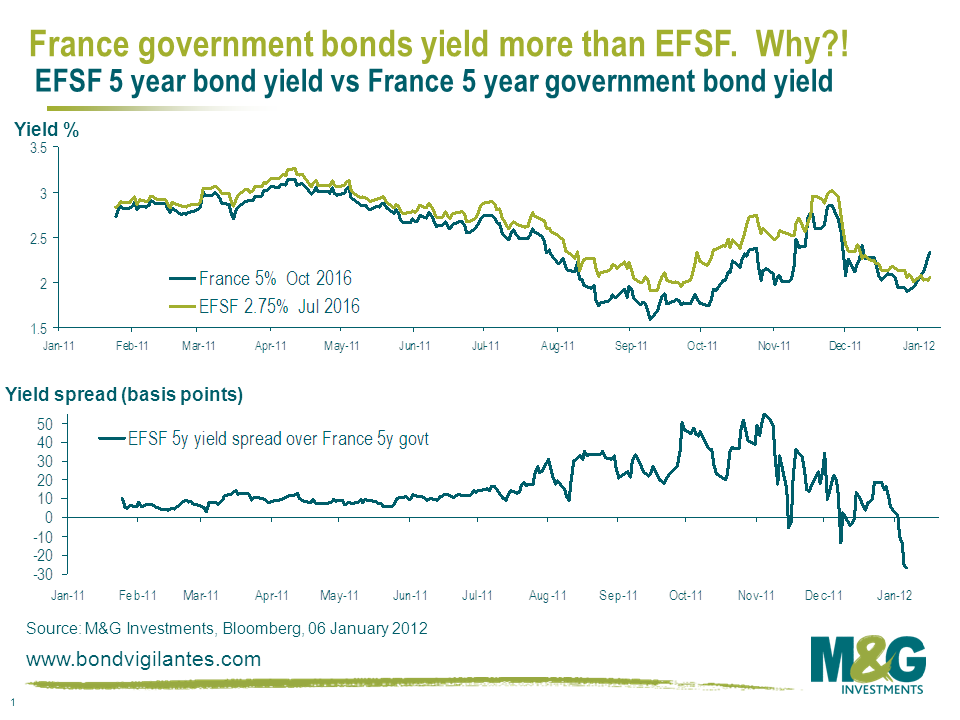
France has started wobbling again recently. France 10 year government bond yield spreads over Germany have blown out from just under 100 basis points at the beginning of December to 150 basis points today, although this is still a bit below the wides of 190bps in mid November. Maybe people have woken up to the likelihood of France losing its AAA status, or the probability that France is going to have to issue even more bonds in the next three years than heavily indebted Italy.
What makes much less sense is that France government bonds now yield more than EFSF bonds (eg see chart below). Fitch pointed out the obvious at the end of December when they said that EFSF’s AAA rating depends on France remaining AAA, and highlighted that France and Germany provide over 80% of the ‘guarantees’ for EFSF (France provides €158.5 billion of guarantees plus over-guarantees to the EFSF pool). If France defaults, EFSF isn’t going to work. If Spain or particularly Italy default, France might default, and maybe even Germany will default. But if we get to the stage where Spain or Italy defaults, you can be pretty certain that EFSF guarantors will renege on their ‘guarantees’ since the bailing out of Spain or Italy would dramatically increase the risk that the guarantors themselves default. And this is just one of the problems with EFSF (see my comment from last September here for a longer list)
So surely EFSF bonds are effectively subordinated French government bonds. Personally I wouldn’t touch either of them, but shouldn’t EFSF bonds yield more than France?
The 2000s were the slowest decade of population growth in the US since the Great Depression. The first set of state population counts for 2011 revealed that there has been no change to this trend. The US experienced the lowest annual population growth rate in 2010-11 since 1945.
William H. Frey concludes that the weak labour market in the US appears to have slowed down immigration to the US and to have led to a decline in birth rates. What is more, the baby boomers have passed their prime years for childbearing, affecting the natural increase of population. He has also observed a slow down of internal migration within the US as a consequence of fewer job opportunities across the country. Furthermore, the housing sector in the US is still under water. It remains difficult for a large share of the population to sell houses and raise capital. That makes it unaffordable for many Americans to pursue job opportunities elsewhere in the country.
What could follow economically from this demographic trend? Lower population growth will lead to an increase in the dependency ratio. More people will live on state pensions, and government spending on health care will increase. At the same time fewer workers will pay taxes and, consequently, negatively affect government revenues. The talent pool of skilled workers will shrink which might decrease economic competitiveness. Companies might have to pay higher wages due to lesser competition in the labour market. In the end, it could incentivise companies to look into outsourcing production or relocating business, which would also decrease government revenues.
It is fair to say though that this demographic trend of lower population growth might turn out to be only a relatively short episode in US history, just like after the Great Depression. The US economy might also prove to be able to maintain its high level of competitiveness and to continue to sufficiently attract talent as well as to improve productivity.
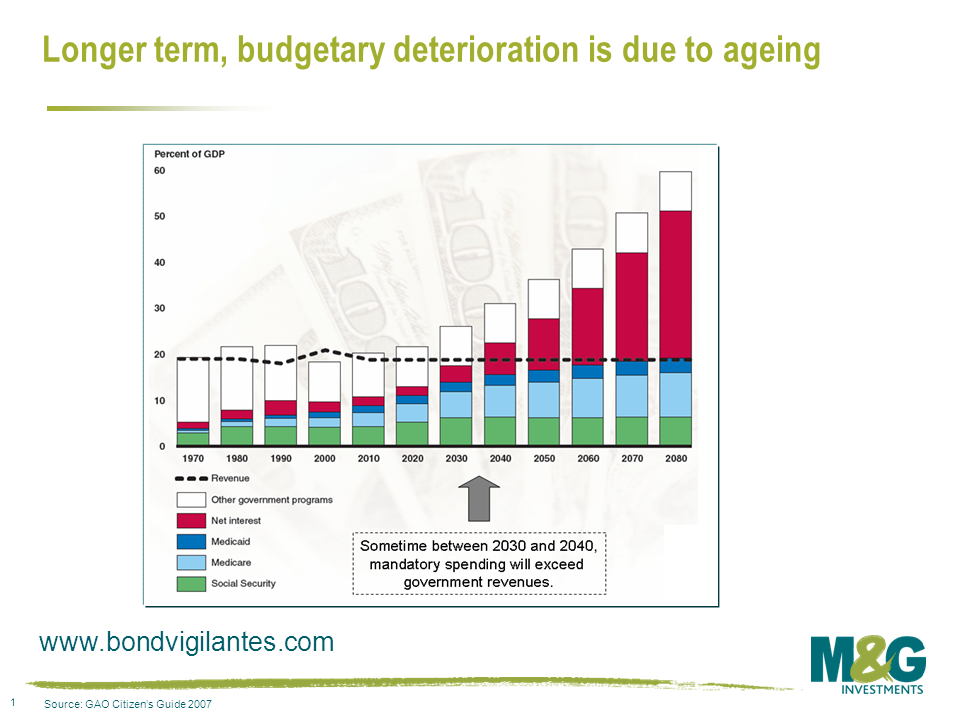
If not, government spending and/or tax benefits might need to be increased to support the economy and to maintain the current standard of living. Costs for social security and healthcare will inflate significantly at the same time. The negative impact on the US debt dynamics is striking. According to an estimate from 2007 that was available to us, mandatory spending composed of contributions to Medicare, Medicaid and social security as well interest payments will exceed government revenues between 2030 and 2040. This estimate stems from a time before the financial and sovereign debt crises corrupted US politics as well as the economic prospects of many US citizens.
What we also have to bear in mind is that potential GDP growth is traditionally considered being a function of population growth and productivity growth. I leave it open for debate how likely it is that future productivity growth will offset the lower population growth. In a gloomy scenario, lower population growth could prove to be not only the consequence of economic struggle, but also its future catalyst.
Happy Hogmanay – an independent Scotland looks AAA on the back of an envelope (as long as it gets all of the oil and none of the banks!), but would probably get rated lower. UK to get downgraded on uncertainty?
We’ve obviously been thinking a lot about the break-ups of currency areas lately, and it got us thinking about an Optimum Currency Area closer to home. What would happen if the UK broke up? We did talk about what might happen to the gilt market if Scotland left the Union back in 2007 (see blog here), but political events this year have made it less of a theoretical question, and one that outgoing cabinet secretary Sir Gus O’Donnell asked at the end of December.
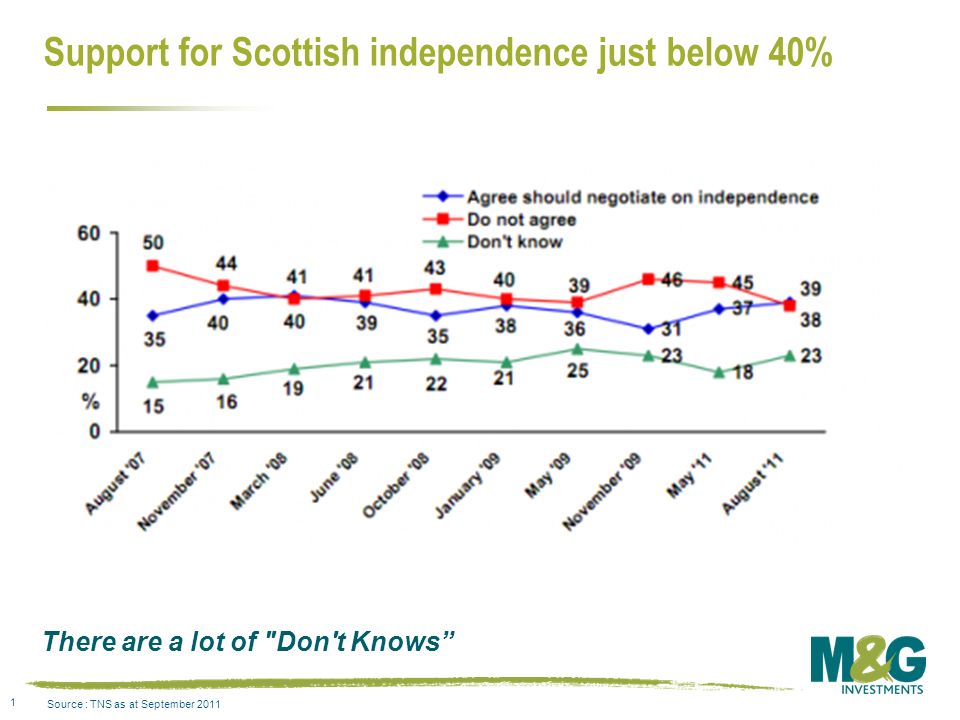
First of all, is it likely? During 2011, the Scottish National Party gained a majority in the devolved Scottish Parliament. It is now able to call for a referendum on the issue of full Scottish independence. It will do this sometime in 2014 or 2015, in the second half of the Parliament, and can also determine the question to be asked (worth a handful of percentage points to the question setters’ cause). If there is a “Yes to independence” vote, Scottish MSPs will need to pass a bill calling on the UK Parliament to negotiate terms for a break-up of the Union. That’s where the fun starts, as we’ll see. But will it happen? Back in October a YouGov poll put the “Yes” vote at 34%, with a decent number of “don’t knows”. But since the Eurozone problems began to accelerate, and UK growth prospects also slowed, it looks as if more recent polls have the “Yes” vote at around 28% (BBC November poll), with 17% “Don’t know”. The TNS opinion poll in the chart below however shows a much higher level of support for independence. The large differences in the outcomes of different polls reflects the wording of the question posed, and whether there is a simple “yes/no” or whether a third option for increased devolution within the UK is offered.
The SNP independence cause may have been damaged somewhat by developments since Alex Salmond’s 2006 “arc of prosperity” comments in which he favourably compared Scotland to Ireland and Iceland (now both with economies on life support – the “arc of insolvency” as Labour dubbed it) and also by their commitment to adopt the euro, at a time where peripheral economies which did adopt the euro are facing deflation, social unrest and default.
But let’s assume that the “Yes” vote returns to its October levels, and that the “Don’t knows” are converted to “Yes”, so that the Scottish people vote for independence in 2014. What happens to the bond market? Is the UK ex Scotland still AAA, and what credit rating would Scotland have? AAA like Norway, or lower? Maybe a good starting point would be to share out the UK’s national debt in terms of population. The UK population is 61.8 million, of which 5.2 million people live in Scotland. So Scotland becomes liable for 8.4% of the national debt, which equates to about £80 billion of the £940 billion debt.
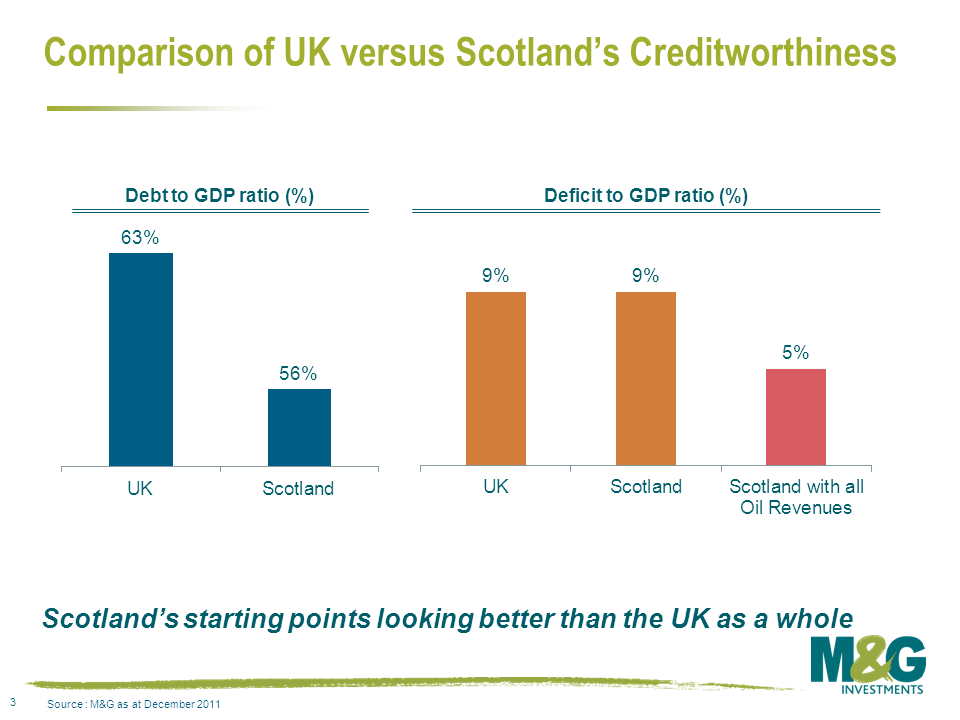
To be a AAA rated economy, you would hope to have a debt/GDP ratio of about 60% or lower (although there are now AAA countries with ratios heading to 100%), and that your interest costs would run at under 12% of your state revenues. Scotland’s GDP in 2009 was £143 billion (including all oil and gas produced in its waters), so its debt/GDP ratio would be 56% – respectable. The average interest rate on the existing stock of national debt is about 4%, so Scotland’s debt servicing costs would be £3.2 billion per year. Scotland’s revenues from taxes and duties in 2009-10 were £41.2 billion, so its interest payments to revenue metric would be just 8%.
Ah. But that’s just the “ordinary” debt. What if we add in the government money committed to “Financial Interventions“, which the headline numbers exclude nowadays. These financial interventions include the debts of the nationalised/part-nationalised banks (Northern Rock, Bradford & Bingley, Lloyds and RBS), and also money used in the bailouts of London Scottish Bank, and the Dunfermline Building Society, amongst others. The assumption of the debts of these nationalised/semi-nationalised banks onto the balance sheet of the UK takes the national debt from below £1 trillion to over £2.25 trillion. Because the government expects to sell these stakes back to the market, these are regarded as temporary liabilities and excluded from the headline numbers – the numbers also ignore that these debt liabilities fund assets so it’s not the black hole it might seem to be. But if you were a bad tempered English MP negotiating the break-up of the Union, might you highlight that much of the banking sector interventions directly involve Scottish banks (mainly RBS, HBOS) and perhaps suggest that as well as 8.4% of the gilt market liabilities, independent Scotland might like to take its banks back too? The assets of Royal Bank of Scotland and (Halifax) Bank of Scotland alone dwarf the size of the Scottish economy (on the back of an envelope they amount to 1400% of Scottish GDP; Iceland’s bank assets peaked at 1100% of GDP in 2008). Countries with relatively low public debt to GDP ratios still get into difficulty because of their private sector debt – at times of trouble, private debt often becomes public debt (the process where profits are privatised, and losses socialised).
Let’s assume that Scotland doesn’t have to support the banks. The bigger problem revolves around the sustainability of Scotland’s strong credit position. The starting point for debt/GDP and revenues versus interest costs look good for Scotland on a headline basis (i.e. forgetting about the banks, if we’re allowed to!); but is that relatively low debt burden maintainable? Oxford Economics produced a paper suggesting that of all the regions in the UK, Scotland made the biggest net negative contribution to the UK public finances. In 2004/05 Scottish revenues were about £35 billion, compared with government expenditures of £45 billion. In other words there was a net transfer of about £10 billion from 3 English regions of the UK (Greater London, the South East and Eastern regions – all other regions were net negative too). So Scotland would need to borrow this, plus its share of gilt interest at £3.2 billion each year to maintain a balanced budget. So £13.2 billion of deficit, compared with GDP of £143 billion is about 9% – about the same as the UK is running right now, but way above a sustainable number (for example the uniformly ignored Maastricht limit for Eurozone members is at 3%).
Now the elephant in the room. Oil. If Scotland were to receive its share of the revenues (North Sea Corporation Tax and Petroleum Revenue Tax) from the remaining North Sea oil, its position improves dramatically. In 2021/12 these totalled £6.5 billion, of which geographically Scotland is entitled to 91%, so £5.9 billion – although this is a volatile number which moves with the oil price. So on an annual basis the budget deficit falls from £13.2 billion to £7.3 billion – a deficit of 5%. Nice. On a present value basis, assuming these levels of revenue forever and a discount rate of 4% (to equate with its debt service costs) the oil revenues are worth £163 billion; but North Sea oil revenues are likely to fall aggressively from here – 1999 was probably “peak oil” for the North Sea, and by 2020, production will be a third of 1999 levels. So again, if I’m rating Scotland as a stand-alone entity, I worry what will happen going forwards. If you sold future revenues today you could wipe out Scotland’s national debts – and even invest in a Sovereign Wealth Fund (SWF) like the Norwegians with the change (£80 billion or so)!
May I take a moment to rant about the lack of a UK SWF? In real terms the UK government has taken £270 billion out of the North Sea in tax revenues. Did we save it, like the Norwegian Statens pensjonsfond, now worth around £330 billion? Nope, after millions of years spent turning bracken into oil, we gave it away in a 20 year period to a population who just happened to be alive under a particular government’s time in office and got a windfall gain which they used to buy avocado coloured plastic bathroom suites, now doomed to eternity in landfill across the nation. Bah.
What else would a rating agency consider when determining Scotland’s credit rating? The US gets a massive boost to its rating due to its status as a global reserve currency, Japan has so much domestic saving that it can run a debt/GDP ratio of 200% and still be Aa3 rated, and the UK survives as AAA in part due to it being able to print its own currency. Additionally, ratings agencies favour big, systemic nations over smaller ones where there is an implied higher risk factor (rightly or wrongly) and given the experience of Iceland and Ireland which both held AAA ratings perhaps the agencies would err on the side of a lower rating. The currency point is interesting – the SNP position was to adopt the euro (a difficult one to get through the voters today I would guess), but Scotland could keep the pound (either officially with access to the Bank of England, or unofficially – Zimbabwe uses the US dollar without being part of the Federal reserve system), or print its own currency (pegged to the Euro, pound, price of oil, nothing).
Also very important when considering debt servicing ability is the growth rate of the economy. Scotland performs relatively poorly on this measure (although one argument from those who want independence is that only when Scotland is separated from the UK will it be in charge of its own economic future, and its underlying growth rate can improve). Currently Scotland’s average GDP growth rate is 0.6% per year behind the UK as a whole, and around 1% behind that of the other small European economies. The public sector represents 24% of Scottish employment – higher than in the rest of the UK, although it is falling as part of the recent austerity programmes. As well as being a drag on economic productivity, a disproportionate public sector also means a higher level of unfunded pension liabilities – a contingent liability, like the probable losses involved in the bank bailouts.
So my guess is that a rating agency would not give Scotland a AAA rating, and that the market would trade any bonds it issued at a wider yield than the UK which still benefits from some reserve currency status. The next question we want to answer is how would a break-up impact the gilt market? Would I be given £8 of Scottish gilts and £92 of UK gilts for every £100 of gilts I own now? Can “they” do that to me? It would count as an event of default for the UK in CDS markets, and almost certainly also for the rating agencies, unless this was a voluntary exchange. Logistically nightmarish, so our UK sovereign credit analyst Mark Robinson suggests that the UK would keep all of the gilt liabilities, and Scotland and the UK would have a bilateral loan for an equivalent amount (the UK has a bilateral loan for about £7 billion to Ireland for example, albeit in very different circumstances). I doubt that the UK’s credit rating would change as a result of any fundamental economics of Scottish independence – but international investors might worry about the instability, real or imagined, of the Union breaking up, so a downgrade for the UK is not out of the question. Mike Riddell here has been doing some digging on what happened to assets and liabilities when states and unions dissolved (e.g. Russia assumed all of the USSR’s debts, Yugoslavia’s carve up was much more complicated) – he’ll post up some thoughts some time soon I hope.


