Markets
Gold prices: beyond inflation and real yields
By Robert Burrows
25 April 2024

This time last year many thought that duration management was going to be the key to success in 2014. Yields were expected to rise as the Fed weaned the market off QE and began to normalise rates. As a result, only the very brave would have been positioned long duration heading into 2014. To be positioned as such would presumably have taken some explaining, particularly when set against what seemed to be the more logical mantra of short duration/long credit risk.
Taking a look back at the returns from selected parts of the bond market, it’s evident that duration was indeed important. But far from it being the short duration asset classes near the top of the tables, the opposite is actually true. Being long duration has paid off as core government bond yields have only really moved in one direction. Perhaps the starkest example of this is the 10y German bund yield, which as I write, is around 0.55%.
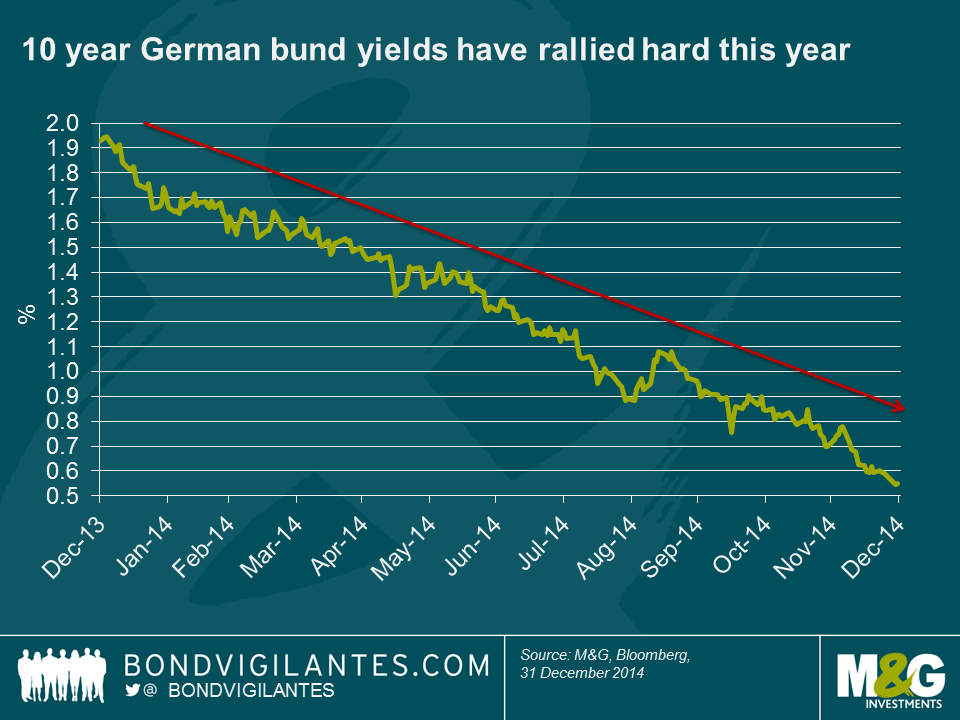
Similarly, ten year Treasury yields have fallen from 3% to 2.2% (having traded close to 2% earlier this month) and gilt yields have rallied from just over 3% to around 1.8%.
Yield curves have flattened in 2014.

Short dated Treasury yields bucked the trend, with the 2 year yield rising from 0.4% to 0.7% as the market priced in near-term interest rate rises, while medium and longer dated yields rallied the most across markets, driven by still abundant liquidity, expectations of a lower peak in interest rates and a significant shift in inflation expectations.
The stellar returns from longer dated assets helps to explain why sterling bond markets have been among the strongest performers of our selection of bond indices in 2014. Index-linked gilts for example, weighing in with a hefty average duration of 20 years or so, have returned a very impressive 18.7% (see Mike’s recent blog for further details) and conventional gilts (average duration just short of 10 years) are up there too, with total returns of 13%. Sterling investment grade credit has therefore also done very well and few would have predicted that GBP IG non-financials would have returned nearly 13% this year. Other investment grade credit markets have also performed well. Despite being significantly shorter duration than the sterling market, euro IG non-financials have returned 8.9%, thanks of course to lower government bond yields but also because European credit, unlike most markets, has seen spread compression continue in 2014.
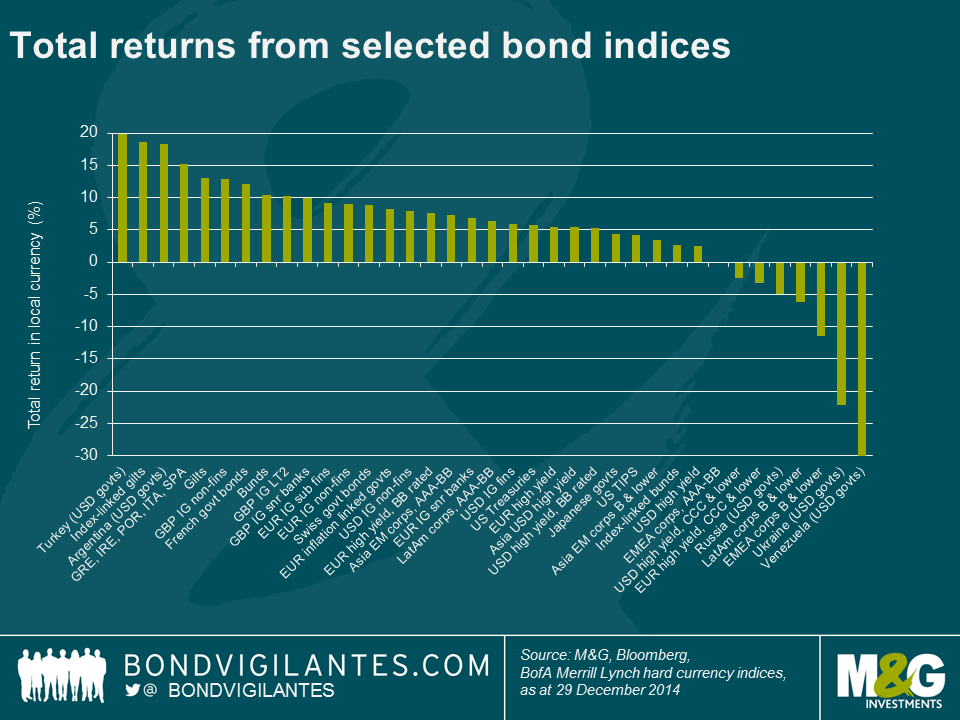
What may be surprising is that in a year when the US economy has been a standout performer and Europe has been edging closer and closer to deflation, European inflation linked bonds (essentially French and Italian govies) have returned 8.3%, in contrast to US high yield, which has only just made it into positive territory, gaining 2.5%. This index level number masks disparate fortunes for different segments of the US high yield market though. The more rate sensitive BB portion returned a respectable 5.3%, whereas the more credit sensitive, lower rated end of the spectrum (which you might typically expect to perform better in a stronger domestic economy) was one of the few fixed income asset classes in our sample to produce negative returns, at -2.5% for the year. This theme was repeated elsewhere in high yield – for example euro denominated BBs returned 7.5% and CCC and lower rated credit was down -3.3%.
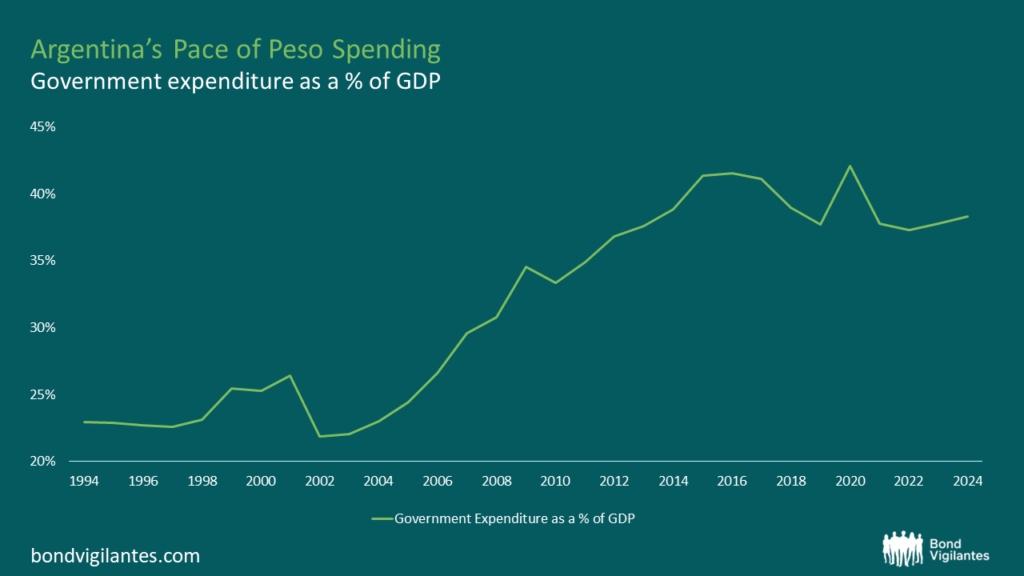
But what of emerging markets? It’s certainly been a very eventful year, with a host of elections, the crisis in Russia and Ukraine, partial default in Argentina, economic crisis in Venezuela, together with a precipitous fall in the oil price to throw into the mix. US dollar EM government bond indices came at the very top and bottom of our rankings for 2014, with Turkey (19.9%) taking top spot, Argentina (18.3%) not far behind, and unsurprisingly Ukraine (-22.2%) and Venezuela (-30.7%) at the bottom of the heap.
So 2014 has been another great year for bonds in the main, but with government bond yields much lower than at the start of the year and credit spreads having tightened significantly from the wides of a few years ago (albeit generally wider than the start of 2014), there’s no doubt it’s going to be difficult for core bond markets to generate such strong returns going forward. But then again it feels as though we’ve been here before…
Thanks for another huge haul of entries to the Bond Vigilantes Christmas Quiz. Three people got full marks (20 points plus the bonus half mark for spotting the Goldhawk Road rail bridge), but the first out of the hat was Marton Huebler of Fidelity Worldwide Investment. Congratulations – we’ll be in touch to find out where you’d like us to make the charitable donation to. You’ll also get the John Lydon book, as will Jonathan Moore of Blue Mountain Capital and Matt Hoggarth of Thesis Asset Management who also got full marks, and the next two runners’ up, Clement Gueugnier of Tikehau IM and James Norman of Danske Bank. We’ll be in touch for your addresses.
Happy Christmas and all the best for 2015 from all of us here at M&G. Here are the answers.
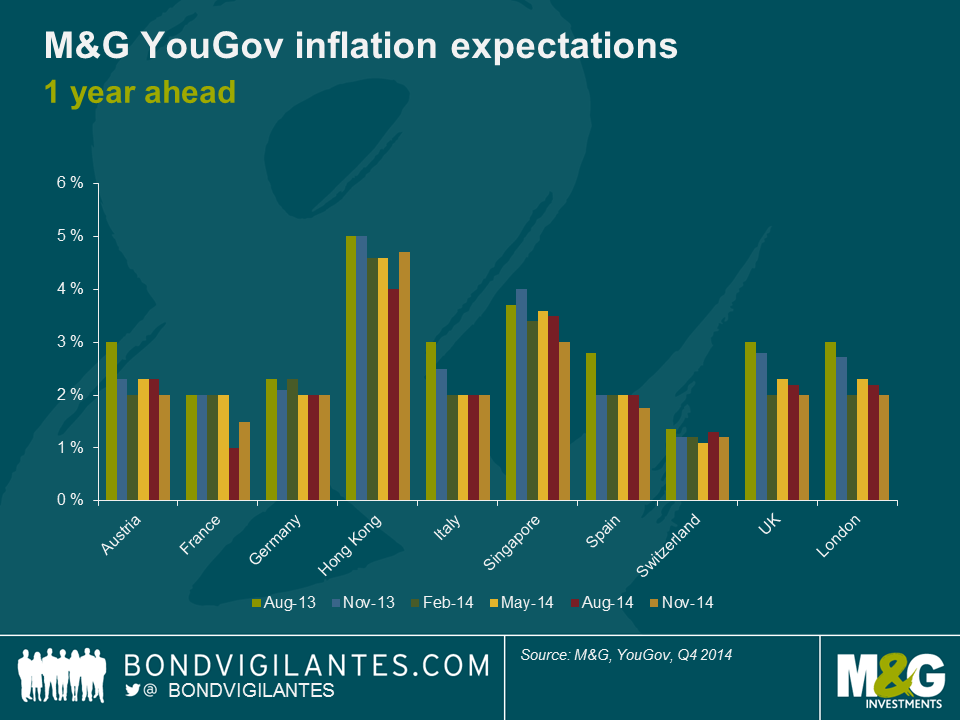
Today we launch the next edition of M&G YouGov Inflation Expectations Survey which polled over 8,200 consumers across the UK, Europe and Asia.
The Q4 report reveals that consumers’ short-term inflation expectations continue to moderate across most regions, although they remain well above current inflation levels. Long-term expectations remain resilient despite this year’s low inflation environment.
Short-term inflation expectations in the UK fell to 2% in November, having been 2.2% in August. The latest figure is the lowest in the last three quarters since a matching 2.0% in February 2014. In Europe, short-term inflation expectations fell in Spain, Austria and Switzerland, remained stable in Italy and Germany at 2%, and increased in France (from 1% to 1.5%).
Over a 5-year period, expectations remain unchanged at 3%, a sign that consumers still lack confidence in the Bank of England’s ability to achieve price stability. Similarly, in Europe, inflation expectations have progressively fallen through 2013/2014 with unemployment, fiscal austerity and an overvalued currency weighing on domestic consumption and exports. However, long term expectations remain firmly above the European Central Bank’s 2% inflation target in all surveyed countries.
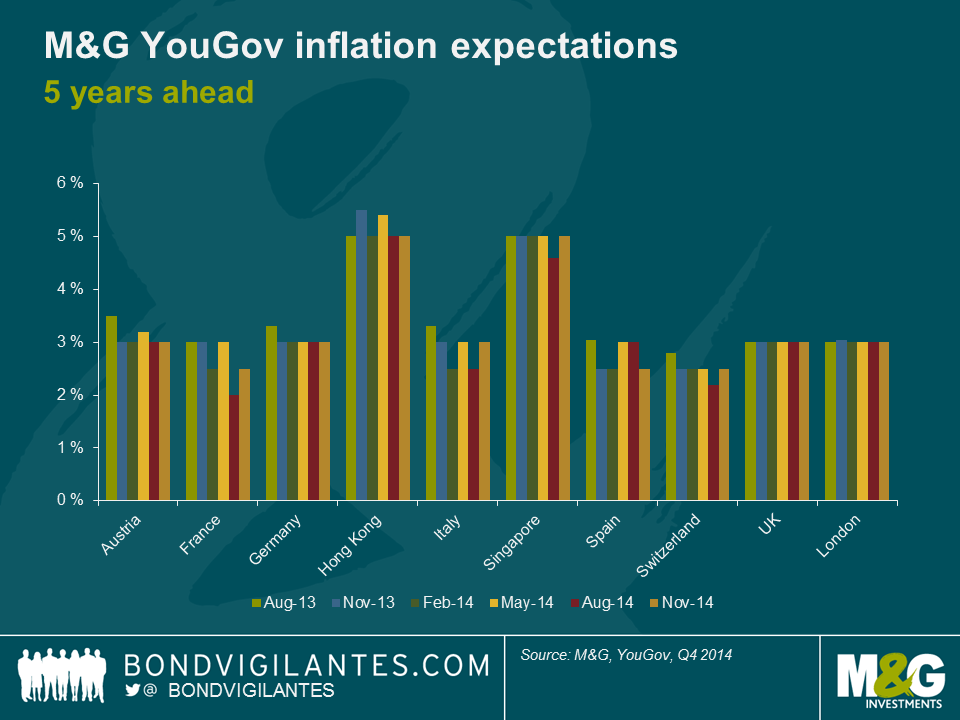
In Asia, the gauge for short-term inflation falls to a record low of 3% in Singapore. However, over a five-year period, expectations have risen back to 5%, the average reading since the start of the survey. The outlook for inflation is concerning in Hong Kong where one-year expectations rise from 4% to 4.7% and the long-term gauge remains unchanged at 5%.
The findings and data from our Q4 survey is available in our latest report here or via @inflationsurvey on Twitter.
If at the beginning of 2014 you had made a list of what you thought would be the best performing fixed income asset classes globally for the coming year, it’s very unlikely you’d have put UK index-linked gilts at the top. It’s probably even less likely that you’d have put Argentina’s (hard currency) bond market in second place, especially if you had been told that Argentina would default in 2014.
Given the startling 19.9% performance from inflation-linked gilts* this year, you might think that the UK has some kind of inflation problem. In fact it has been quite the opposite. Last year the UK Consumer Price Index (CPI) rose by 2%, bang on the Bank of England’s target, but data released on Tuesday showed that CPI inflation was just 1.0% in the year to the end of November 2014. Meanwhile longer term market implied inflation expectations have also slumped – taking the 10 year breakeven inflation rate, the UK bond market is pricing in an average annual inflation rate for the Retail Price Index (RPI) of about 2.6% for the next decade, down from above 3.1% at the beginning of the year (RPI is the inflation rate used for linkers). Assuming an RPI-CPI long term wedge of 1.3% as per the Bank of England’s estimate (see p34), this equates to an average CPI rate over the next decade of roughly 1.3%, which is 0.7% below the Bank of England’s 2.0% target rate.
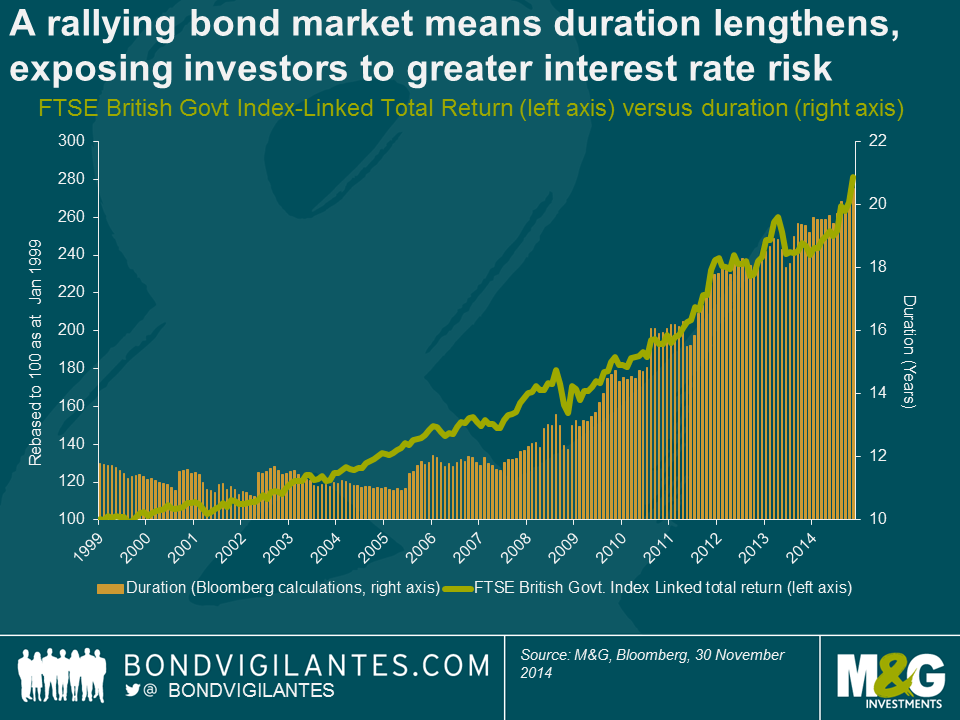
The primary reason for the index-linked gilt market’s phenomenal return is that the asset class has become an exceptionally long duration asset class at a time when government bond yields have plummeted, where duration is the sensitivity of a bond’s price to a change in yields. In essence, therefore, index-linked gilt funds have been behaving like high beta conventional gilt funds.
The reasons for the dramatic duration lengthening of the inflation linked gilt market are twofold. Firstly, as illustrated in the chart below, the market has become longer and longer duration as the market has rallied, but to a large extent it’s because the market has rallied. In a big bond bull market, such as the one that the linker market has had for close to 20 years, longer dated bonds tend to outperform owing to their longer duration. Long dated bonds therefore form an increasing portion of a market weighted index, meaning that the duration of the overall index rises as the market rises. Therefore, you end up with the rather uncomfortable situation whereby a rallying market means that the interest rate risk (duration) of the asset class is increasing at the same time as the potential returns fall as yields head towards zero (inflation linked bonds is that yields can, and have, sailed through the zero bound, but in the absence of rising inflation expectations, real yields will by definition struggle to move lower when nominal yields hit the zero bound).
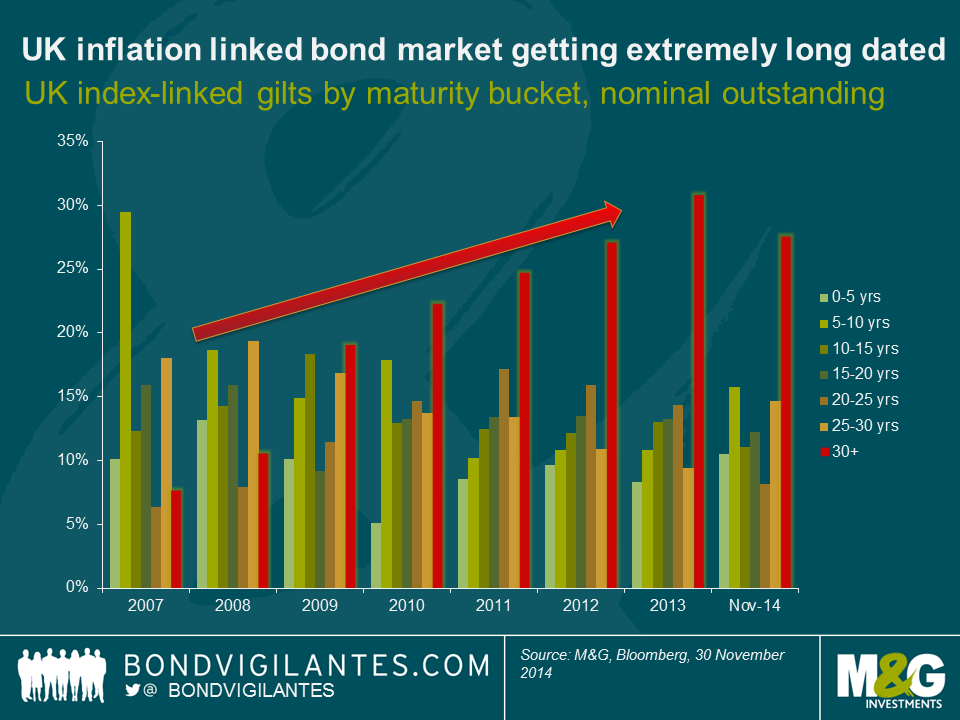
The second reason why the duration lengthening in the index linked gilt market has been particularly acute is because of the sheer quantity of issuance of long and ultra-long dated inflation linked gilts, as the UK’s Debt Management Office has sensibly attempted to feed the insatiable demand from domestic pension funds et al for long dated inflation hedges. The chart below plots the evolution of the linker market by maturity band, taking the nominal amount of debt outstanding, and it’s notable how the 30 year + maturity bucket has more than trebled since 2007.
Today, the longest dated index-linked gilt has a maturity of 2068, and has a duration of 52 years. The bond’s real yield started this year at +0.04% and had dropped to -0.73% by the end of yesterday, resulting in a year to date price return alone (i.e. excluding interest) of +48.7%. Who said bonds were boring?
Long dated real yields at such negative levels are disturbing. Perhaps the market is completely mispriced and we’re set for a return to an era of positive real yields again. If this happened, it would hand investors hefty losses (if the real yield on the linker 2068 went from -0.73% to +1%, the bond’s price would fall by almost 60%).
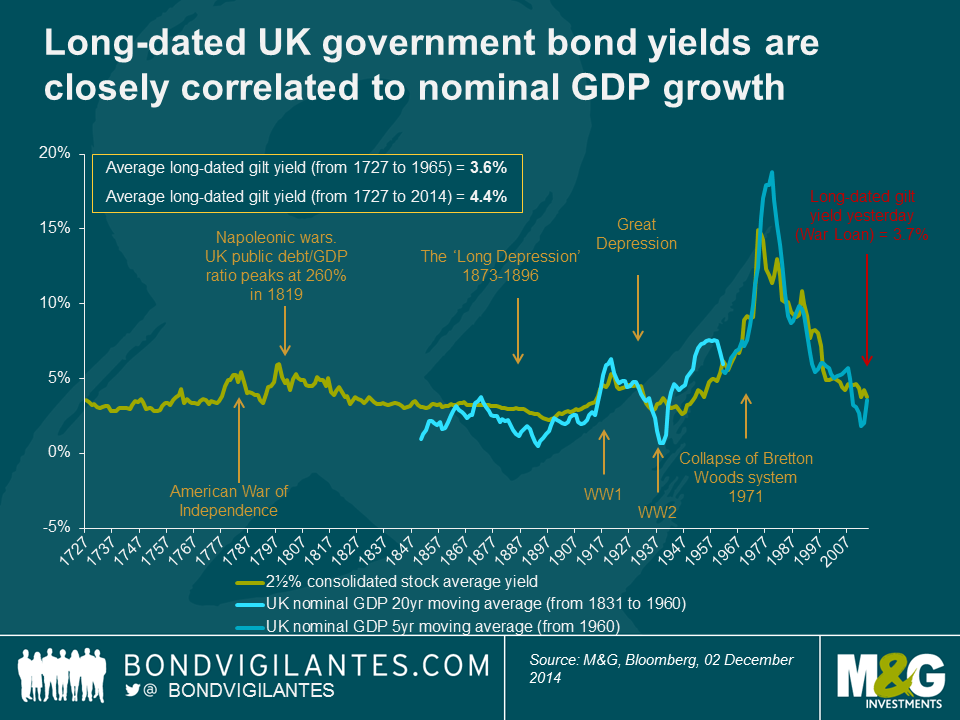
But if the inflation linked gilt market is accurately reflecting fundamentals, it paints an exceptionally bleak picture of the UK’s long run growth potential. The bond markets are clearly buying the secular stagnation argument (see here for further reading). As shown on a previous blog (see first chart here), there has been a reasonably close correlation between UK nominal GDP growth rates and long term nominal gilt yields going back over a century. Inflation linked gilts have only been around since the early 1980s, but it follows that there should also be a relatively close correlation between UK real GDP growth rates and long term real yields. Long dated index-linked gilt yields are -0.7%, but these are priced off RPI, not CPI – so applying the 1.3% RPI-CPI wedge as per above gives you a real yield of about +0.6% in CPI terms.
If the bond market is right, and the UK’s long term growth potential is only +0.6% per year, then Japan’s experience of the last two decades will end up looking like a relatively good outcome.
* The FTSE UK Index Linked All Stocks Index had returned 19.9% up to yesterday in GBP terms, while the slightly more commonly used FTSE UK Index Linked Over 5 year Index had returned 22.5%.
The following 15 people correctly answered that President Richard Nixon effectively ended the Bretton Woods era in 1971 by suspending the convertibility of the US dollar into gold. Thanks everyone for entering – we will contact the winners by email to arrange delivery of the book. If you didn’t win, why not try the Bond Vigilantes Christmas Quiz
It has been a while since we talked about QE, but we covered this substantially in the past (see for example ‘Sub Zero?’, ‘QE – quite extraordinary‘ and ‘Quantitative easing – walking on custard‘). It now appears, at least for the time being, to be a part of monetary history in the UK, and more recently the US. However, it is being reapplied in Japan and about to do a grand tour of Europe. Our earlier blogs were an attempt to analyse a new experiment. What do we think now we have had the practical implication of the theory?
Let’s go back to basics first. Monetary policy reaches the zero bound, so short term interest rates can no longer be cut. Therefore it is time to print money. Being prudent, the central bank needs to be able to tighten policy again at some point by destroying the printed money. So it favours purchasing large, liquid, risk free debt and buys government bonds in huge quantities.
This drives longer term interest rates down to the zero bound, and therefore should encourage long term borrowing, discourage long term saving, increase asset prices that are a function of long term rates (property and equity), and therefore via the wealth effect, stimulate growth.
The above effects and especially the wealth effect are seen as proof by its supporters that QE has worked via higher asset prices and this chart is often used as evidence of the correlation between the two.
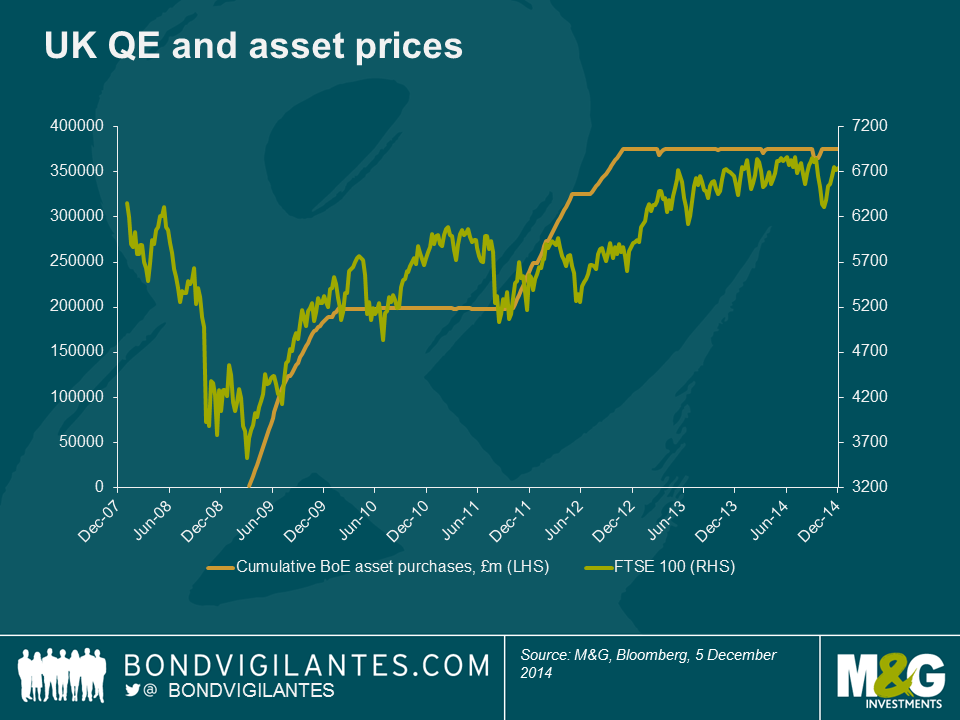
Asset prices have risen and growth has indeed returned, but where is the inflation?
Inflation has indeed been temporarily induced in countries where the exchange rate has collapsed (for example the UK and Japan). However, this has proved to be a blip in the UK, and will likely be the same in Japan once the yen, which is down more than 50 percent versus the dollar over the past three years, finds a new stable equilibrium.
There are principally two reasons inflation has not returned. Firstly, inflation is not just a monetary creation but is a function of other factors, ranging from the oil price, to productivity, technology, inflationary expectations and free markets. The first of these has been exceptionally volatile, creating cyclical inflation and disinflation spurts, whilst the last four have been a constant driver of structurally low inflation for many years.
Secondly, let’s look at what QE actually does from a monetary perspective. The central bank simply exchanges cash for near cash. Holders of government bonds now own cash having sold them, while the central bank now owns government bonds. Interest rates are lower along the yield curve, but there is no actual new money circulating in the economy. Cash that has been created has been exchanged for another form of cash – government bonds.
Central banks have printed money in a very conservative way, so its growth and inflation effects are limited to wealth effects, and a reduction in long term rates.
The interest rate effect of driving the whole yield curve towards zero will reach its own zero bound, and cease to be effective, like short rates at the zero bound. The wealth effect will diminish as it will reach the bounds of investors’ rational market expectations (like inflation expectations) and asset prices will cease to rise as strongly. The assets that do rise are held by individuals who will reduce their marginal consumption as their wealth increases, or those that can’t access them as they, for example, are in a pension fund. Therefore QE itself, in its current form, reaches a zero bound.
When we first discussed QE, the great fear was that it would result in an inflationary spiral as money is printed prolifically. However, QE has been done in a responsible fashion so far. If it were to return to its philosophical roots, as outlined by ‘helicopter Ben’ in his 2002 speech before the National Economists Club, then you would get inflation. Printing money with nothing in exchange for it is inflationary. Printing money and swapping it for near money (ie government debt) is not quite the same.
Fortunately, monetary and fiscal policy has been effective in restoring growth, though inflation remains low. Will the new member of the QE fan club that is the ECB generate any meaningful long term inflation with its traditional QE programme? I doubt it. No one else has.
Oscar Wilde supposedly once said that ‘everything popular is wrong’. Well, the overwhelming consensus at the start of 2014 that bond markets were not a great place to be invested turned out to be very wrong indeed. The relentless march lower in bond yields, and thus strong performance from government bonds and investment grade (for example, sterling IG has returned more than 10% so far this year), was one of the big surprises of 2014. Yields have fallen against a backdrop of decent growth and the end of QE in the US. However, the macro picture elsewhere looks less rosy, and while the US prepares for higher interest rates, the ECB is on a different path.
So what awaits us in 2015? How real is the threat of deflation in Europe? Will the dollar bull market continue? What’s in store for emerging markets and what impact will the sharp fall in oil prices have on global growth next year? Jim will tackle these questions and more in our latest Panoramic outlook.
Here is the 8th annual Christmas Quiz. 20 questions, and the closing date for entries is midday on Tuesday 23rd December. Please email your answers to us at bondvigilantes@mandg.co.uk. The winner will get to choose a charity to which we will donate £200. He or she will also get a copy of “Anger is an Energy”, John Lydon’s new autobiography. Four runners up will also get a copy of the book. Good luck! Conditions of entry are down below somewhere.


I was in Hong Kong a couple of weeks ago to find out more about the Chinese corporate bond market. To start with it’s huge, and growing rapidly. But it comes with some well-known challenges – the large weighting towards property debt, the lack of information about issuers (ratings tend to be done only by the domestic ratings agency), and perhaps most worryingly the issue of structural subordination. Many investors in Chinese debt have found that what they believed to be a senior claim on the assets of a Chinese company turned out to rank below equity when things turned back. Overseas investors in China have a poor record of getting recovery values when things go wrong. This short video takes a look at a few of these issues, and additionally discusses shadow banking and Dim Sum bonds.
It has finally happened: the DMO has elected to call and refinance the 3 ½% War Loan, which at almost £2bn in size is by far the largest perpetual gilt outstanding. We’ve been banging on about this for years (see comment from 2011 here), and Jim is worried he hasn’t got anything to write about anymore. Jim typed up a few thoughts after the much smaller 4% Consol was called in October, here are mine.
Calling the 3.5% War Loan is a much bigger deal than the 4% Consol that was called just over a month ago. The 4% Consol is only £218.5m in size, while the 3.5% war loan is £1.938.8bn in size so is almost 10 times larger. [It’s still not exactly big though – by way of comparison, the biggest gilt outstanding, the 4.75% 2015, is £38.3bn in size].
Refinancing the 3.5% war loan and 4% consol makes a lot of economic sense, as we and others have argued. But the political rhetoric that accompanied the first announcement in particular makes far less sense (today’s announcement has been toned down as bit). The stark reality is that the effect on the UK’s finances is negligible – depending upon where the gilts that refinance these bonds are issued, the decision in October to call the 4% Consol will be a saving to the taxpayer of between £2m and £3m per year, while calling the 3.5% War Loan will save around £15m per year. It’s still worth doing, but to put these numbers in context, the UK’s budget deficit this year is likely to be a bit above £90bn. Refinancing these perpetual gilts will trim the deficit by less than 0.02%.
Despite today’s toned down announcement, we’d still take issue with both the Treasury statement that the “very low interest rate environment…in part reflects confidence in the plan the government has put in place to cut borrowing and create a resilient economy” and George Osbourne’s comment that calling the war loan “is a sign of our fiscal credibility”. Government bond yields have hit record lows around the world – this is a global phenomenon, not a UK one. If bond yields were a measure of economic strength, then why are Spain’s 10 year bond yields lower than the UK’s? Why did almost every country in the Eurozone see record low bond yields earlier this week (Greece is the major exception)? And why does Japan, one of the most indebted countries in the world, currently have 10 year bond yields at just 0.44%?
You can take the argument above further. If anything, very low government bond yields could be the market signalling its concern about very weak long term growth prospects. Below is a chart showing long dated gilt yields going back a very long way. Note the correlation with nominal GDP. So given that nominal GDP is equal to real GDP plus the inflation rate, low gilt yields today are telling us that either real GDP is expected to be very low, or inflation is expected to be very low, or a combination of the two. Looking at the index-linked gilt market, it appears that a lot of what’s driving nominal gilt yields lower is the poor growth outlook, given that very long term UK inflation expectations are almost bang in line with the average of the last 5 years (30 year breakeven inflation rates, which are priced off RPI, are 3.34%).
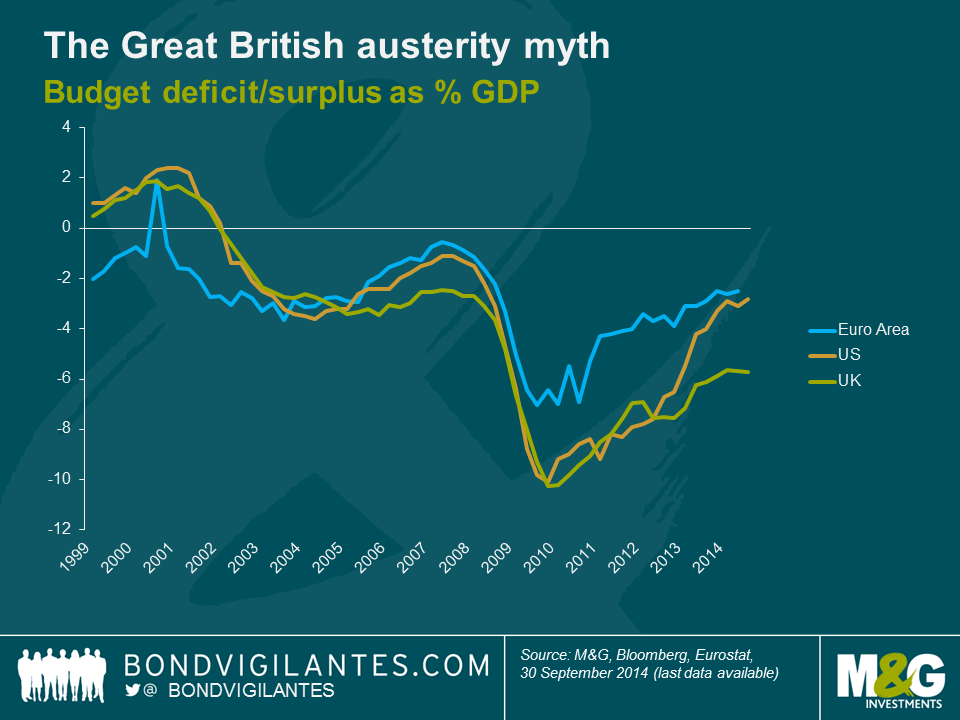
And finally are the UK’s finances really that strong? Beware the Great British Austerity Myth, as I’ve argued previously. Updated chart below.


Sign up to the Bond Vigilantes mailing list to ensure you never miss a great article from our expert Bloggers. We will email all new articles to your inbox, meaning you can stay on top of the world of Bonds.
I confirm that I would like to receive information about Bond Vigilantes and products and services from M&G Securities Limited.
We will use the email address and personal data you have shared with us to send you this information. For existing customers, submitting your contact details and requesting to receive this information from us, will replace any earlier choices you have made in respect of marketing information.
You can unsubscribe from marketing at any time, at which point we will not send any further marketing information to you, by selecting the unsubscribe link in all communications.