
Seeking relative value in USD, EUR and GBP corporate bonds
In terms of investment grade credit, it has been a common theme for global fixed income investors to think of EUR denominated credit as relatively expensive versus USD credit. Conversely, many see GBP corporate bonds as relatively cheap. But can it really be as simple and clear-cut as this? To answer this question, I have compared monthly asset swap (ASW) spreads of IG credit, issued in these three currencies, both on an absolute spread and a relative spread differential (EUR vs. USD and GBP vs. USD) basis.
At first, I looked at the three BoAML corporate master indices for publicly issued IG debt, denominated in USD, EUR and GBP. As shown below, until the onset of the financial crisis in the middle of 2007, USD IG credit was trading at spread levels of around 50 bps, which is almost exactly in line with GBP and on average only 15 bps wider than EUR IG credit. During the financial crisis, USD spreads widened more dramatically than EUR and GBP spreads. At peak levels in November 2008, when USD spreads reached 485 bps, EUR and GBP credit spreads were significantly tighter (by 215 bps and 123 bps, respectively). Subsequently, GBP IG spreads surpassed USD spreads again in May 2009 and have been wider ever since.
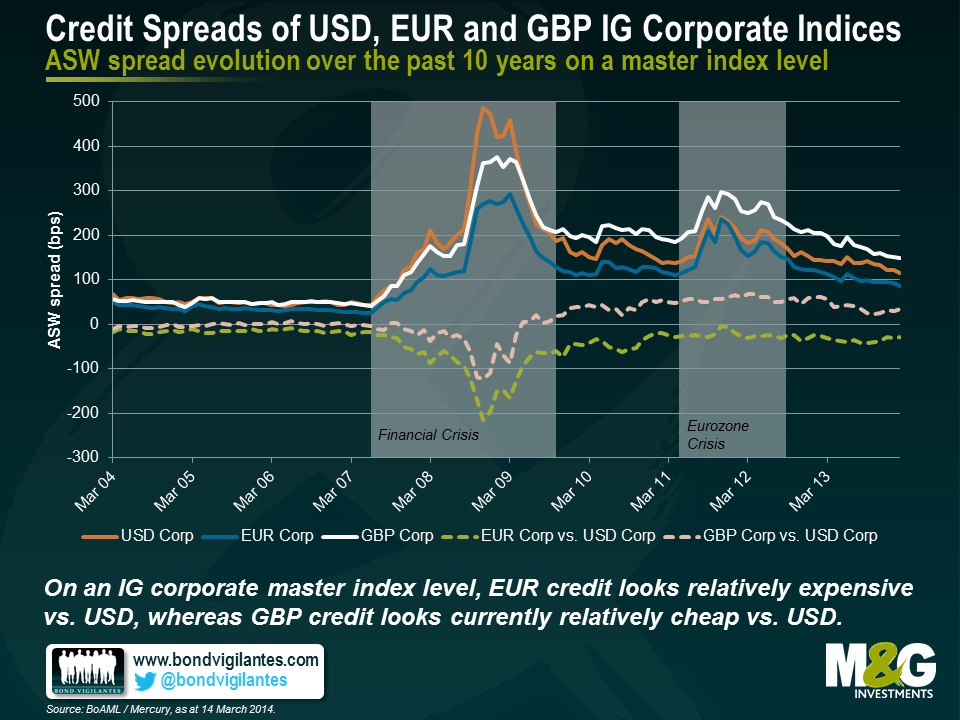
In contrast, EUR IG credit spreads have been consistently tighter than USD spreads. Even at the height of the Eurozone crisis in late 2011, the EUR vs. USD credit spread differential was negative, if only marginally. Over the past three years, USD IG credit has been trading on average at a spread level of 166 bps, i.e., nearly 30 bps wider than EUR IG credit (137 bps average spread) and c. 50 bps tighter than GBP IG credit (215 bps average spread). Hence, when only looking at an IG corporate master index level, it is justified to say that subsequent to the financial crisis EUR credit has been looking relatively expensive and GBP credit relatively cheap compared to USD credit.
Taking only headline master index spreads into consideration is an overly simplistic approach. A direct comparison between the USD, EUR and GBP corporate master indices is distorted by two main factors: index duration and credit rating composition. As shown below, there are substantial differences in terms of effective index duration between the three master indices. Over the past ten years, the effective duration of the USD master index has been on average 6.2, whereas the EUR and the GBP indices exhibited values of 4.4 and 7.3, respectively. Currently, index duration differentials account for -2.1 (EUR vs. USD) and 1.4 (GBP vs. USD).
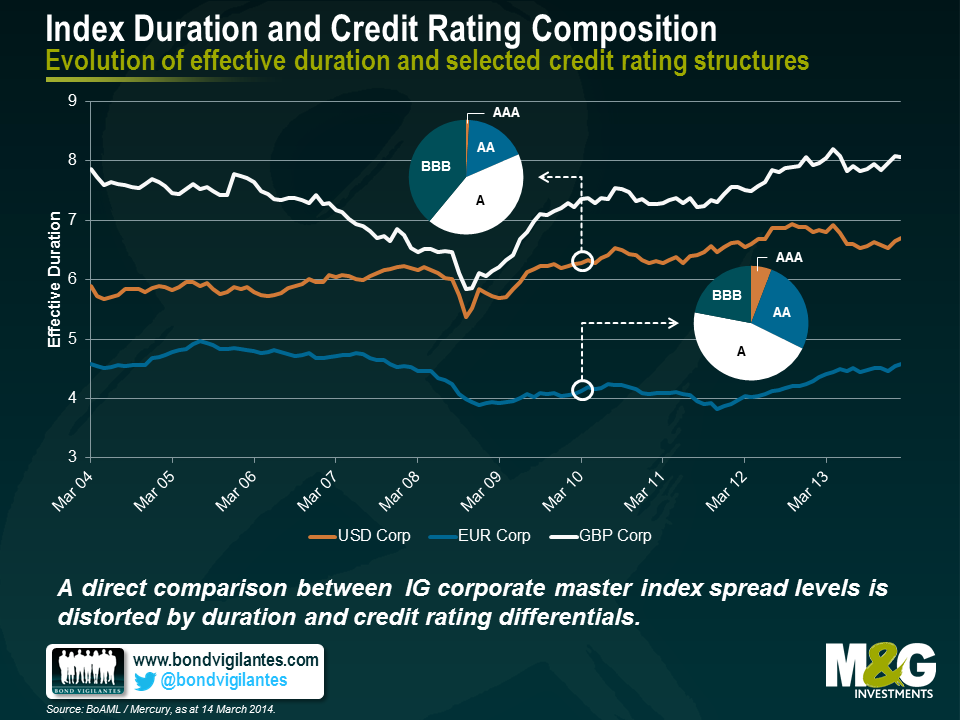
These significant deviations in duration, and thus sensitivity of bond prices towards changes in interest rate, render a like-for-like index comparison problematic. The same applies to differences in credit rating composition. Take, for example, the rating structures of the USD and the EUR master indices in March 2010. Whereas the USD index hardly contained any AAA (below 1%) and only c. 18% AA rated bonds, the EUR index comprised nearly 6% AAA and c. 26% AA bonds. In contrast, the ratio of BBB bonds was significantly higher in the USD index (almost 40%) than in the EUR index (c. 22%). The credit quality on that date was distinctly higher for the EUR index than for the USD index, and directly comparing both indices would therefore be a bit like comparing apples to… well, not necessarily oranges but maybe overripe apples, for lack of a more imaginative metaphor.
Duration and credit rating biases can be removed from the analysis – or at least materially reduced – by using bond indices with narrow maturity and credit rating bands. As an example, I plotted relative spread differentials (i.e., EUR vs. USD and GBP vs. USD) for the past 10 years, based on the respective BoAML 5-10 year BBB corporate indices. To add another layer of complexity, this time I did not use headline corporate index level spreads but differentiated between financials and industrials instead. As only relative spread differences are shown, positive values indicate relatively cheap credit versus USD credit and, conversely, negative values signal relatively expensive credit.
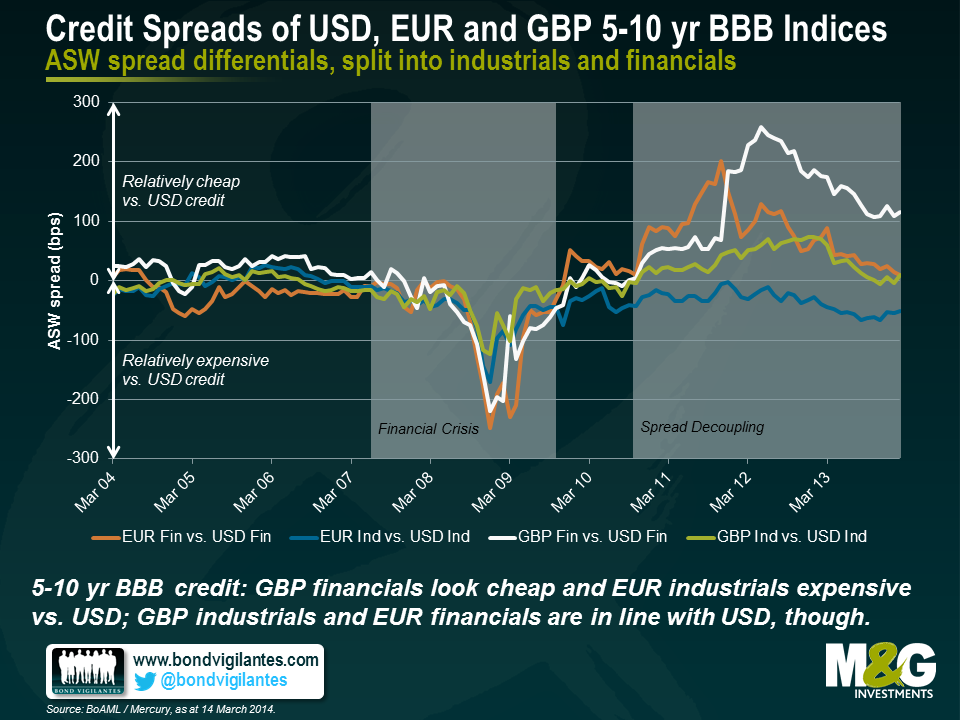
Until October 2010, the graphs follow a very similar path, EUR and GBP credit spreads trade fairly in line with USD spreads up to the financial crisis, when USD spreads widen more strongly than both EUR and GBP spreads, pushing spread differentials temporarily into deeply negative territory (below -220 bps in the case of financials). Then things got more interesting as spread differentials seem to decouple to a certain extent from October 2010 onwards. At this level of granularity it becomes clear that it is an inaccurate generalisation to refer to EUR credit as expensive and GBP credit as cheap versus USD credit.
In terms of 5-10 year BBB credit, EUR financials have in fact been trading consistently wider than USD financials, although the spread difference has been falling considerably from its peak Eurozone crisis level of 201 bps in November 2011 to currently only 10 bps. EUR industrials have been looking more expensive than USD industrials since early 2007 (c. 35 bps tighter on average over the past 3 years). The trajectory of GBP financials spread differentials has been broadly following the EUR financials’ humped pattern since late 2010, rising steeply to a maximum value of 259 bps in May 2012 and subsequently falling to current values at around 115 bps. GBP industrials have been looking moderately cheap compared to USD industrials since late 2010 (c. 37 bps wider on average over the past 3 years), but the spread differential has recently vanished. Hence, regarding 5-10 year BBB credit, currently only GBP financials are looking cheap and EUR industrials expensive versus the respective USD credit categories, whereas GBP industrials and EUR financials are trading in-line with USD credit.
To sum things up, when comparing USD, EUR and GBP IG credit, headline spreads are merely broad-brush indicators. To get a greater understanding of true relative value, it is worth analysing more granular data subsets to understand the underlying dynamics and the evolution of relative credit spread differences.
The value of investments will fluctuate, which will cause prices to fall as well as rise and you may not get back the original amount you invested. Past performance is not a guide to future performance.
17 years of comment
Discover historical blogs from our extensive archive with our Blast from the past feature. View the most popular blogs posted this month - 5, 10 or 15 years ago!


Bond Vigilantes
Get Bond Vigilantes updates straight to your inbox