World Cup
The Bond Vigilantes World Cup Model
By Joe Sullivan-Bissett
11 June 2026


1. What’ s happened to the high yield market in the last month?
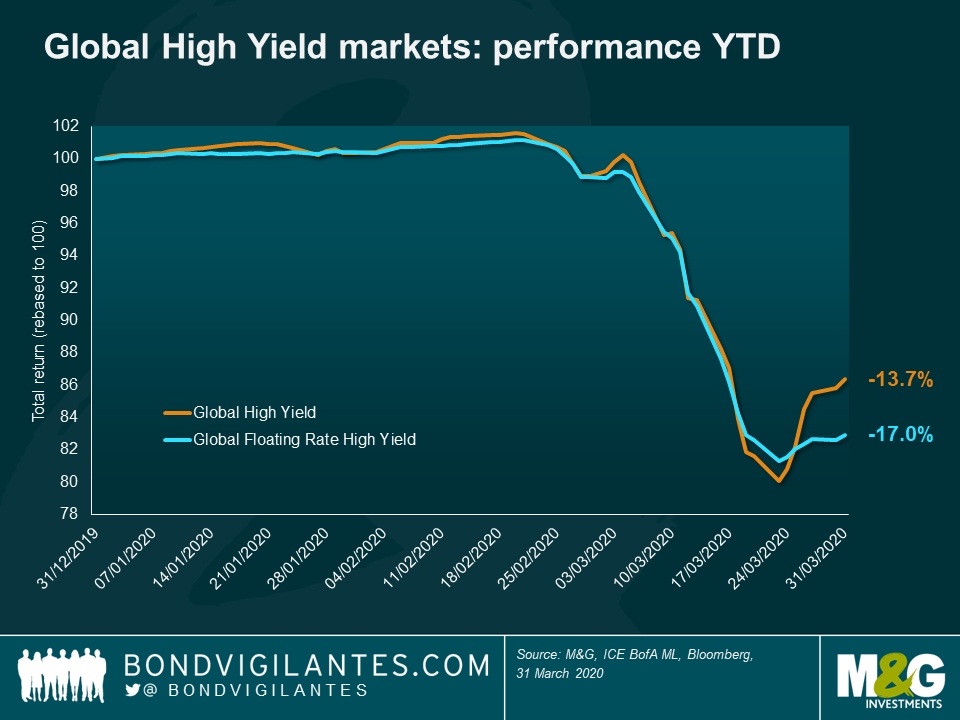
We’ve seen negative returns of -12.7% for the global high yield market. Following a weak February this brought the Q1 return to -13.7%. To put this in context, this was the second worst month and second worst quarter since 1998. Only October 2008 and Q4 2008 saw a more negative drawdown for the market.
2. Can it get worse?
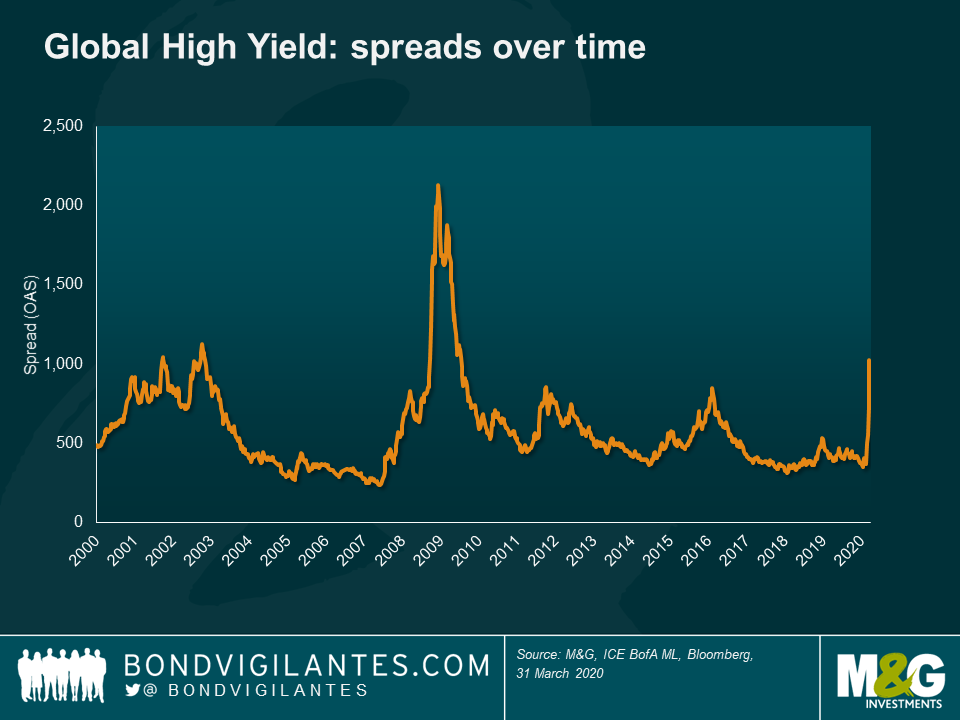
Yes, but I think probably not that much worse. Over the long term, spreads have been wider (topping out at over 2,000 basis points following the Lehman Brothers bankruptcy – see the chart below), and they are currently hovering at just under 1,000 basis points. It is hard to pinpoint the bottom of this particular market cycle. It may have been a few days ago, it could be in a few months’ time, but what gives me some hope and comfort that it might not get much worse is that:
3. Will there be more defaults?
Definitely. Global default rates were in the low single digits for high yield coming into this. There is no doubt that we will see more companies restructuring their debts and in some cases failing altogether and going into liquidation. I would make two points here:
On the other hand, food retailers, packaging businesses, Technology, Media and Telecom companies, pharmaceuticals and healthcare operators (which are all big parts of the High Yield market) will either see relatively limited impact to their businesses or in fact an upturn.
4. So defaults are going to rise but what’s priced in in terms of default rates?
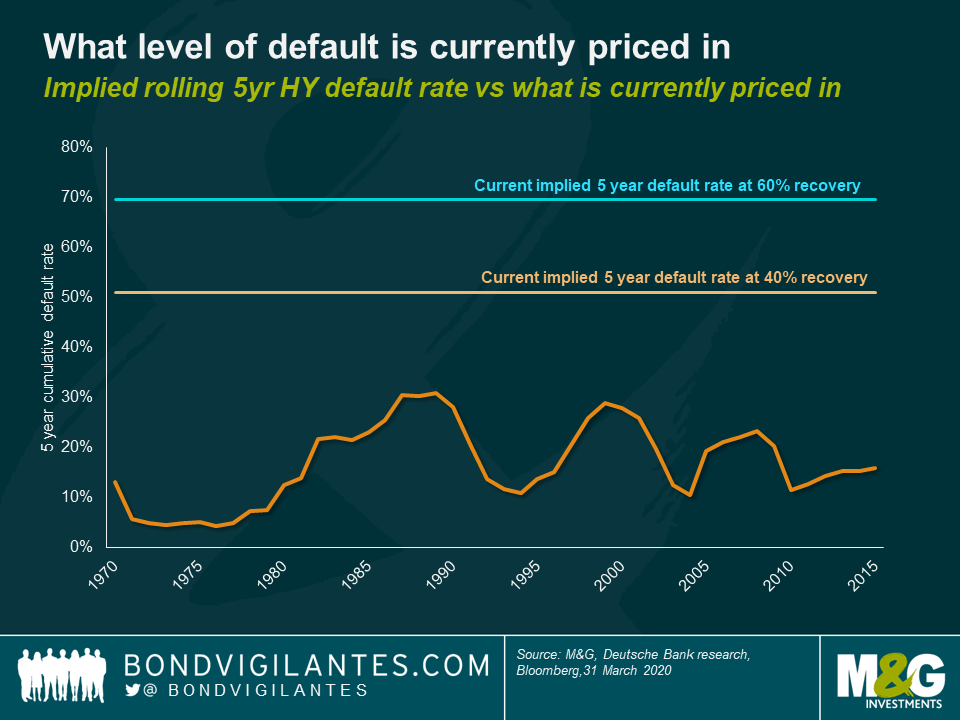
Quite a lot of the bad news is priced into spreads, and then some. If we look at the chart below, five year cumulative default rates of a little over 50% are now priced into the market (assuming a 40% recovery). For investors focused on senior secured debt (e.g. senior loans and FRNS), the implied default rate in spreads is even more pessimistic at just under 70% over five years (assuming a 60% recovery). As we can see below, historically, the peak for five year default rates has been 31%. I would argue that the market is already pricing in a very extreme and painful scenario for defaults. Of course there will be losses for bondholders, but I struggle to see losses of this magnitude. Consequently, I think high yield valuations currently look cheap.
5. What’s the potential upside for investors?
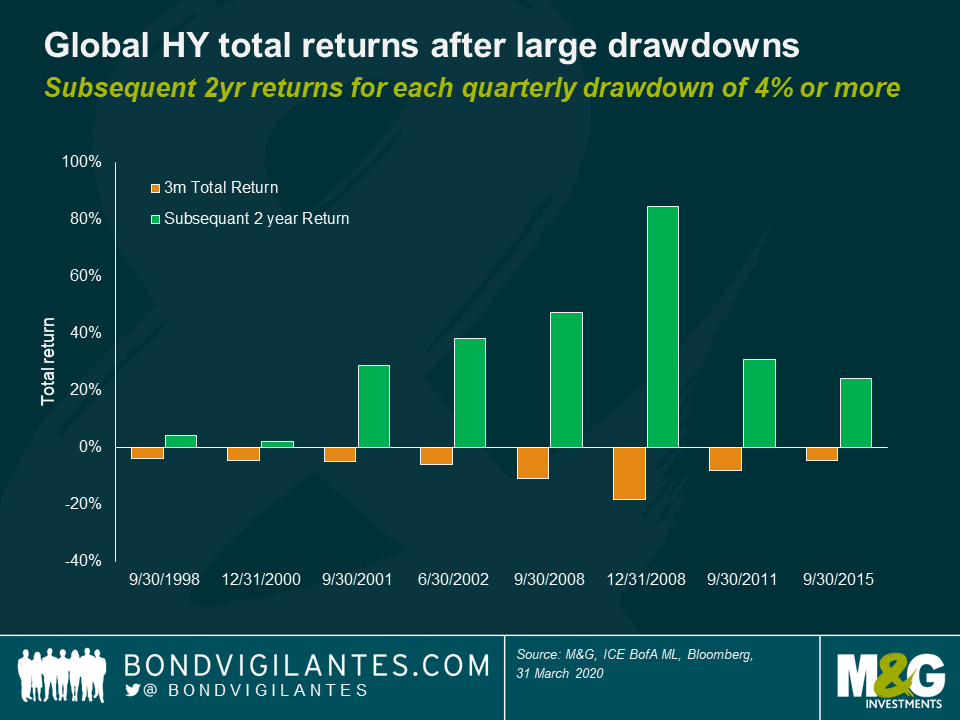
In the short term, no idea. The market is still very volatile and fairly illiquid. We could well see more short term losses rather than gains. However, in the medium to long term (e.g. a time horizon of say two years), the potential returns could be meaningful. Again, if history is any guide, the chart below shows the subsequent two year returns from the global high yield market following a quarterly drop of 4% or more. Over the past 20 years, this has always generated a positive return, and indeed over the last six such dips the returns have been in excess of 20% over the following two years. This is not inconceivable either at this point in time. If for example the market has a spread of 1000 basis points, and in two years’ time this normalises to circa 400 basis points (a level consistent with more recent history), with four years of spread duration that would mean a potential capital gain of 24%. So all in all, certainly not without risk, volatility and defaults, but also potentially quite rewarding.
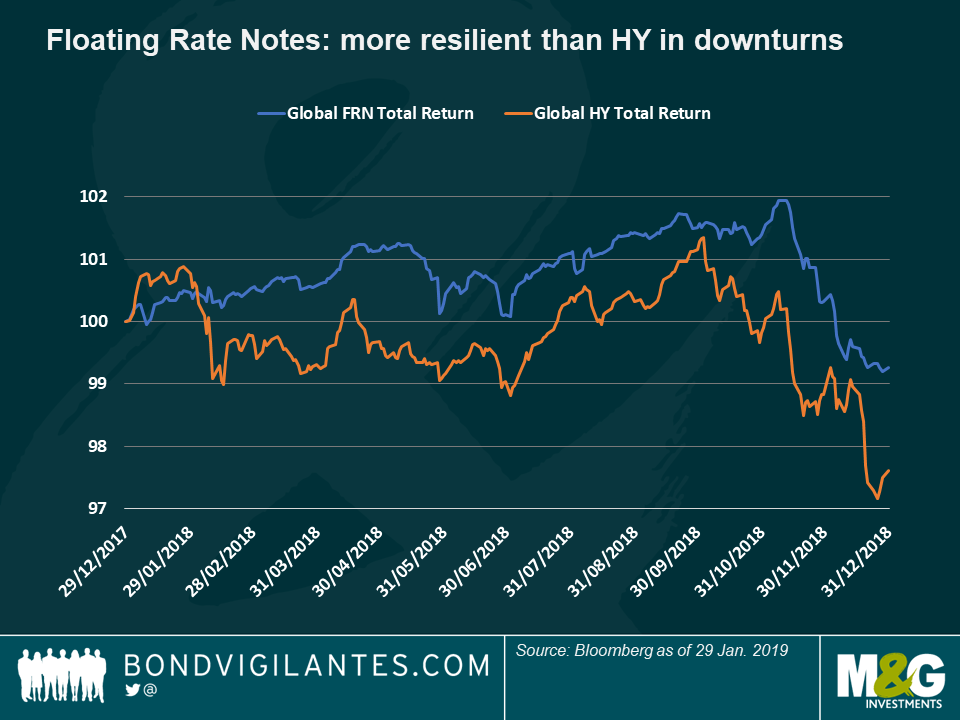
As we all know, 2018 turned out to be a tough year for most asset classes, not least High Yield (HY) bonds. The sell-off in the fourth quarter was particularly quick and brutal compared to the recent lulls of benign volatility under the blanket of central bank largesse. Global HY lost a few percentage points in pure local currency terms in 2018, whilst the lower beta and more senior secured heavy Floating Rate Note (FRN) market held up a little better with a loss of just under 1%. This was a timely reminder that the HY FRN market (which shares many risk characteristics with the senior loan market, including its senior secured nature and floating coupon) is typically less volatile than conventional fixed rate HY bonds in periods of market corrections.
Where does that leave investors looking at 2019? Should they favour floating rate or fixed rate HY?
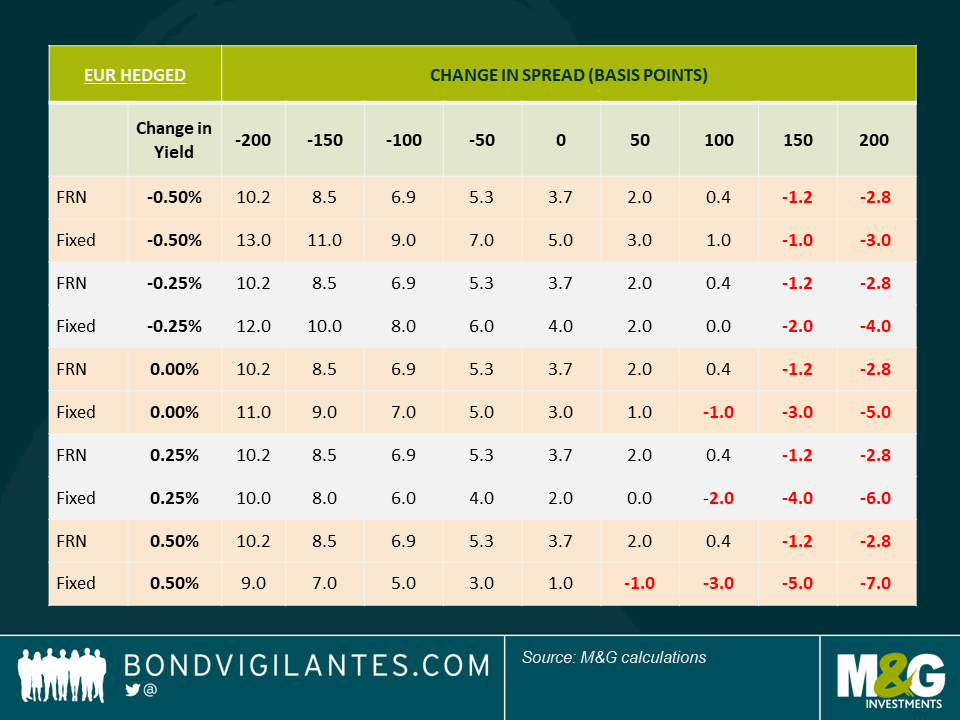
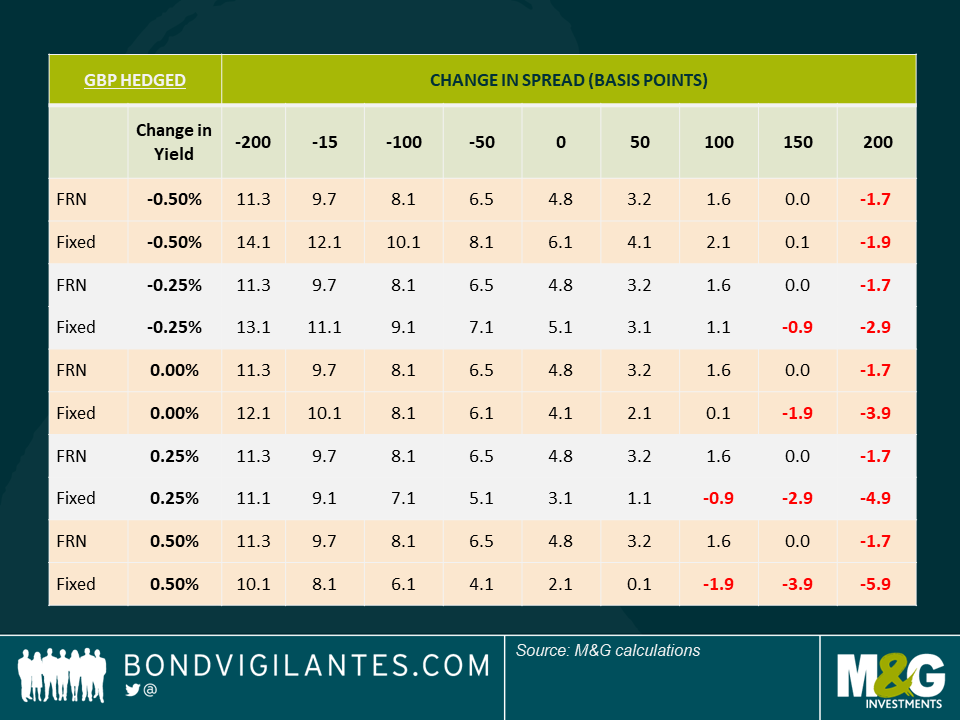
To try and answer this question, I’ve outlined below some total return scenarios based on different changes in spreads and interest rates. These scenarios also take into account an estimate of one-year currency hedging costs in order to give a fully hedged return. I have assumed a 1.5% default rate, with an average recovery rate of 30% for the fixed HY market and a higher 60% for the floating market. I am also assuming that any change in yields is purely a steepening / flattening move, meaning that there are no further rate hikes over the following 12 months. See below the 3 scenarios – for fully hedged US, Euro and UK-denominated FRNs and HY bonds.
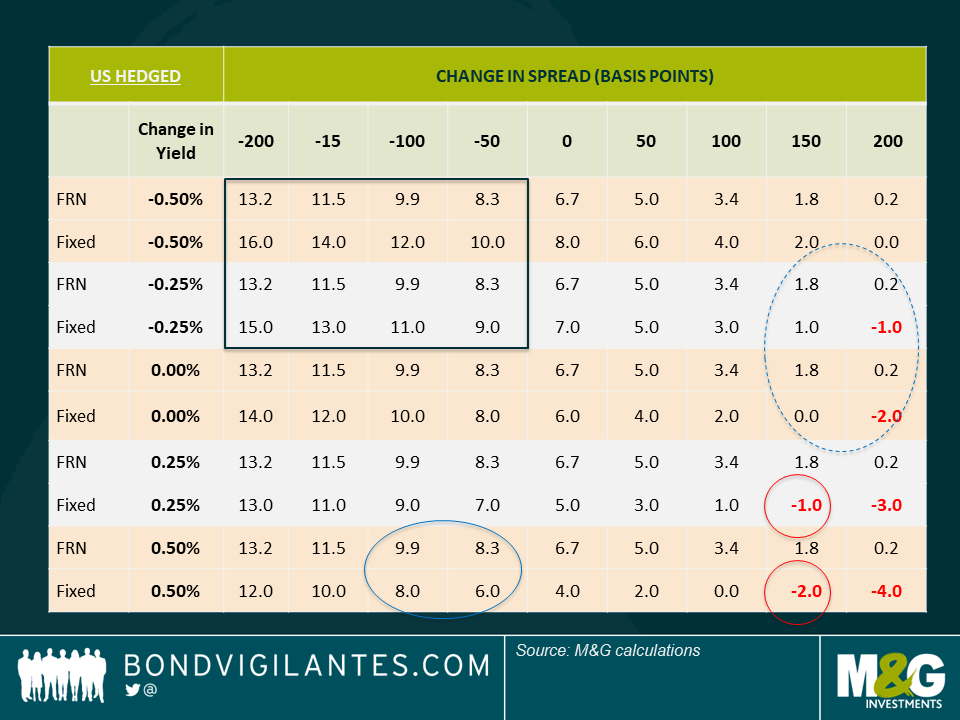
What can we infer from the above?
Given the relative strength of the US and global economy, a return of QE is quite unlikely – in my view, this should give an edge to FRNs in most likely return scenarios. I do have to caveat that this is based on several assumptions, so should be taken as theoretical. Also, there are other variables that would also have an impact, including FRN’s lack of capital upside, as they trade close to par, and any increase in default rates above 1.5%.
Having said that, the inherent resilience of FRNs, through their low spread and interest rate duration, could be a good tailwind for the asset class in 2019. This could well be a good year for floating rate High Yield.
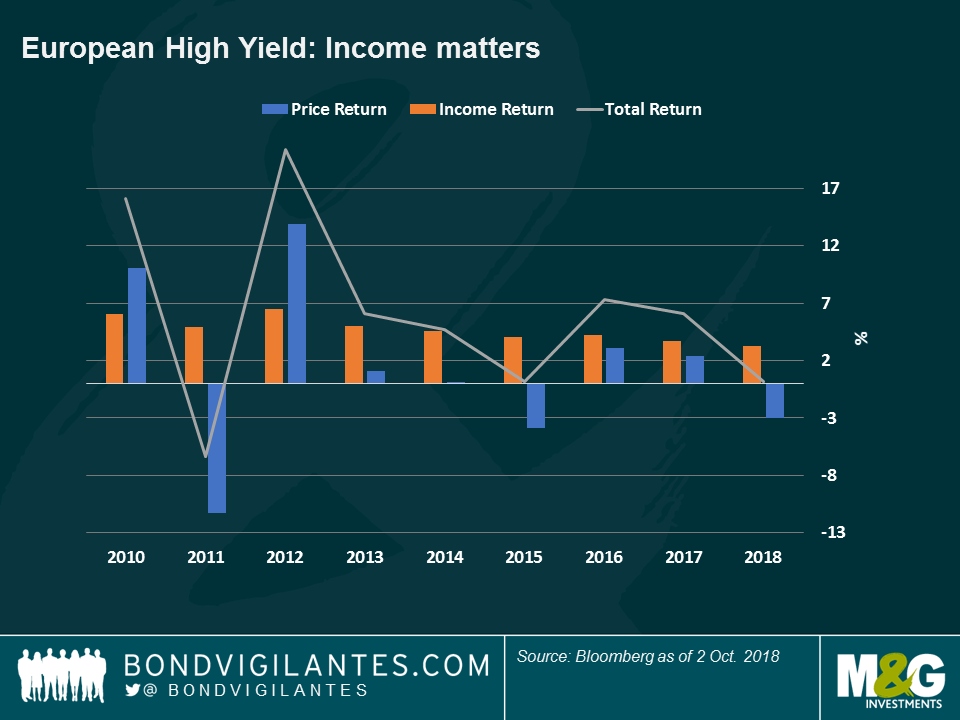
This has not been a vintage year for total returns in the European High Yield market: wider spreads have led to small capital losses, barely offset by a relatively low income of 3.2%, which has resulted in an anaemic total return of 0.22% year to date. Unexciting and dull? Yes, but only if one looks at the surface. The underlying trends are far more interesting – and relevant for investors.
Every year, the High Yield market tends to have some idiosyncratic outliers which experience severe price drops – this is par for the course and avoiding them is a manager’s skill – but it feels like the number of and severity of such moves has increased this year, as you can see in the chart below:
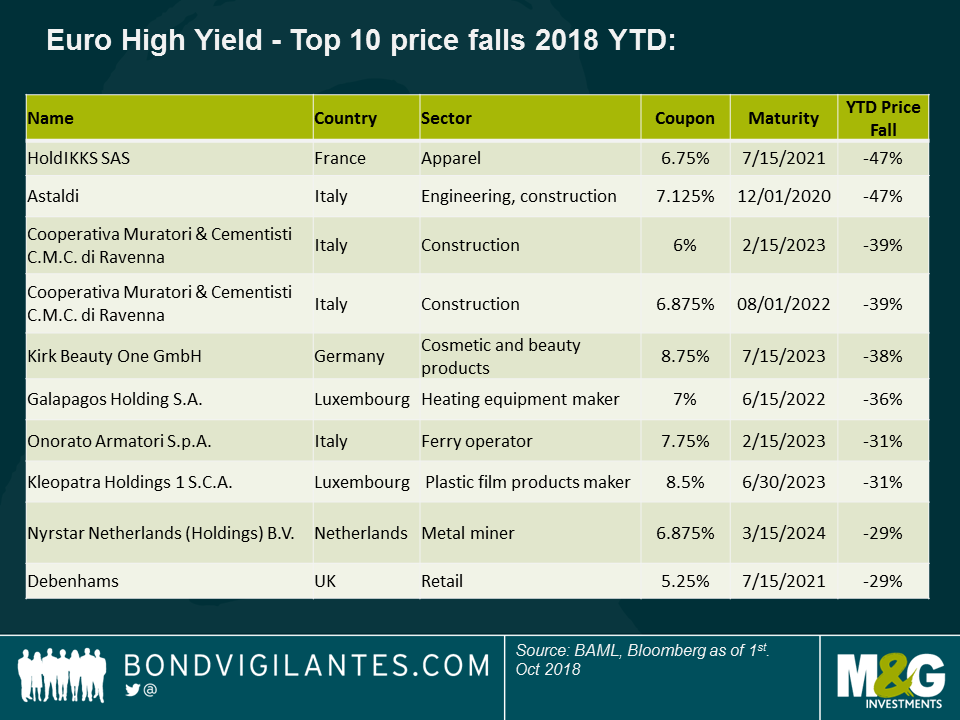
From the table, we see that the Retail and Construction sectors stand out. Starting with the first, the challenges that online shopping are giving retailers are well documented and very much still being felt: the bonds of UK department store chain Debenhams, German cosmetics retailer Douglas and French retailer IKKS have all continued to underperform as more and more shoppers prefer a mouse click than a trip to the store.
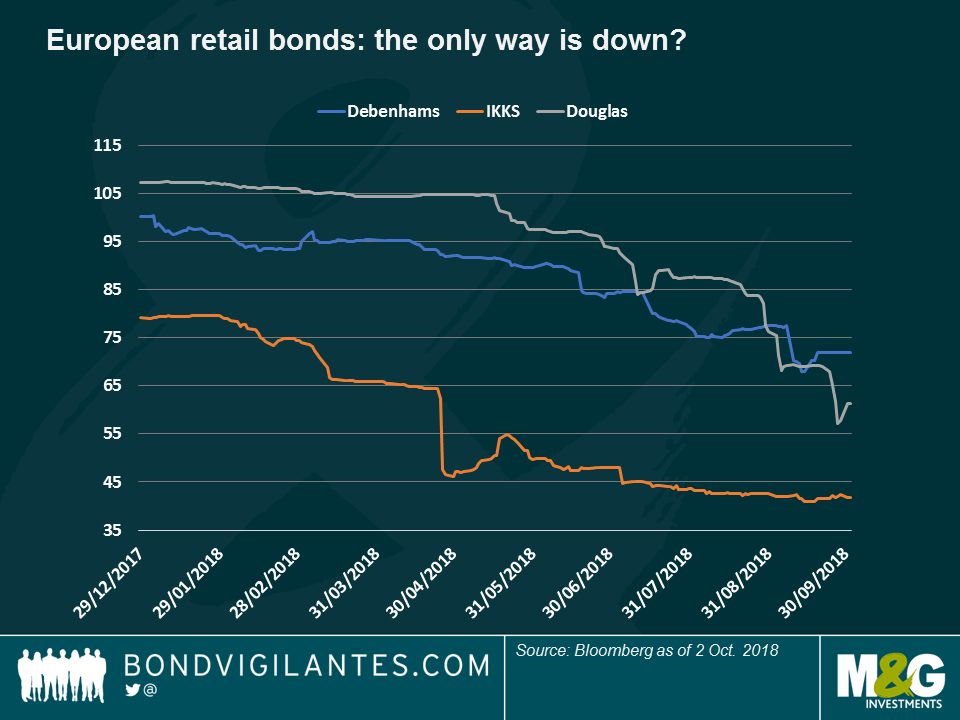
This, however, should not raise too many eyebrows as this negative sector trend has been well known for a while and the bond price drops have been more of a slow burn rather than a cliff edge-type decline, as the chart shows. Old habits die hard.
In contrast, the Construction sector has behaved differently: the speed and the severity of the drop in the bonds of Italian construction firms CMC Ravenna and Astaldi have occurred over a much tighter time scale, as seen below. These companies have suffered from poor results and in the case of Astaldi, a failed disposal and capital raise.
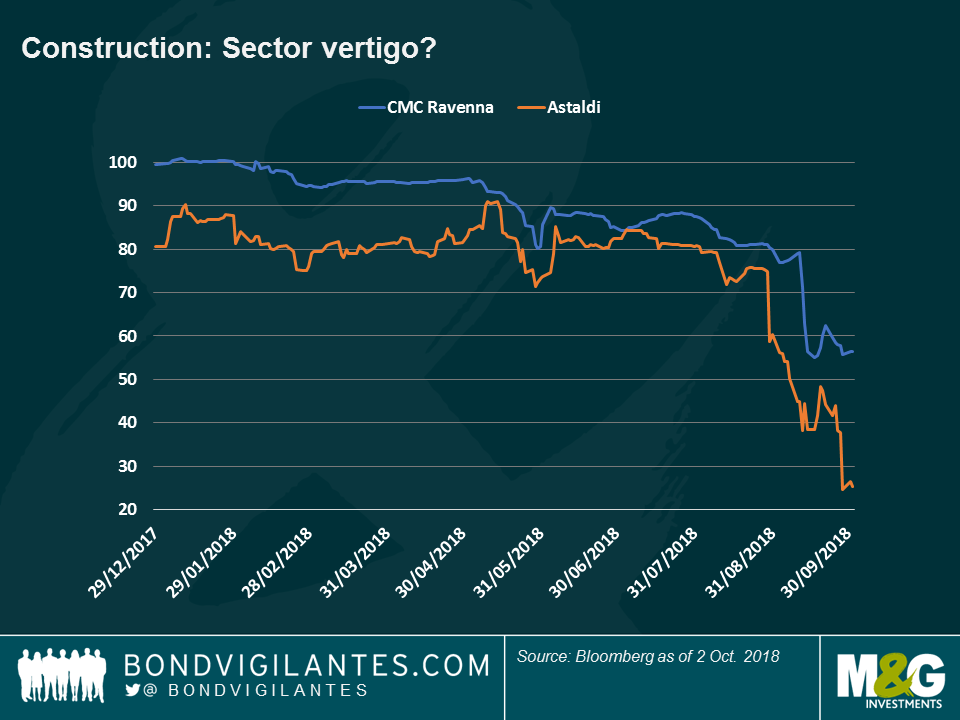
Here we can see the “cliff edge” in full force, and it suggests that the precipitous drop is more sudden, so maybe not due to long term fundamental challenges, which tend to brew over an extended period of time. What’s happening? Two thoughts spring to mind:
These situations are telling us that the present low yield, tight spread and slowing-growth European environment is making High Yield bonds behave differently to what we have seen in the past. Because of this, I think European High Yield investors should be even more cognisant of asymmetric risk to the downside than usual. Reaching for an extra 50 – 100 basis points of yield here and there can all too easily be wiped out by a sudden 25% fall in the price of one single holding. As ever, High Yield is a bottom-up market and thorough selection is paramount.
Short term US dollar interest rates continue their march higher. 3-Month USD LIBOR recently hit 1.61%, fuelled by the Fed’s 25 basis point hike on December 13th, a level last seen in late 2008. With further rate hikes on the horizon in the US and a potentially more hawkish European Central Bank, is 2018 the year when floating rate high yield meaningfully outperforms its fixed rate cousin?
The short answer is: “probably yes” for a EUR investor and a somewhat unsatisfying “maybe” for a USD investor.
Looking at a simple scenario analysis for 1 year total returns, I take two theoretical USD portfolios (one of high yield floating rate notes and the other high yield fixed rate bonds), both priced with a spread of 250bps to normalise the relative impact to returns, and flex the total return of each portfolio to take into account three rate hikes from the Fed (the current market consensus view) and a change in yield curve (i.e. a move that would mean an interest rate duration related capital gain or loss for the fixed rate portfolio).
It should be noted, however, that I have not considered the relative impact of a move in credit spreads or default rates, which is another very important driver of returns for high yield. I would expect floating rate high yield to outperform fixed rate high yield in a spread-widening sell-off or if we saw higher default rates (floating rate bonds tend to have less spread duration and are more heavily skewed to senior secured instruments), and vice versa. The numbers below do not take this into account.
The results above show that the market would need to see a moderate move higher in US treasury yields before floating rate high yield outperforms fixed rate high yield. In fact, the breakeven level is 34bps in this case. Some hikes are already reflected in the steepness of the US treasury curve at the front end, so investors are already to some extent compensated for the fact that the Fed is maintaining its hawkish stance. Floating rate high yield would be better placed to outperform if we saw more than three hikes or if a subsequently more hawkish stance was priced into the fixed rate market. The perception that floating rate bonds outperform when interest rates are rising in not always true.
| USD – (three hikes and steeper/flatter yield curve)
|
||||||||
| Change in yield (bps) | -75 | -50 | -25 | 0 | 25 | 50 | 75 | |
| FRN HY 1yr total return | 4.42% | 4.42% | 4.42% | 4.42% | 4.42% | 4.42% | 4.42% | |
| Fixed HY 1yr total return | 8.73% | 7.75% | 6.76% | 5.77% | 4.78% | 3.80% | 2.81% | |
How about EUR based investors? Below is the same exercise, but I assume no change to EURIBOR at -0.39% (i.e. no hikes from the ECB), but flex the yield curve as before.
| EUR – (no hikes and steeper/flatter yield curve)
|
|||||||
| Change in Yield (bps) | -75 | -50 | -25 | 0 | 25 | 50 | 75 |
| FRN HY | 2.11% | 2.11% | 2.11% | 2.11% | 2.11% | 2.11% | 2.11% |
| Fixed HY | 5.29% | 4.33% | 3.38% | 2.42% | 1.47% | 0.51% | -0.45% |
What is interesting here is that the flat government bond curve works against fixed rate investors. European government bond yields would have to sell off by only 8bps before floating rate high yield outperforms. Any marginal repricing of ECB intentions to a more hawkish scenario, therefore, would mean investors are much better off in floating rate bonds, not because they benefit from higher coupons as interest rates rise, but rather because they have almost zero sensitivity to moves in the government bond markets.
Yesterday we saw Inter Milan issue the first football related high yield bond since we saw Manchester United tap the market back in January 2010. Putting aside the natural tribalism of 2 of my esteemed colleagues (both Italian, both ardent AC Milan supporters), we decided not to invest in the €300m 4.875% 2022 bond.
In terms of fundamentals, legal claim, and relative value, the bond stacks up fairly well. Inter Milan is a well-established club with a solid fan base and is currently top of the table in Serie A. As such the club is well placed to generated sustainable revenue from broadcast rights and monetise its brand through sponsorship deals. The risk to revenue, at this stage at least, from sustained poor performance on the pitch seems low. This is important as the bond is structured in a way that means bondholders are effectively lending against the cash flow generated by the club’s media and sponsorship agreements, not the cash flow of the club as a whole. Crucially, this removes a major potential negative factor: the issue of cost inflation in the form of ever-increasing wage demands from players.
Also, at 4.875% for a BB- rated bond, the coupon looks good value compared to the rest of the European High yield market with average yields for BB corporates at 1.8% and 2.5% for the high yield market as a whole.
So what’s the problem? In our view the key issue is how the bond’s maturity profile and potential cash flow is mismatched. The bonds are subject to the following amortisation schedule:
Mandatory Amortization Redemption and Principal Repayment Date Principal Amount
December 31, 2018 . . . . . . . . . . . . . . . . . . . . . . . . . . . . . . . . . . . . . . . . . . . . . . . . . . . € 3,100,000
June 30, 2019 . . . . . . . . . . . . . . . . . . . . . . . . . . . . . . . . . . . . . . . . . . . . . . . . . . . . . . . € 3,150,000
December 31, 2019 . . . . . . . . . . . . . . . . . . . . . . . . . . . . . . . . . . . . . . . . . . . . . . . . . . . € 3,250,000
June 30, 2020 . . . . . . . . . . . . . . . . . . . . . . . . . . . . . . . . . . . . . . . . . . . . . . . . . . . . . . . € 3,300,000
December 31, 2020 . . . . . . . . . . . . . . . . . . . . . . . . . . . . . . . . . . . . . . . . . . . . . . . . . . . € 3,400,000
June 30, 2021 . . . . . . . . . . . . . . . . . . . . . . . . . . . . . . . . . . . . . . . . . . . . . . . . . . . . . . . . € 3,500,000
December 31, 2021 . . . . . . . . . . . . . . . . . . . . . . . . . . . . . . . . . . . . . . . . . . . . . . . . . . . . € 3,550,000
June 30, 2022 . . . . . . . . . . . . . . . . . . . . . . . . . . . . . . . . . . . . . . . . . . . . . . . . . . . . . . . . € 3,650,000
December 31, 2022 . . . . . . . . . . . . . . . . . . . . . . . . . . . . . . . . . . . . . . . . . . . . . . . . . . . €273,100,000
In this case, the amortisation is welcome, but the amounts that are mandatorily repayable seem insignificant relative to the outstanding amount of debt. Over €270m of an original €300m issued is effectively a bullet maturity. At the same time, if the club meets certain financial tests, any surplus cash flow generated by broadcast and media rights can then be distributed to other entities over which the bondholders have no legal recourse. This could mean, in extremis, that the structure re-leverages over the life of the bond with increased re-financing and credit risk even if the club performs well and monetises this success.
So despite being undisputedly the best football club in Milan right now, we think the devil is in the detail when it comes to Inter’s debut bond issue.
After the surprise election result, market reaction within the European high yield market has been surprisingly muted. Here are a few key moves that show how the news is being digested.
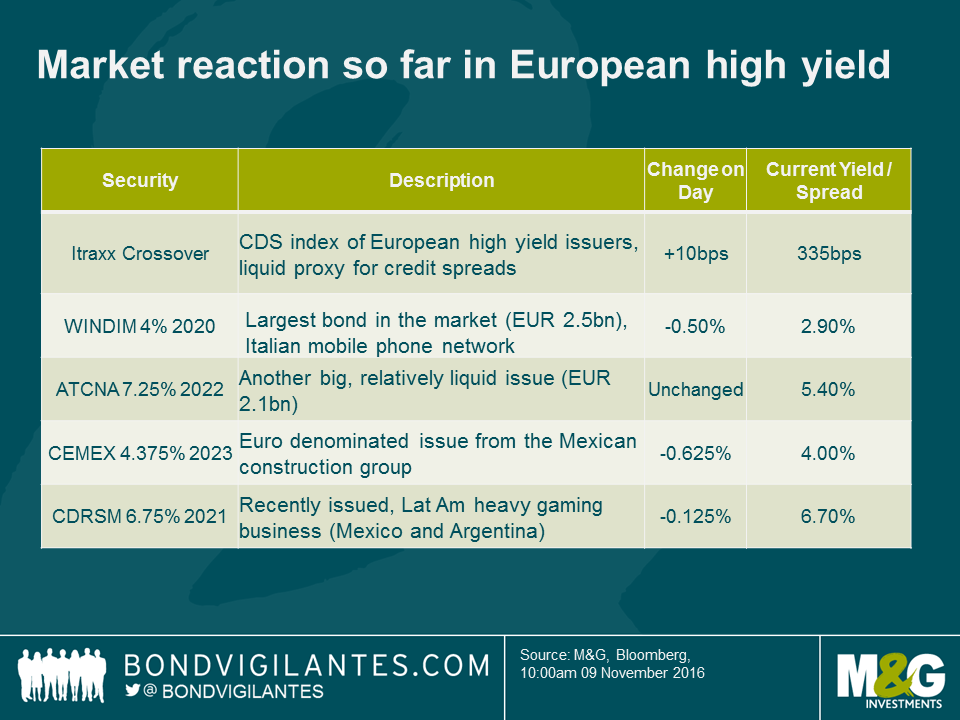
In general, the market seems to be pricing in little to no impact for European risk premia, and even for the more potentially directly impacted companies in Latin America, the re-pricing has been very mild.
It seems investors are looking through any short term uncertainty and seeing looser fiscal policy as a boon to nominal growth, something that should be positive for most high yield businesses. Cemex, for example, has a major presence in the US domestic market – in one of those ironies, it could end up being a major supplier to a Trump infrastructure programme.
With the market currently pricing in an 84% chance of a US interest rate hike in December it appears likely that there is some pressure for bond yields to move higher on a medium term view. This is on top of the re-pricing that we have already seen in risk-free assets like US Treasuries over the course of the past four months. High yield assets are not immune from the laws of bond maths, with longer duration assets suffering in the current rising yield environment. In my opinion, there are four reasons why high yield investors should be looking to the floating rate note market to help manage their exposure to interest rate risk at this point in the cycle.
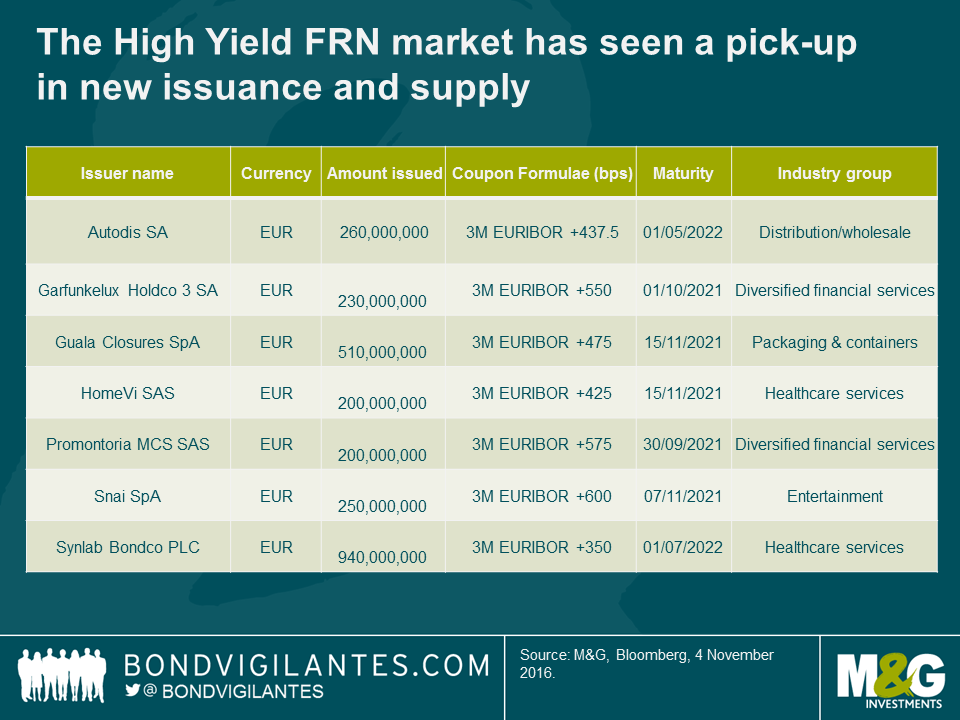
The High Yield FRN market is seeing a pick-up in new issuance and supply at the moment. As a relatively small but developing area of the bond market this is important, as this allows investors increased choice and diversification. The chart below shows a selection of new issue deals we have seen over the past few weeks.
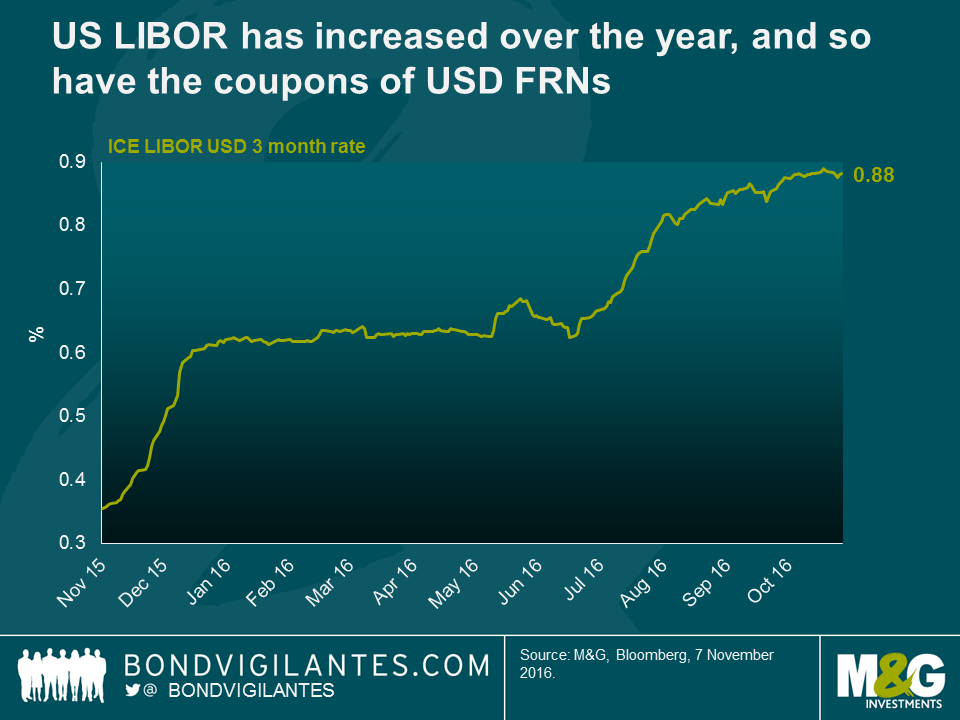
For US dollar investors, floating rate notes have benefitted greatly from the re-pricing of risk in money markets. As US LIBOR has increased over the year to c. 0.90%, so have the coupons of all USD floating rate portfolios, with no associated hit to capital values. Further interest rate hikes from the Fed over coming months could see subsequent increases in USD LIBOR going forward.
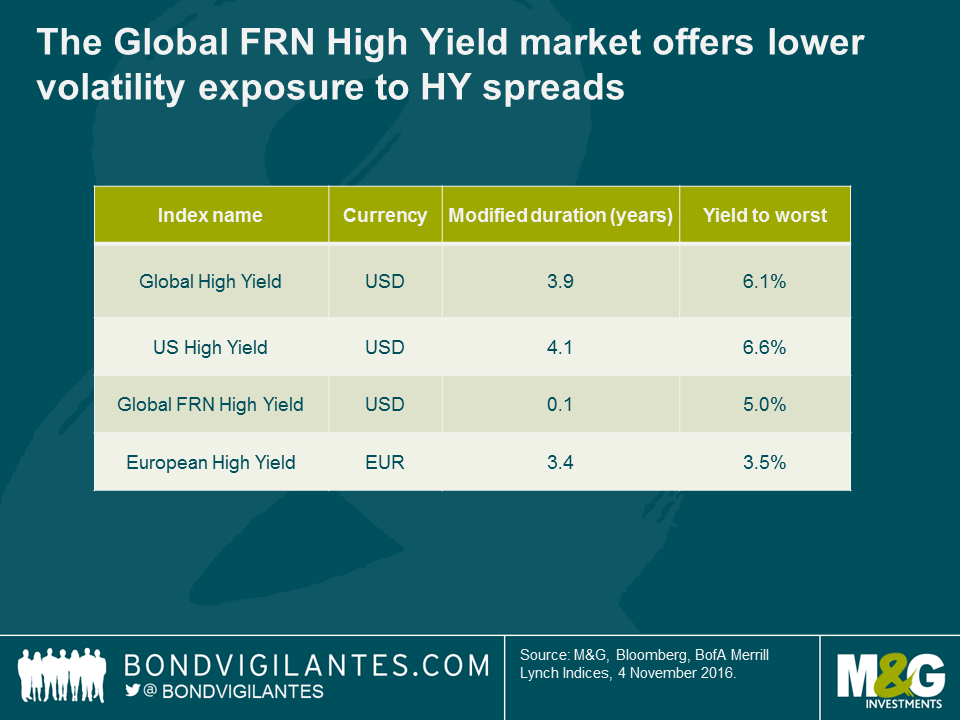
As shown in the table below, the high yield floating rate market offers similar yields to the conventional US and European high yield markets today, but with much less interest rate risk (i.e. close to zero) and lower volatility in periods of risk aversion. We believe this feature makes this part of the market more attractive on a risk-adjusted basis for investors who are looking for lower volatility exposure to high yield credit spreads.
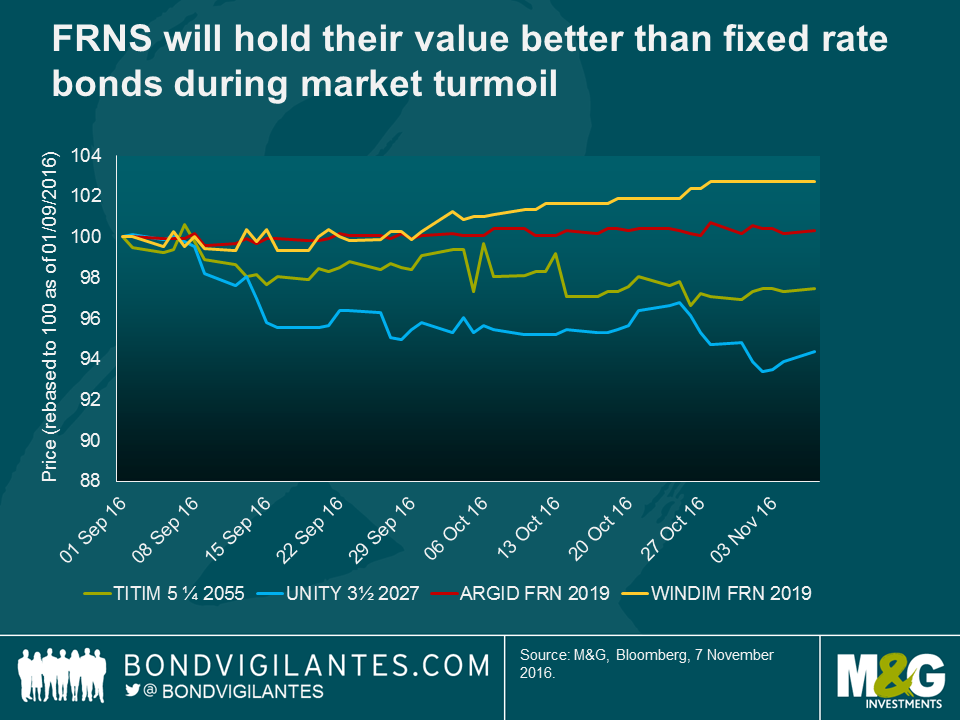
If government bond markets continue to weaken, FRNs will hold their value better than fixed rate bonds. This has indeed been the case over the past 3 months, even for high yield bonds. The chart below illustrates in practice how floating rate bonds have held up, or even marginally increased in value, over the past few months. On the other hand, longer-dated conventional high yield fixed rate bonds such as those issued by Telecom Italia (TITIM) and Unity Media (UNITY) have fallen in price by several percentage points due, largely, to their much greater sensitivity to government bond market volatility.
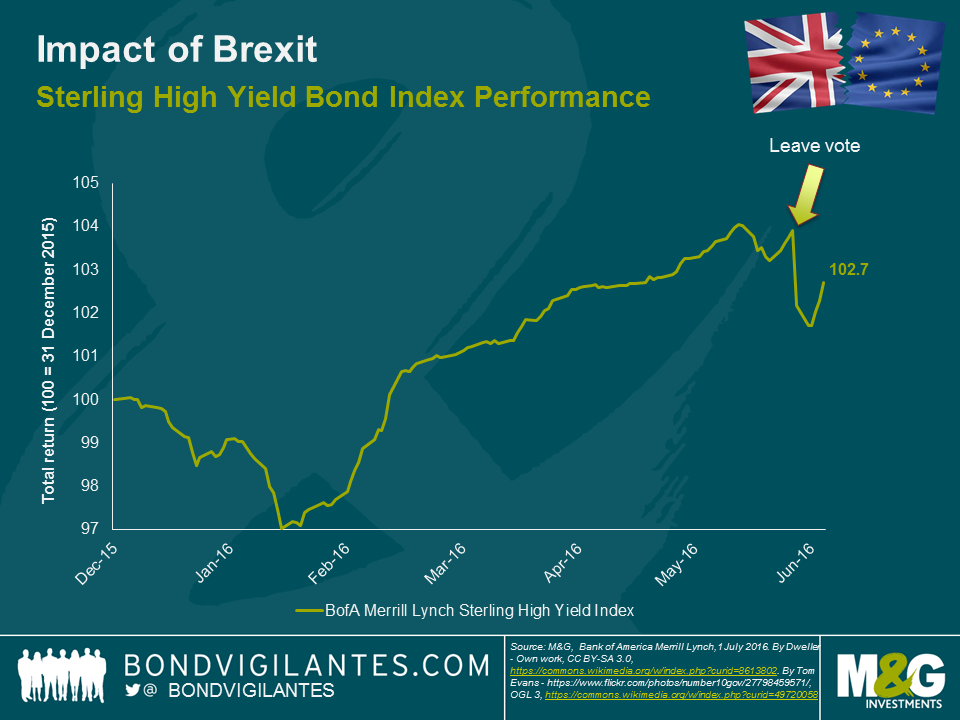
Much has been written about the impact that the referendum result has had on gilts, the pound and equity markets. In sterling high yield bond markets, we have seen some repricing with the market 2% lower in price terms since the vote. In my opinion, this has been a fairly benign reaction if you consider that the FTSE 250 is around 10% lower over the same time period. One explanation for the muted market reaction could be the expectation for further monetary easing in the near term. Governor Carney has signalled that the MPC is likely to ease policy rates over the summer. The possibility of direct central bank action in credit markets also hangs over fixed income markets at this point in time, helping to support market valuations. Of course, monetary policy can only do so much to support a deteriorating economy and Chancellor Osborne’s less austere approach to fiscal policy is also providing some hope that a possible UK recession would be a shallow one.
There could be other reasons why the reaction in the high yield market has been relatively benign. Like the FTSE 100 (up 2% since the vote), the high yield market is not a very good reflection of sentiment surrounding the UK economy. In fact, there is a significant number of international issuers that have non-investment grade ratings and issue bonds in sterling. For example, Anglo American, Gazprom, Petrobras and Enel are all constituents of this market. This has a dilutive impact on any UK-specific re-pricing of risk. Also, the supportive moves by various central banks in the aftermath of the vote has helped support all risk assets, including credit.
There will be some winners and losers in terms of the underlying issuers of these bonds and in order to forecast these, we need to make a number of qualifying assumptions. These are:
In this environment, domestically focused cyclical businesses that source their inputs from overseas are the most vulnerable (e.g. clothing retailers). Whereas, exporters of goods and services to non-EU markets may actually see a small benefit (e.g. educational service providers). The below chart plots this impact on the y-axis using a (caveat: highly subjective) numerical score between 1 and 5 (with 1 being the most positively impacted, 5 most negatively and a score of 3 denoting little or marginal impact). Current credit spreads are on the x axis to put this all in a relative value context. It should be noted that financial and distressed credits have been excluded, and of course we need to remember that spreads are a function of many other factors than purely Brexit.
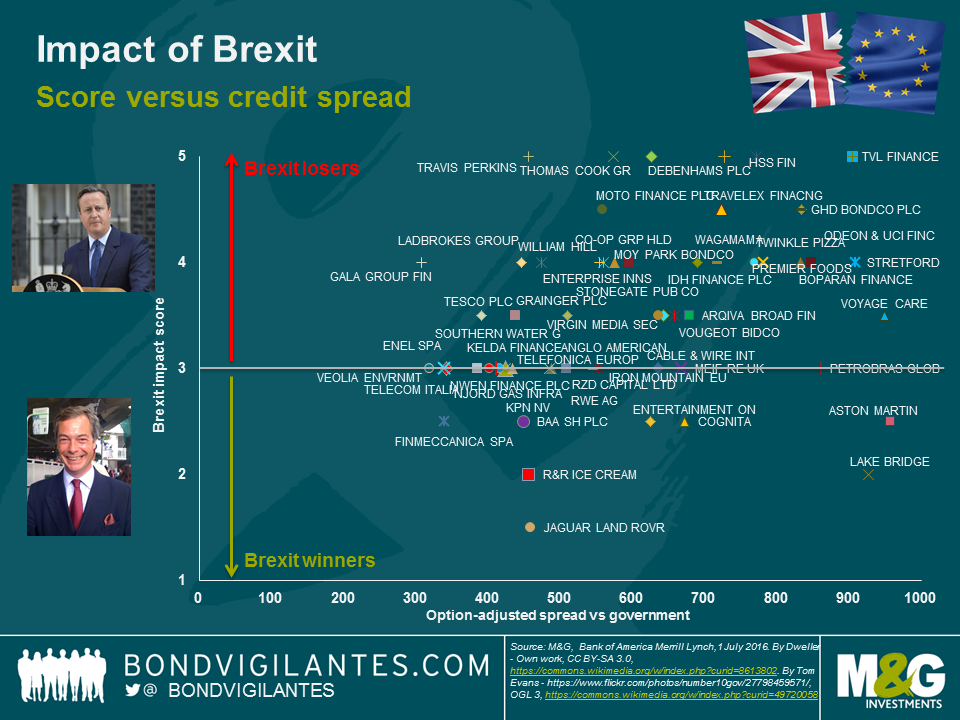
We can draw a few interesting inferences from the above analysis. Firstly, most of the issuers will see a negative impact, while the number of companies that could benefit from Brexit constitutes a small minority. Secondly, when relative value is taken into consideration, the potential “winners” that trade cheaply are not without other risks. For example, Aston Martin (ASTONM) is a potential winner as a UK based international exporter and is not dependent on the European mass market. However, it has its own challenges as a small, capital constrained niche producer in a very competitive market. Brexit is unlikely to outweigh existing challenges for the business. Finally, given the muted market reaction and the likelihood of some extended fundamental challenges, the more interesting strategy to take right now is to sell or reduce exposure to the potential losers. Whilst there may be some specific opportunities, the uncertain macro environment means it is difficult to get too bullish on sterling high yield at this point in time. We would want to see a further downward adjustment in valuations before we look to put capital to work.
The year is 2020 and King Henry IX, the recently installed head of state of the United Kingdom of Northern England, Wales and Northern Ireland stands in a room overlooking the Trent River. Most of his subjects still refer to him simply as “Harry”. His popularity with the electorate is seen as a key factor behind the surprise victory for the monarchists in the recent constitutional referendum for the latest sovereign entity to be carved out of the United Kingdom. Following the secession first of Scotland in 2018 and then the South of England a year later, after the so called “SEXIT” referendum, King Henry is now the constitutional monarch of a territory encompassing the North of England, Northern Ireland and Wales. As he looks out of the window, the Prime Minister continues with his weekly briefing,
“So you see your majesty, I’m afraid that the Governor really has no choice, a further cut to interest rates and allowing a devaluation of the Northern Pound is the only option in light of our fiscal position.”
The King nods to acknowledge the statement, albeit with little real understanding of what Prime Minister Andy Burnham has just said.
“This will probably mean more inflationary pressure in the short term, but a weaker currency will help our exporters compete more effectively. Nevertheless, your majesty, I feel I must bring up the fiscal pressures your government is feeling.” The Prime Minister pauses.
Harry turns around, picking up on the embarrassed tone in the Prime Minister’s voice. “Let me guess,” he says, “more cuts to the Royal Budget?”
“I’m very sorry your majesty, but we’ll have to start making more economies. I’m afraid it’ll mean further delays to the construction of the new palace here in Stoke “
Harry turns back to look over the River Trent. On the far bank, the new Houses of Parliament were taking shape in the centre of Stoke, but the future site of his palace remained untouched nearby. It is still being used as a car park for the local Lidl supermarket. How did I end up here, he ruminates, in Stoke of all places. After all the debate about where the new capital was to be located, the politicians were deadlocked between Birmingham and Manchester. Consequently the “M6 Compromise” started to take shape, with an expanded Stoke-on-Trent as the nation’s new purpose-built capital, midway between the two.
“Also, we’ll need to cut back on the regular trips to Los Angeles.” Prime Minister Burnham continues, “The flights will just get more expensive if the Northern Pound continues to slide against the dollar. I understand this may not go down well with Her Majesty, but I can only apologise for this, my hands are tied.”
Harry visibly winced. He would have to break the bad news to Queen Kendall (nee Jenner), who liked to jet back regularly to visit her family in Beverly Hills and appear in episodes of their long running reality series. Perhaps they could film more episodes here at home, he thought, after all their son, Prince Kanye, was due to start school soon.
The above snap-shot of a balkanised United Kingdom in the near future may seem far-fetched, but with the contemporary political debate about the UK’s membership of the European Union and the continued stresses and strains within the Eurozone itself, I thought it might be interesting to consider if there were potential economic fault lines within the UK too.
The currency union that underpins the UK is able to function given the regular and persistent fiscal transfers from the South East of England and London to other areas within the country. These transfers help redress the inevitable internal economic imbalances of a currency area and are part of a well-established political settlement. However, what if this political settlement was ripped up by a disgruntled electorate in a fit of economic localism, and with it the mechanism for fiscal transfer? In this instance, what would be the optimal currency areas for a de-constructed UK?
To answer this, I looked at two readily available regional statistics: unemployment rates and house price to earnings ratios. This first is to determine regional differences in the labour market and the latter to determine where low interest rates are having the biggest impact on asset price inflation. The logic is that areas that currently have low unemployment and a high house price to income ratio would arguably benefit from a tighter monetary stance, and vice versa for areas that have significantly higher unemployment and a much lower house price to income ratio.
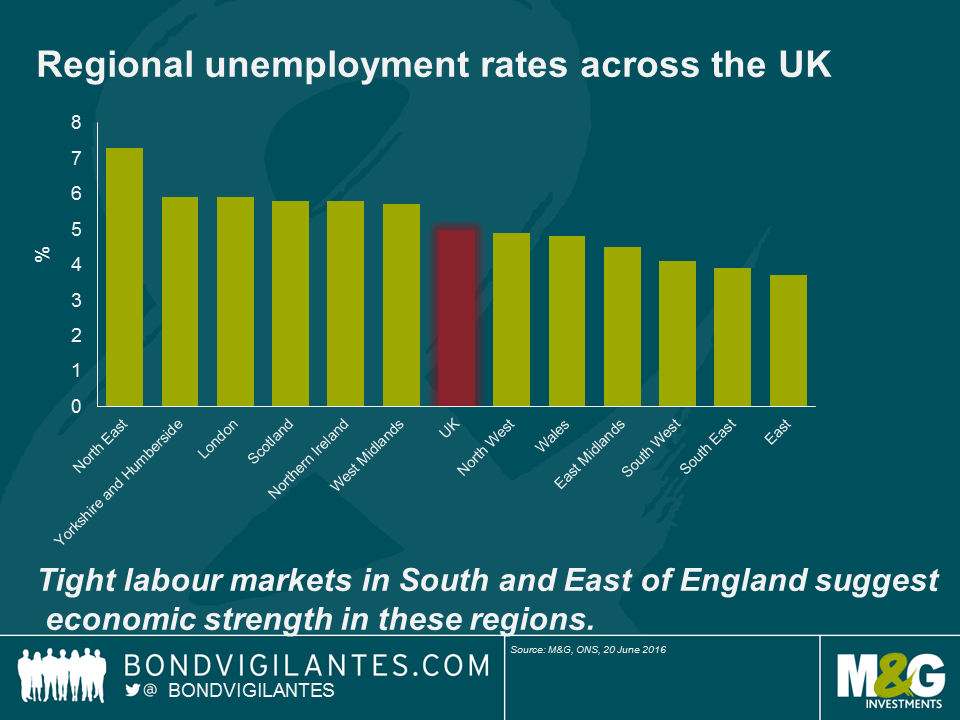
In terms of unemployment rates, the first thing to note is that with the exception of the North East and the East of England, there is relatively little unemployment rate disparity which may suggest a lack of regional fault-lines. Indeed, it came as a surprise to me that London has a higher unemployment rate at 5.9% than the national average. Nevertheless, when we look at the three regions with the tightest labour markets (arguably well below an estimated UK NAIRU rate of c.5.0-5.5%* suggesting monetary policy is currently too loose) there is a definite geographical bias towards the South and the East of England.
This regional picture is also evident when we look at the break down of house price to earnings ratios. The South and East of England all have a higher than average ratio, but of course London is the most distorted of all at roughly twice the national average.
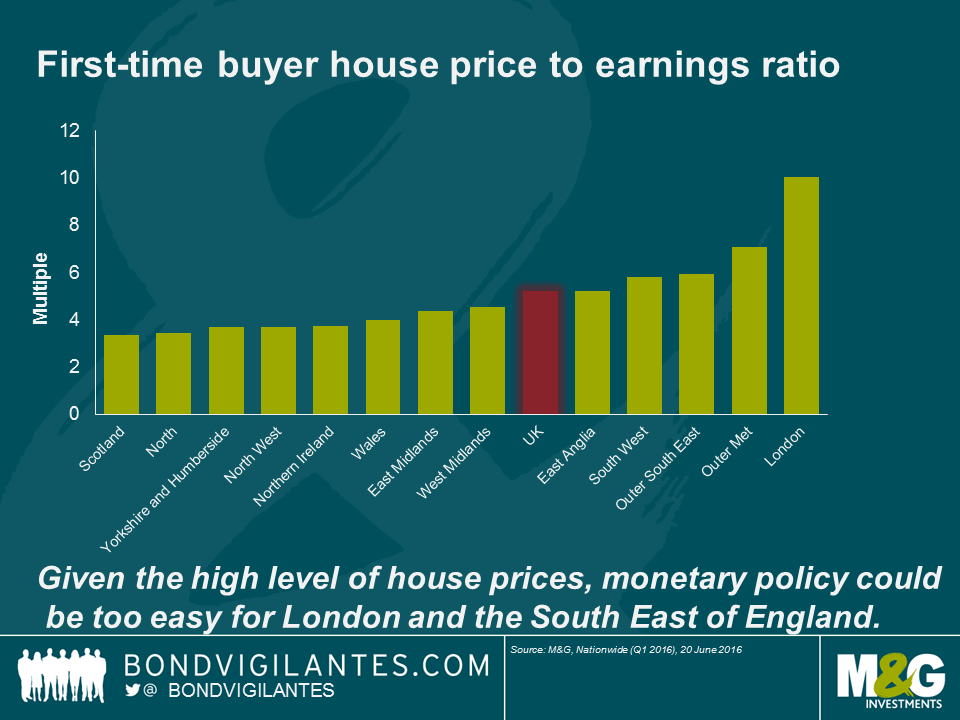
Taken together, this suggests that the UK could be broken into two optimal currency areas in the event that fiscal transfers became impossible. The South West, South East, London and the East of England forming one area and Northern Ireland, Scotland, Wales, the North of England and the Midlands forming the other area (roughly speaking a line from Gloucester in the West to Kings Lynn in the East would mark the border).
However, what is encouraging from the above, is that with the notable exceptions of the South East and London housing market and high unemployment in the North East, the lack of huge regional disparity elsewhere suggests the UK is not obviously a sub-optimal currency area as it stands today. There are regional differentials, but it doesn’t seem those differentials are sufficiently large to merit a monetary split.
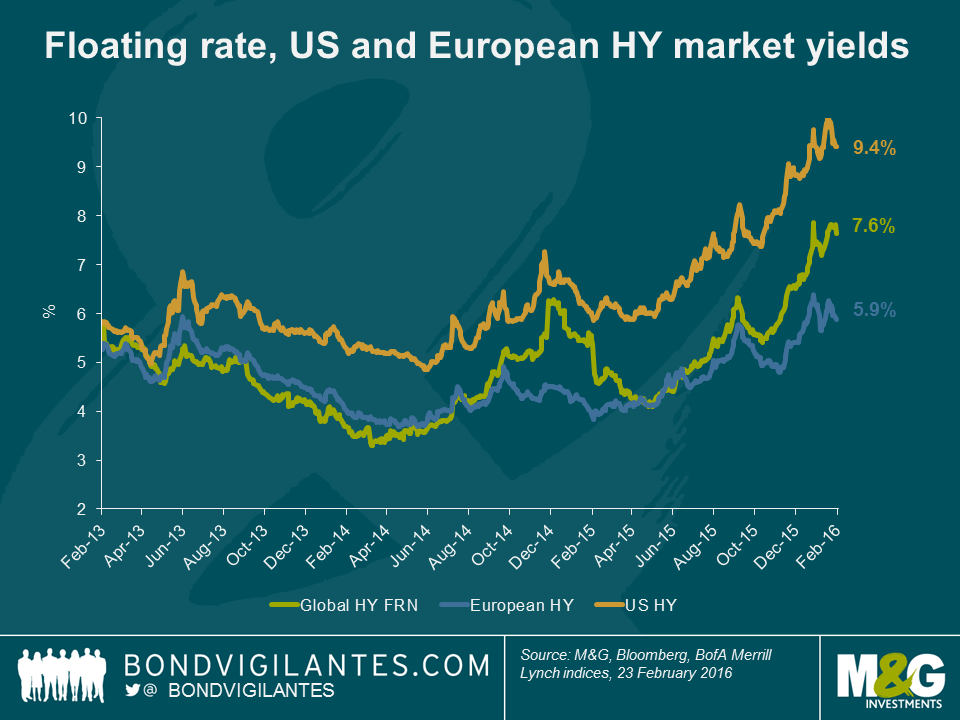
It’s been a difficult past few months for all risk assets, including the high yield markets. Weakest of all has been the US, with negative returns of almost 10% over the past year. As part of this re-pricing, spreads have widened significantly, with the US high yield market touching almost 900bps over treasuries. All-in yields also briefly peaked above 10% last month.
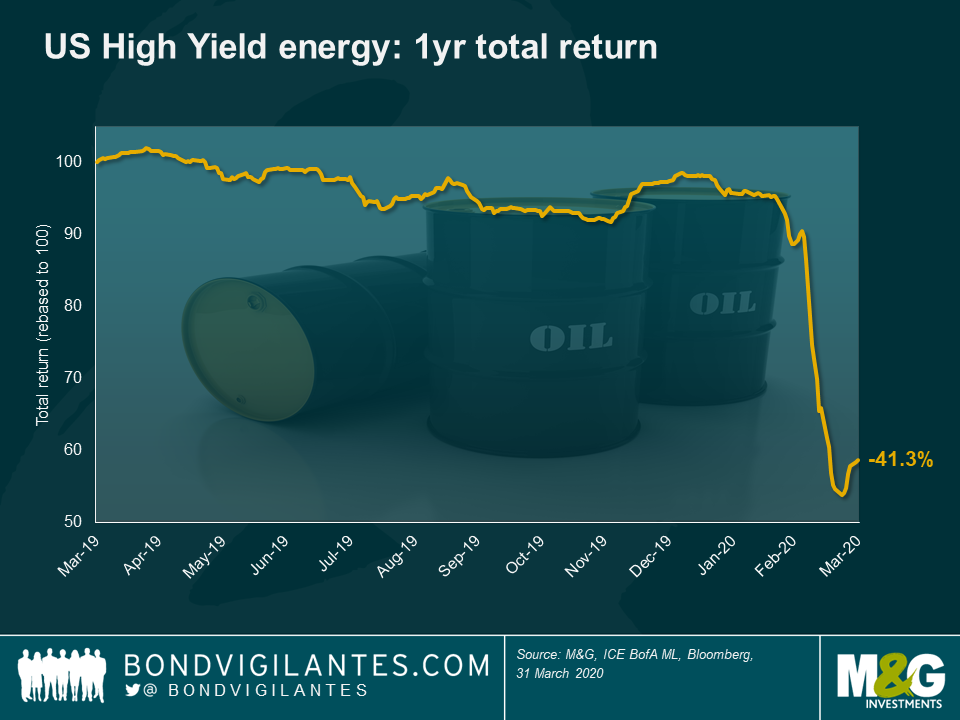
Underlying this has been a major and well publicised sell off in energy credits. The dispersion of returns within the market has been immense. It’s interesting to note that despite more than a 10% sell-off in January and February, the weakness in subordinated bank paper (the AT1/COCO index lost 3% for the year to 23rd February) has been dwarfed by the loss of around 37% in US Energy bonds over the same period. With the increasing prospect of further defaults, getting the sector call right last year was crucial.
So we have widening credit spreads, fears about a general slow-down in growth and deep concerns about capital destruction in a major part of the market. So a terrible time to get into the asset class then? Perhaps not.
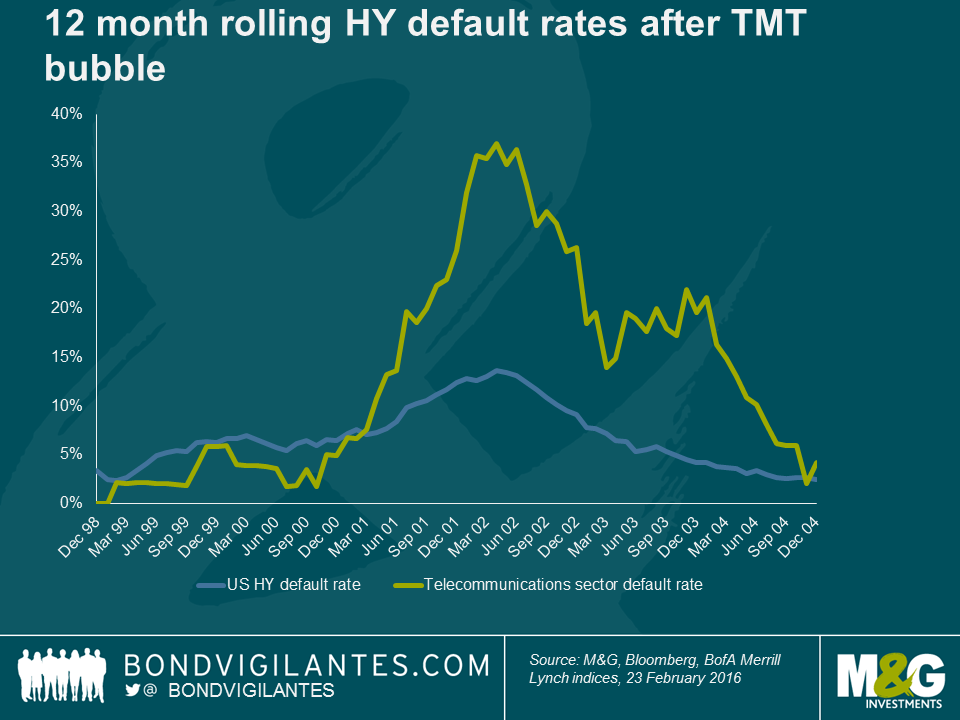
Why do we say this? First of all, there could be some interesting parallels to the high yield market in 2001. The similarities are there – it feels like we are listening to an echo from bond market history.
a) Then as now, one sector is the focus of concerns. In 2001 it was the bursting of the TMT bubble and the fallout from the capex splurge of telecommunications businesses, funded by an over-eager high yield market. This led to a spike in defaults and a painful few years for creditors. Now it’s the bursting of a commodity price bubble and the fallout from the capex splurge of energy businesses, funded by an over-eager high yield market.
b) As a result of this corporate overspending and loose credit discipline, there were concerns that this could adversely affect growth in the wider economy. Recessionary fears were being factored into risk premia towards the end of 2000 as they are now.
c) The initial repricing of spreads was fairly rapid over the course of 2000, but spreads remained elevated for an extended period. There was no quick snap back in risk premia. This is relevant because unlike the cycles we saw in 2009 and 2011, which saw a rapid tightening in spreads helped by government and central bank actions, the ability for policy makers to affect the same kind of move seems less apparent today. The contemporary cupboard of policy tools is looking pretty sparse. If we are entering a cycle of market weakness, there is a decent chance that this time it could last a while as it did in the early 2000’s.
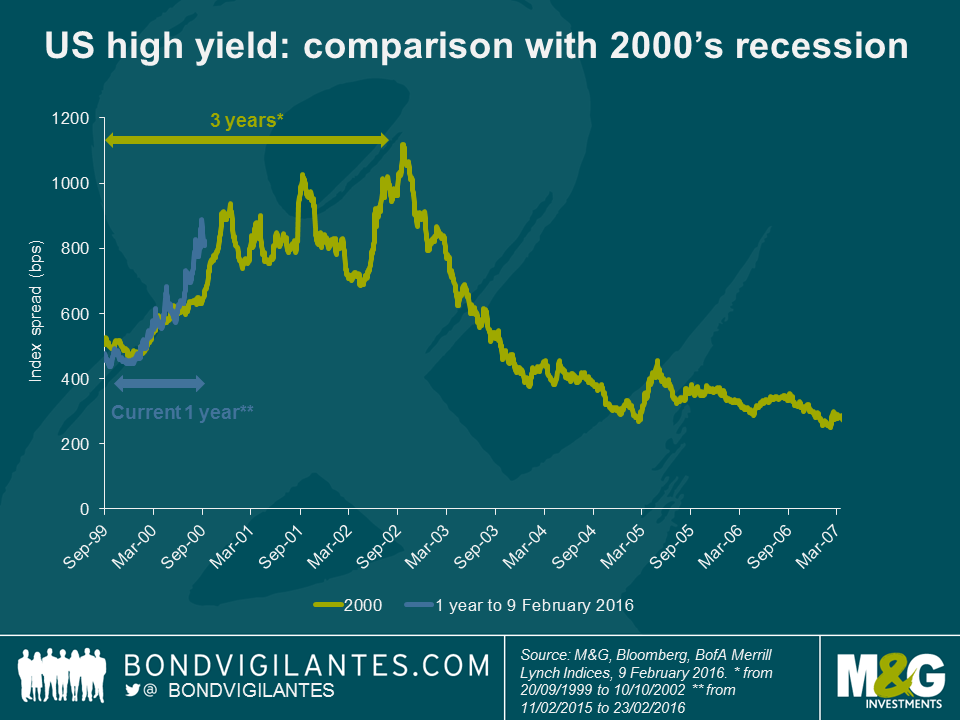
The interesting thing is that buying high yield when spreads first touched around 900bps wasn’t necessarily a bad call, even at the start of an extended default cycle. Buying into the market on Jan 1st 2001 would have meant a return over the course of 4 years, of 45% (remember – both defaults rates and spreads peaked a year later).
Also, a good sector call added significant value. If that investor bought the market without any telecommunications exposure instead, they not only saw consistently positive returns, but also a total return of c. 60% over 4 years, 15% higher than the market average.
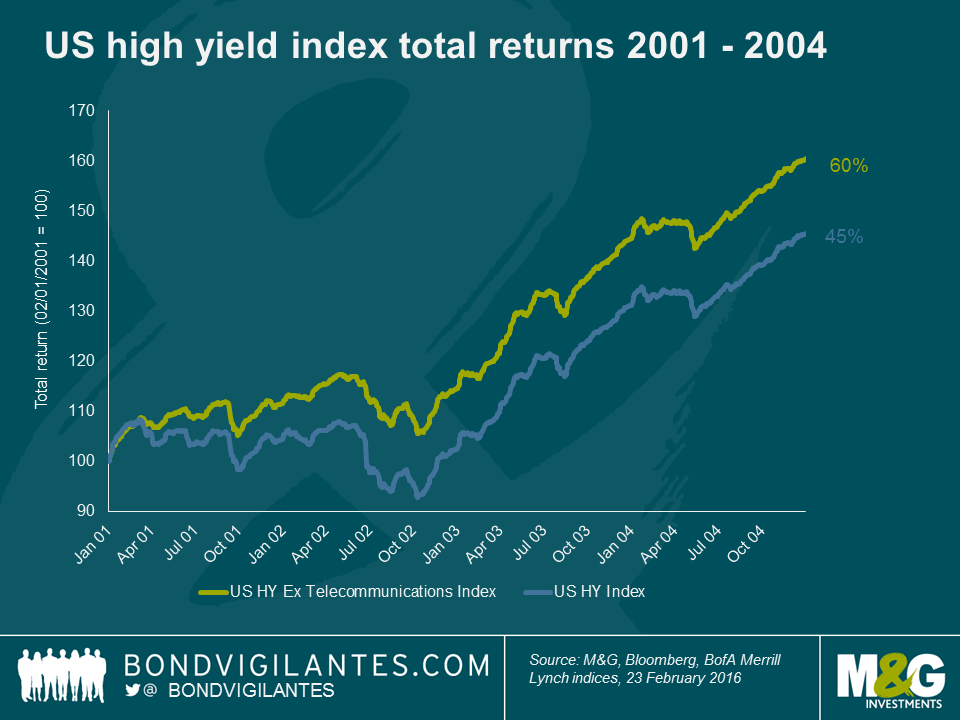
It should be noted that the scope to achieve these sorts of returns was only possible with a significant contraction in spreads during the course of 2003 and 2004 – this generated significant capital gains on top of the high level of coupon income.
Nevertheless, being “early on the trade” when spreads first widened was not a punitive experience. The implication is that even if we do see an extended cycle play out, for the patient investor who can ride out a few bumps and scratches in the interim and get the sector call right, the total return opportunities in the high yield market are looking interesting.


Sign up to the Bond Vigilantes mailing list to ensure you never miss a great article from our expert Bloggers. We will email all new articles to your inbox, meaning you can stay on top of the world of Bonds.
I confirm that I would like to receive information about Bond Vigilantes and products and services from M&G Securities Limited.
We will use the email address and personal data you have shared with us to send you this information. For existing customers, submitting your contact details and requesting to receive this information from us, will replace any earlier choices you have made in respect of marketing information.
You can unsubscribe from marketing at any time, at which point we will not send any further marketing information to you, by selecting the unsubscribe link in all communications.