
Rolldown
A dispatch from the number crunchers – Yield curve rolldown
By Matthew Russell
15 April 2026

So what exactly are leveraged loans? Leveraged loans are floating rate instruments that are issued by companies to finance corporate restructuring, such as leveraged buyouts (LBOs). After an LBO, private equity companies have to issue a large amount of debt to fund the transaction, and this is then placed on the target’s balance sheet. A relatively recent example was Malcolm Glazer’s takeover of Manchester United in 2005. Following the takeover, Manchester United approached a number of institutions in the City asking if they were interested in buying the loans. As it happened, we decided not to (and that’s not just because I’m a Leeds United fan). Other companies to have issued loans include Gala, the AA, Lego and United Biscuits.
Senior leveraged loans occupy the most senior position in the company’s capital structure, which means that if the company fails and defaults on its debts, then leveraged loan holders are first in the queue to recover their money. The average recovery rate for a senior loan holder has historically been around 80%, significantly higher than the 40% recovery rates that are typical for the average high yield corporate bond holder in event of default. Even though senior leveraged loans occupy the highest position in a company’s capital structure, though, they typically have a credit rating of double-B or single-B, which reflects the sub-investment grade equivalent rating that would apply to the borrowing companies. Typically a European loan might pay investors money market rates plus 2.25% (currently 7.85%) compared with around 7.50% for a high yield bond, so given the lower risk profile for loans, they currently look good value.
Another advantage of leveraged loans is that they are floating rate assets rather than fixed assets. In other words, the income paid from leveraged loans is a fixed basis point payment over a reference interest rate, and so the total income paid duly rises and falls in line with interest rates. Leveraged loans therefore have no duration (or interest rate risk) and are therefore particularly attractive in a rising rate environment.
The surge in LBO issuance over the past few years has inevitably resulted in the rapid growth of the European leveraged loan market. In addition, institutional investors have increasingly been able to gain access to the primary market for loans, and now represent 49% of the market, up from 40% in 2005 and 25% in 2004. Interestingly, we have seen US retail loan funds (known as ‘Prime Rate’ funds) enter the European market, as the US managers have increasingly recognised the relative value offered by European leveraged loans. Hedge funds have also become major players, attracted by the high yields, the floating rate feature and the exceptional risk/return characteristics the asset class has demonstrated.
One market development that we’re watching closely is the potential for rising risk within new leveraged loan deals, which has been possible due to the soaring demand for the asset class. Although encouragingly, while average debt/earnings was higher at the end of 2006 than a year earlier (with debt standing at 4.25 times earnings, compared with 4.01x in 2005), there was a gradual fall in leverage within transactions as the year progressed (4.23x at the end of Q4, down from 4.43x in the third quarter). Our analytical vigilance is as important now as it has ever been – but this is a very interesting asset class right now.
We’ve given a relaunch to the the M&G Global Managed Bond Fund, and, as you can see, it has a new name too – the M&G Global Macro Bond Fund. The “old” fund was a fettered fund of funds, invested solely in the M&G bond range, but thanks to some regulatory changes we’ve been able to adopt COLL “wider powers”, which allows us to invest not only in funds, but also in direct holdings and some of the more innovative fixed interest asset classes. In particular I will be able to invest in bank loans, or leveraged loans, via the M&G European Loan Fund run by Dan Gardner – this is the bond asset class we currently believe has the best risk/return characteristics. Yields (typically around 8%) are not far away from those of traditional high yield bonds, yet loan holders have full security over the assets of the company (like a mortgage) if something goes wrong, resulting in historically high recovery rates. Additionally the interest rate paid to investors rises in line with any rate hikes, so if the Bank of England and ECB continue to put interest rates up, the returns on these instruments increase. Ordinary unit trusts and OEICs cannot invest in these loans to any great extent, so we believe the Global Macro Bond fund – by virtue of its NURS regulatory structure – to be pretty much unique in the retail space with its significant holding in them (currently 14%).
So how will I run the fund? The name change to “Macro” reflects the way I think about markets – as an economist by training I will look to put on positions that reflect my long term views of the global economy. For instance I believe that the great wave of baby boomers retiring over the next decade could bring some risks to growth (lower) and inflation (higher); and I believe that sterling looks to be expensive against other currencies, especially as the ECB is likely to carry on hiking as Euroland growth ramps up. So I have been buying floating rate assets (like bank loans, and floating rate notes (FRNs)) which will perform if rates do have to rise, and I have a holding in euro denominated inflation linked bonds, which have cheapened significantly in the last 3 months. “Real” yields have risen from 1.56% to 2.07%, and additionally the euro has weakened against the pound by over 3% over the same period.
If I want to gain exposure to high yield, or sterling investment grade for example, I’ll buy my exposure through our own teams’ existing funds, thus gaining instant diversification and access to their stock picking. Otherwise I’ll invest directly, adding overlays to express my credit, currency and duration views, and using derivatives where necessary. Where property yields look cheap to bond yields I can take a modest investment into that asset class too – again thanks to the NURS structure. With so many interesting developments coming through in the world of fixed interest at the moment (for some reason bond investors love to innovate) we hope to be able to add more (generally higher yielding) bond instruments to the portfolio over time.
This fund sits in the Global Bond sector of the IMA classification – as such its returns will include a higher degree of currency risk than traditional UK based bond funds. Given that the pound is at pretty much its highest levels in living memory (the Bank’s Trade Weighted Index goes back to 1990, we’re at new highs now, although we have been a little stronger versus the US dollar in 1992 immediately before we fell out of the ERM). I think it’s time to take the view that its likely to revert to mean – and therefore that overseas asset exposure makes sense at the moment.
We’ll keep you posted on developments on this fund. Also look out for further updates on Richard Woolnough’s specialist M&G Optimal Income Fund.
The US housing market is getting worse and worse, and the UK looks set to follow it.
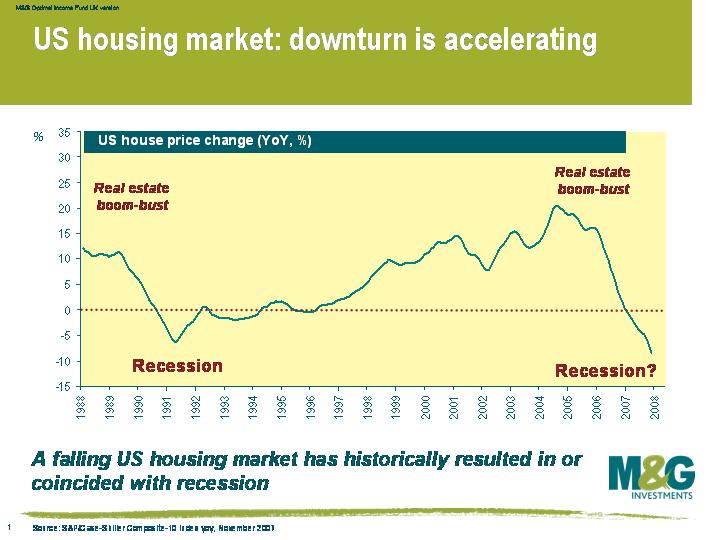
Yesterday saw the monthly update on the disaster that is the US housing market. Figures showed that the downturn is accelerating – the S&P/Case-Shiller Composite-20 Index showed that the US house prices fell 7.7% in the year to the end of last November. The S&P/Case-Shiller Composite-10 Index (which covers the 10 main US metropolitan markets and has a longer history – see graph) showed that house prices fell 8.4% in the year to the end of last November, the steepest fall since the index began in 1987. This is bad enough, but digging below the headline year-on-year numbers reveal a startling trend in the house prices. Taking the quarterly house price change, and annualising it, shows that the Composite-20 index fell 16.2%, while the composite-10 index fell 16.6%, which shows that the downward trend is quickly accelerating.
Then today we had the UK release of what I believe is perhaps the most important UK economic indicator, the number of mortgage approvals. We have discussed mortgage approvals numerous times on this blog, but it’s worth a brief recap. The housing market is the transmission mechanism for monetary policy – when the housing market is strong, the Bank of England increases interest rates to stop the economy from overheating. Higher interest rates slow the housing market, then consumer spending and economic growth both slow (both with a lag), then inflation falls (with a further lag), and finally unemployment starts rising as companies react to weaker growth by cutting costs. Any predictor of what’s happening to the housing market is therefore worth its weight in gold to figuring out what’s going to happen to the broader economy.
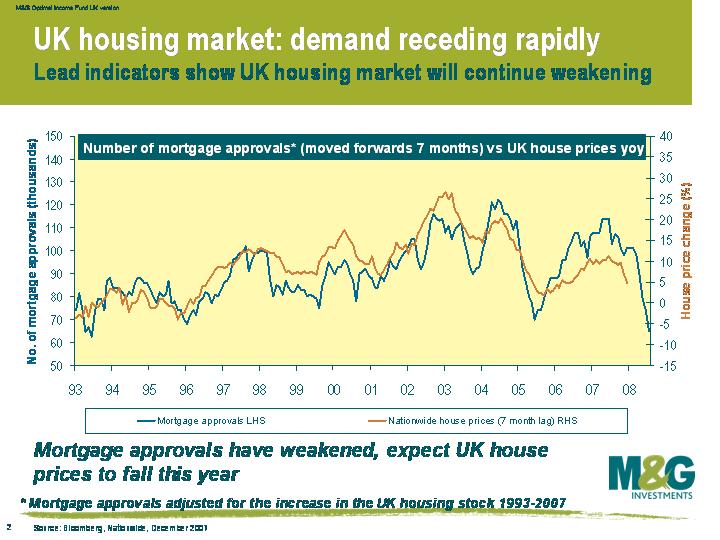
As you can see from this chart, today’s mortgage approvals number was shockingly bad. Since we last wrote about mortgage approvals we’ve made a slight adjustment to mortgage approvals, where we now adjust for the fact that the total UK housing stock has gradually increased over time. This makes recent mortgage approval data much more comparable to historical data, and improves the predictive powers of the mortgage approvals on the housing market. As you can see from the chart, the dramatic slump in mortgage approvals spells woe for UK home owners, and UK house prices look set to fall further over the next six months. The graph suggests that by the summer we’ll be seeing a year-on-year decline of around 5%.
What does a collapsing housing market mean for the central banks? It means that economic growth is set to fall very sharply. The US Federal Reserve is acutely aware of the risks, as a falling US housing market has always historically resulted in or coincided with recession. The Federal Reserve is being very active in slashing interest rates but the Bank of England has been slower to react, having cut rates only once so far. With UK rates at 5.5%, many rate cuts will surely follow. The Bank of England will not be maintaining the status quo.
Emails from wine merchants are starting to pop into my inbox with offerings of en primeur wine from the 2005 Burgundy vintage. Thanks – probably – to global warming, pretty much every vintage, from every wine growing region of the world, is at least acceptable nowadays, and the years where the hype declares it to be “the vintage of the century” are increasing. For example, we’ve had three “vintages of the century” already (2000, 2003, 2005). I’m telling you this because if you’re looking for inflation protected assets for your portfolio, fine wine has historically done a very good job. Manesh Kumar’s recent book (Wine Investment for Portfolio Diversification) shows that classic Bordeaux wines returned an average 12.3% over the 20 years to 2002, versus 9.2% from the FTSE 100 – volatility adjusted the advantage was bigger still. The last couple of years have seen even greater outperformance thanks to strong global economic growth, and the emergence of new super-wealthy classes in India, China and Russia.
Growers and producers have put their prices up year after year. Wine critic Jancis Robinson has tracked prices of first release Burgundy over the past few years. 12 bottles of Jean Grivot Clos de Vougeot (a Grand Cru vineyard near the village of Vosne Romanee in the Cote de Nuits) would have cost as follows:
2005 – £600 (i.e. about £60 a bottle once tax and duty is added)
2004 – £480
2003 – £594
2002 – £498
2001 – £408
2000 – £402
1999 – £402
A rise of nearly 50% over the period, compared with an increase of under 20% in the UK RPI.
Given the tiny size of the Burgundian vineyards (some make just a couple of thousand bottles a year) supply can’t rise to meet demand, as it would do in a widget factory. So if you believe that rise of the middle classes and super rich in the emerging economies is a trend that can only continue, buying scarce, trophy wines would seem to be a good long term bet. The problem is that this market – like that for art – is sentiment and confidence driven, and years when growers get too greedy and confidence falls (like the 1997 vintage in Bordeaux) are followed by long hangovers. Art prices are still 5% below their 1990 boom level. You also need to account for the cost of carry – ie the interest foregone on your wine purchase over the holding period of say a decade or two, and storage costs at about £10 a year per case. In contrast to a boring equity however you can always get drunk on the asset if it falls in price.
PS Talking of the finer things in life, I happen to know that a keen reader of this blog (who for obvious reasons needs to remain anonymous) is in the market for a diamond at the moment. Here’s the Antwerp Diamond Price Index. The good news is that despite the rise in commodity prices in recent years, 1/2 carat diamond prices are actually 4% lower than they were in 1995.
More choice is a sign of greater prosperity, right? That tall skinny soya cappuccino extra hot (without chocolate on top) was just what you wanted, wasn’t it? It might not be. It turns out that the more choice you give people, the less satisfied they will be. It used to be the case that if you didn’t like the coffee from the shop it was the shop’s fault for only selling an instant brand. Now, it is your fault for choosing a skinny milk when full fat milk gives the longer lasting foam. The blame shifts to you because you were given so much choice and you made the wrong one. This is the one of the ideas in the book “The Paradox of Choice: Why More Is Less” by Barry Schwartz.
And the relevance to investment? More choices also paralyse decision making. A study found that the participation rate of a pension plan fell 10% when the number of funds on offer went from 5 to 50. You think that you are going to make the wrong choice, as the one you choose probably won’t be the best performer. Even though this will probably be outweighed by the fact that the employer will match your contribution, people avoid the choice.
I watched Prof Schwartz on iTunes as part of the Ted Conference series. This is a series of short presentations by interesting people. You can also watch them online (click here for Prof Schwartz’s presentation) or download to your ipod. Other presenters include Freakonomics author Steven Levitt and Tipping Point author Malcolm Gladwell.
The ‘founder’ of the High Yield market, Michael Milken, was in town yesterday at a conference I attended. Mike is the guy who restarted the High Yield market in the 1980’s (high yield bonds were around during the great depression) when he saw great returns available on fallen angels. Mike served 22 months and paid almost a billion dollars in fines for securities fraud after making a fortune at Drexel Burnham Lambert. He has since won a battle with prostate cancer and has become best friends with the guy who put him behind bars, Rudy Giuliani.
His talk was on the subject of change and how the world will be different over the coming decades. The main themes were the rise of the BRIC economies and the value of human capital. Both his charitable work and for-profit enterprises are focused on healthcare and education which he believes will be the source of economic growth in the future.
Interesting article in the Times this morning (see here) discussing the increases in fixed rate mortgages over the past week as borrowers scrambled to fix their home loans. Typical 2 year fixed rate mortgages have increased by around 0.4% over the week, to around 5.39%. This is bad news for the 100,000 to 150,000 borrowers whose much lower fixed rate deals come to an end over the course of the next month – it could end up costing them an additional £60 a month on a £150,000 mortgage. It’s still interesting though that competition in the mortgage market is so intense that the new rates don’t look expensive compared to money market rates – for example, the two year swap rate is 5.72% right now, which is a good proxy for where banks and building societies can borrow wholesale cash. So if they are then lending it out again at 5.34% (Portman Building Society) or 5.39% (Yorkshire Building Society) they are having to make up the difference somewhere else. This might be in high initial arrangement fees, or by selling additional products such as buildings insurance or redundancy protection insurance. In any case, higher home loan costs, in addition to lower real wages (average earnings growth came in at +4.1% this morning, versus headline inflation at +4.4%, in other words a real pay cut) should slow the consumer in 2007.
CPI inflation in the UK hit 3% in December. Anything higher than this and the Bank’s Governor Mervyn King will have to write a letter to Gordon Brown explaining why inflation is so high. It probably won’t read “Dear Gordon, the reason inflation has busted out of the target you set for us is that we’ve kept real interest rates at exceptionally low levels for too long. Yours, Mervyn.” – but it probably should.
The inflation rise was driven by higher transport costs (train and tube fares), furniture and household goods, and recreation and culture. Most worrying was the rise in headline RPI to 4.4%, from 3.9% previously. The latest survey from IDS, a pay consultancy, suggests that in the most recent wage settlements, the benchmark has been the RPI number, rather than the lower CPI number. Higher and higher wage increases could cause inflation to start getting out of control. The most important job the Bank now has to do is to control inflation expectations – this will partly be down to words, with strong anti-inflationary speeches required; but it also requires action, and that includes a further rate hike in the next couple of months.
Elsewhere, commodity prices are worth a comment. The major commodity indices have fallen back a decent way over the past year (CRB down over 15%), largely driven by the setback in the oil price, but also in some recent falls in metals like copper. All good news for inflation, but while there’s good news in these “hard” commodity prices, the “soft” commodities have seen some impressive rises of late. In particular the price of corn has just jumped to a 10 year high (to $4.165 a bushel) on the back of falling stockpiles. Demand from ethanol producers has driven this shortage, and the dramatic rises in corn prices is causing some social unrest in some emerging economies where it’s a staple food. Worth watching.
In an article that appeared in the Daily Telegraph on January 13th, I argue that the Bank of England has to drive interest rates higher. Structural changes in the UK mortgage market mean that the transmission mechanism between UK interest rates and the UK economy is weakening. UK inflation is the highest it’s been in more than a decade, and real interest rates (which are what really matter) are still very low. The Bank of England’s raison d’etre is to control inflation, so control inflation it will, even if it means risking an economic slowdown. Rates will therefore have to climb higher.
Here’s the link to the Office of National Statistics new Personal Inflation Calculator that was widely covered in the weekend press. Not that we can get it to work, and we have no idea what an SVG file is, or how to download one. But it’s a great idea. Let us know if you can get it working and whether your personal inflation rate is above the national average (likely if you like to eat out a lot and send your kids to public school) or below it (if you have a shoe buying addiction and are looking for a flat screen TV). Incidently, for all the talk of higher council taxes feeding through into inflation, my local council, Hammersmith & Fulham, has just announced a fall in bills of 3% for the next fiscal year (the first fall in over a decade), so it’s not all one way.


Sign up to the Bond Vigilantes mailing list to ensure you never miss a great article from our expert Bloggers. We will email all new articles to your inbox, meaning you can stay on top of the world of Bonds.
I confirm that I would like to receive information about Bond Vigilantes and products and services from M&G Securities Limited.
We will use the email address and personal data you have shared with us to send you this information. For existing customers, submitting your contact details and requesting to receive this information from us, will replace any earlier choices you have made in respect of marketing information.
You can unsubscribe from marketing at any time, at which point we will not send any further marketing information to you, by selecting the unsubscribe link in all communications.


