
Rolldown
A dispatch from the number crunchers – Yield curve rolldown
By Matthew Russell
15 April 2026

The housing market is the key transmission mechanism between Bank of England interest rates and the wider economy. When the UK economy is weak, UK interest rates are cut in order to reduce the cost of borrowing. Cheap borrowing costs encourage consumers to spend more, and the biggest beneficiary is the housing market. A strong housing market generates a wealth effect, resulting in strong economic growth. Eddie George was recently accused by the press of deliberately fuelling the consumer boom, but this is precisely how the Bank of England uses monetary policy to manage the economy through the economic cycle.
When the housing market (and hence the economy) is growing fast, rates are hiked. In the late 1980s the Bank of England was a little too aggressive -it doubled interest rates from 7.5% in 1988 to 15% in 1989 in an effort to slow the housing market and subdue inflation, but the result was recession and a housing market crash.
The economy today is in a much better shape than in 1989, but the issues facing it are similar. The Bank of England has kept interest rates too low for too long, as shown by a UK housing market that’s growing by around 10%per annum. Inflation is pushing the 3% upper limit, and the Bank of England has no choice but to hike rates in order to put the brakes on the housing market and dampen economic growth. It may even have to risk recession to do this.
In my catch up reading from holiday (Argentina – stunning and very very cheap!), I noticed that World Directories, a European telephone directory company, has re-financed its euro-denominated leverage loan to be ‘covenant-lite’. Covenants are very important for us as bond investors. This is because they impose restrictions on a company’s management by preventing management from undertaking activity that would not be considered bond-friendly. If a company violates covenants, bondholders have the power to restructure the company, impose additional covenants or even initiate bankruptcy proceedings. The trend towards covenant-lite issues in the leveraged loan market (where loans are being issued with weaker covenants akin to those seen in the high yield corporate bond market) is therefore grounds for concern for leveraged loan investors.
Leveraged loans have traditionally had strict covenants called ‘maintenance covenants’. These are covenants that issuers must comply with on a regular basis. These covenants vary from issue to issue, but may include limiting capital expenditure to a certain level, or preventing the issuer from breaching certain financial ratios.
‘Covenant-lite’ issues drop the maintenance covenants in favour of ‘incurrence covenants’. These covenants only refer to pre-determined events, such as the firm taking on additional debt or engaging in takeover activity. Incurrence covenants are more typical in the high yield corporate bond market – so when Apax (a private equity company) bought Travelex via leveraged buyout in 2005, Apax had to buy Travelex high yield bonds back above par value.
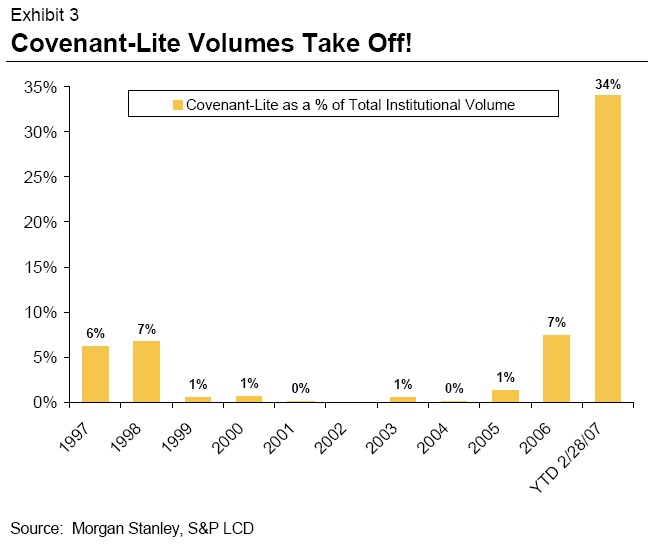 As the chart to the left illustrates (click to view full chart), covenant-lite issuance is a growing trend in the US leveraged loan market – there was more covenant-lite issuance in the first two months of this year than in the previous ten years put together.
I expect the rise in covenant-lite issuance to result in marginally lower default rates, since there will be fewer covenants to break and bond holders will not be able to force bankruptcy so easily. However, I would also anticipate lower recovery rates, because once companies do go bankrupt, there will be less left for bondholders. Covenant-lite issuance is a good example of how leveraged loan issuers are taking advantage of the huge demand for the asset class. This is because they are now able to issue loans with weaker covenants, but with very little additional spread.
In a somewhat timely manner the article in The Economist points to a recent sale of bonds secured upon a pool of mortgages issued by the Kensington Group (the British mortgage group specialising in lending to those individuals with impaired credit profiles). The article points to demand outstripping supply in the bond markets, the relatively low premium demanded by such investors whilst at the same time witnessing a very precarious situation in the US. A mere matter of hours after reading the article on Friday my attention was brought to the 23% fall in Kensington’s share price on the back of a profits warning and the resignation of its CEO John Maltby. The bonds have also suffered but as you’d imagine to a lesser degree than the equity.
Clearly we aren’t in any immediate danger of finding ourselves in a US type scenario. Structural differences between the two property markets mean that UK borrowers remain in a position to re-finance and avoid defaulting on their obligations – house prices in the UK continue to rise strongly, in contrast to the recent US experience. However, the article, along with press reports over the weekend of a 102 year old pensioner being granted a £200k (interest only) buy to let mortgage do highlight the need to keep a close eye on loose lending standards on this side of the Pond too.
The Chancellor has consistently stated that his number one aim is to maintain and entrench economic stability in the UK. The figures show that since 1997, UK economic growth has been the least volatile of all 28 countries in the OECD. The UK economy hasn’t grown the fastest over the period – which is not a surprise considering the OECD includes countries such as Slovakia and South Korea – but it has been a clear leader in terms of stability. Gordon Brown’s unerring knack of predicting UK economic growth (predictions that have usually been well wide of those by the City’s best paid economists) has been particularly impressive.
Government spending will have to fall if the government is to meet these targets. The government managed to ride out the global slowdown of 2000-02 by increasing spending from 35.1% in 1999-2000 to 39.1% last year, but spending is forecast to fall to 38.3% by 2011-12, fractionally lower than when Labour came to power in 1997.
What does this mean for bond markets? Government borrowing must fall, and since government borrowing is funded by gilt issuance, new issuance of government bonds must fall.
The area of the market that will benefit the most will be long dated gilts. Over the past five years, the surge in government spending has been funded largely by long dated gilt issuance, but the long end has still managed to outperform short and medium dated maturities thanks to pension funds’ insatiable appetite. I expect long dated gilts to reap the benefits of the removal of this supply overhang.
As a follow-on to Jim’s note on the rise in UK inflation and the change in the basket of goods used to measure inflation, I think it’s worth asking what actually constitutes inflation?
The Bank of England traditionally used the Retail Price Index (RPI) as its inflation measure. In 1992, Norman Lamont brought in RPIX inflation (RPI excluding mortgage interest rate payment), and targeted RPIX of 2.5%, plus or minus 1%. Then, in December 2003, Gordon Brown changed the Bank of England’s inflation measure to the Harmonised Index of Consumer Prices (HICP), which is the method favoured by the European Central Bank. The target was lowered to 2%, with a minimum limit of 1% and a maximum limit of 3%.
The various inflation indices are measured by taking a representative basket of goods, and this basket alters over time to reflect changes in consumer demand. As Jim mentioned, recordable DVDs, Sat Nav and digital radios were added to the basket this month. At the same time, technologically obsolete items such as portable TVs, VHS video players and prerecorded video cassettes were removed from the basket.
This dynamic has an interesting effect. New technologies cost a lot, but as they become mass produced, prices fall from very high levels to extremely low levels. Then they become outdated, and are removed from the basket to be replaced by new technologies, thus continuing the cycle. This effect results in an ongoing natural downward pressure on prices.
Despite this ongoing downward pressure on prices, HICP inflation rose slightly to 2.8% last month, just below the 3% maximum limit. However, RPIX rose 0.2% to 3.7%, which is above the old 3.5% limit, and only just below the 15 year high of 3.8% set last December. RPI, meanwhile, reached 4.6% last month, the highest level since August 1991. This should surely act as a clear signal to the members of the Monetary Policy Committee that UK interest rates are too loose and need to be hiked.
There was some good news for inflation watchers however, with the release of the Office of National Statistics’ changes to the basket of goods that go into the price indices. A number of newish technologies have gone into the basket – for example recordable DVDs, SatNav and digital radios. These items are all made in China and the Far East and are likely to experience price deflation if history is any guide. In addition, the weighting of fuel and light has increased (to 3.9%), and given that a number of energy suppliers have announced price cuts to come in later this year, this is also likely to put downward pressure on the inflation numbers.
Nevertheless, with CPI heading back towards the level where the Bank of England has to write that letter to the Chancellor, at least another rate hike is likely – in my view the only things that would keep them on hold are a further selloff in global equities, or signs of an imminent US recession.
Value at Risk, or “VaR”, is a relatively new risk measure for the asset management industry, but is one that is rapidly becoming a benchmark for risk. The Investment Management Association (IMA) has already ruled that “sophisticated funds” (funds using sophisticated derivative strategies) must use VaR techniques, and it is likely that VaR will become a leading risk measurement in the asset management industry over the coming years.
The reason for VaR’s growing popularity is that it tells an investor what an investment’s likely downside is, provided the model’s assumptions hold true, we can say with an x% of confidence what an investment’s maximum expected loss will be over a set time period. We typically look at a 30 day time period, and use a 99% confidence interval (ie we can say with 99% confidence that it will be the case). For example, The M&G Optimal Income Fund, currently has a VaR of £1.1m, which means there is a 1% chance of the fund falling by at least 1.6% at any point in the next 30 days (based on the fund’s value of £67m).
How is VaR calculated? VaR is calculated using historical price movements and correlations of a very wide range of variables going back five to ten years (there is a greater weighting attached to recent market data). These variables are then used as inputs for models such as the “Monte Carlo” scenario set, which estimates risk by running thousands of potential scenarios. We run VaR on a daily basis, and in this way we can get an up-to-date view of how much risk we are taking, where these risks are, and whether there are any unintended risks. We can use the model to carry out stress tests by looking at specific variables, which helps us to understand what would happen to the value of a fund given, say, a 1% rise in UK interest rates. We can also look at particular historical events, and answer questions like “what would have happened to the value of a portfolio during the 1987 stock market crash?”
One output from our risk system that is particularly interesting is that the VaR of the high yield corporate bond market is around -0.6%, whereas the VaR of the UK investment grade corporate bond market is approximately -2.0%. It seems intuitively wrong to say that high yield is “lower risk” than investment grade, but if you look at what actually constitutes “risk” then it is not so surprising.
An investment’s risk is a combination of two things – duration (interest rate risk) and credit risk (essentially default risk). High yield bonds have more credit risk than investment grade bonds, but because they tend to be much shorter dated, they have much less interest rate risk. Over the past three years, corporate bond spreads have ground in steadily tighter and credit risk has therefore been remarkably stable. Meanwhile, interest rate expectations have swung fairly dramatically – in the UK, in January 2006, base rates were 4.5% and were expected to fall to 4.25%, but by the beginning of February 2007, rates were 5.25% and were expected to rise to 5.75%. Investment grade bonds have been much more volatile as a result. High yield bonds clearly aren’t always going to be “lower risk” than investment grade, just that over the next 30 days (according to the model) they are likely to be lower risk.
Fitch ratings agency, whose note on Iceland last year originally kicked off the Icelandic banking crisis, yesterday downgraded Iceland’s government bonds from AA- to A+. The Icelandic krona fell 1% against the sterling on the news. Fitch said that “the downgrade reflects new data on the balance of payments and the international investment position that points to a material deterioration in Iceland’s external balance sheet, amplifying concerns about external debt sustainability” and that the highly leveraged Icelandic economy was “poorly positioned to surmount a prolonged bout of global risk aversion and/or higher international interest rates”.
The downgrade may in part be Fitch highlighting Moody’s incompetence (Moody’s controversially upgraded Iceland’s banks to Aaa on the basis that they would be bailed out by Iceland’s government), but there is no doubt that Iceland’s incestuous economy faces great challenges ahead. The Central Bank of Iceland has hiked interest rates from 5.3% in mid 2004 to 14.25% in order to apply the brakes to its overheating economy. Further rate hikes are probably necessary to slow the economy, where inflation reached a peak of 8.6% in August last year.
A slowing economy would be very bad news for Iceland’s banks. Iceland’s three main banks own a large slug of Iceland’s companies, and these companies in turn have significant interests in each other. The huge degree of cross ownership is clearly a substantial economic risk, and within the M&G Optimal Income Fund I have bought protection on bonds issued by Kaupthing, one of the “big three” banks exposed to this risk.


Sign up to the Bond Vigilantes mailing list to ensure you never miss a great article from our expert Bloggers. We will email all new articles to your inbox, meaning you can stay on top of the world of Bonds.
I confirm that I would like to receive information about Bond Vigilantes and products and services from M&G Securities Limited.
We will use the email address and personal data you have shared with us to send you this information. For existing customers, submitting your contact details and requesting to receive this information from us, will replace any earlier choices you have made in respect of marketing information.
You can unsubscribe from marketing at any time, at which point we will not send any further marketing information to you, by selecting the unsubscribe link in all communications.


