
Rolldown
A dispatch from the number crunchers – Yield curve rolldown
By Matthew Russell
15 April 2026

The pollsters reckon that the Scottish National Party will become the single biggest party in Scotland following the elections later this week. This has understandably led to thoughts that a subsequent referendum could result in a majority in favour of leaving the 300 year union between England and Scotland, and have Scotland becoming an independent state within the EU. This led me to think that the billions of pounds of UK government gilts we own in our portfolios might end up being something very different by the time that they mature. As in any divorce, a breakup of the UK will lead to some redistribution of assets and liabilities (I remember the Czech and Slovak governments arguing over who got the tastiest embassies after their separation). Scotland accounts for around 9% of the UK population, and slightly less as a share of GDP, so would 9% of my gilt portfolio turn into Scottish Government Bonds overnight? And would Scotland adopt the Euro, in which case the yield on those Scottish bonds might fall from over 5% (UK 10 year yields) to 4.3% (EU 10 year yields), or would they create their own Scottish Pound, in which case you might guess that yields would rise on account of newness and uncertainty. On a stand alone basis would the Scottish economy be AAA rated like the UK? Would Scottish ratings be helped by oil revenues? Or would they suffer to reflect a mediocre GDP record and static population growth? I don’t know the answers, but I’ll want to as the prospect of independence grows. In the meantime, William Hill is offering 101 to 1 on Scottish independence by May 2012, which might be worth a very small wager. 11 to 1 by 2057 sounds a much better proposition, although 50 years worth of inflation and counterparty risk probably erode the attractiveness of the bet.
Provisional figures just out show that the US economy grew at an annualised rate of 1.3% in Q1, the slowest pace in four years, as construction fell at an annual rate of 17%. Q1 GDP was way below expectations, which had been for an annualised growth rate of 1.8%.
At the same time it was announced that the Federal Reserve’s preferred measure of inflation rose at an annual rate of 2.2%, up from 1.8% in Q4 2006. Ben Bernanke had previously said that inflation should ideally sit between 1% and 2%.
The effects of lower than expected growth coupled with higher than expected inflation meant that US Treasury yields have not moved much at the time of writing, since the effects of higher inflation do not make it any more likely that US interest rates will be cut (US markets are pricing in one rate cut by the end of 2007). Gilt yields have risen however, with the 5 year gilt yield now standing at 5.34%, the highest since March 2002.
Equity markets have fallen on the news, with the FTSE 100 dropping around 30 points. Corporate bonds have unsurprisingly weakened – the iTraxx Crossover Index has widened out about 6 basis points. The data from the US is bad news for credit risk and at least in terms of the UK bond market it is bad news for duration. My funds continue to be positioned short duration and with a focus on highly rated corporate bonds.
Moody’s monthly default report shows that the global speculative grade default rate fell to the lowest level since April 1997. March’s figure was 1.41%, down from 1.58% in February, which means that just 1.41% of all high yield issuers defaulted in the 12 months to the end of March. These incredibly low default statistics have been made possible by a combination of strong corporate earnings and relatively cheap available finance, which have also helped equity markets to rally (the Dow Jones broke through 13,000 for the first time on Tuesday).
However Moody’s predict that the global speculative default rate will rise fairly steadily from current levels up to 3.5% by March 2008. To be fair, their model’s credibility has fallen a little recently (it has been predicting a rise in defaults for about a year, while defaults have in fact fallen), but there is growing evidence elsewhere that spreads could widen soon, and a sharp correction is possible.
A fascinating note from Tim Bond, a very influential global strategist at Barclays Capital, paints precisely this picture. He argues that US companies are spending much more on buying back equity than on capital expenditure relative to in previous cycles (in Q4, US non-financials bought back the equivalent of 6% of total market capitalisation – by far the largest corporate buying spree on record). This expenditure is being financed by heavy issuance in the bond markets as companies take advantage of historically low yields and record tight spreads to raise finance cheaply, behaviour which has historically resulted in companies’ balance sheets being leveraged up and higher defaults. Companies are purchasing equities with borrowed money, and this cannot enhance earnings growth in the long run – while it can boost a company’s earnings growth in the short term, it does nothing for productivity.
Perhaps the scariest chart in Tim Bond’s note for investors heavily exposed to high yield is one that plots the global speculative grade default rate against the corporate sector’s borrowing (in relation to profits). There is a very strong relationship between the two variables – when corporate borrowing increases, the default rate follows suit about 18 months later. Corporate borrowing has shot up over the past 12 months, and this suggests that the default rate will rise sharply anytime from this summer onwards.
Higher defaults means wider spreads, and we retain a cautious positioned with regards to credit rating throughout the bond fund range at M&G.
There was further evidence of a slowdown in the US housing market yesterday, as sub-prime mortgage woes contributed to existing home sales falling 8.4% in March, the largest monthly decline since records began in 1999 and significantly below expectations of a 4.3% decline.
The US is not the only country with a wobbly housing market – Spanish house price inflation slowed to an annual rate of 7.1% in Q1, down from 9.1% in Q4 2006. The Bank of Spain has previously said that the Spanish housing market is 40% overvalued and fears of impending doom saw Spanish real estate stocks close as much as 25% lower yesterday. Concerns have spread to the Spanish banking sector, much of which is hugely levered and has considerable exposure to the real estate sector. Meanwhile, Denmark yesterday announced that house price inflation slowed to 1.2% in Q1, a fairly worrying slowdown considering that Denmark had the strongest house price inflation in Europe in both 2005 (20%) and 2006 (20%).
So far there is no evidence of a slowdown in the UK housing market, and the pressure is therefore on the Bank of England to raise rates. But if housing markets around the world continue to stall then global growth will inevitably follow, and this is something we are keeping a keen eye on.
You may have read today about the story of Alec Holden, who ten years ago bet £100 on himself that he’d live to 100. William Hill offered him odds of 250-1, and he’s now celebrating a £25,000 win. It seems that old age hasn’t dimmed Mr Holden’s wit – the secret is apparently not to worry about anything, do as little work as possible and go on lots of holidays (and in recent months he’s been keeping watch for “any hooded groups from William Hill standing in the street”).
Interestingly, William Hill has now slashed the odds on the same bet from 250/1 to 10/1, which is a good indicator of how life expectancy has changed over just one decade. When it comes to pension funds, companies have been far too slow at upwards revising life expectancy over the past few decades, and this has very serious consequences for the bond market. If workers’ ages are being systematically underestimated (and there is no doubt that they are – see Jim’s note here from last November), then companies are grossly underestimating their future pension fund liabilities. Pension fund deficits are therefore significantly bigger than current estimates suggest.
The only way to fund this shortfall is for pension funds to dramatically increase exposure to long dated assets. Long dated bonds and long dated inflation-linked bonds will be the biggest beneficiaries, and this is why I believe the UK yield curve will invert further.
The reason is that medium dated gilts are very closely correlated to global government bond yields. In fact the 10-year gilt yield is actually slightly closer correlated to the US government bond market than to the UK base rate. This week the US government bond market has performed reasonably well, with the 10 year US Treasury yield falling from 4.74% to 4.66% on the back of some slightly weaker than expected industrial production and jobless numbers.
I have positioned my corporate bond funds to benefit from an inverting UK yield curve, and this has had a large positive impact on fund performance. My view of the last 18 months has been that UK interest rates will rise by more than the market has expected, global government bond yields will rise, and pension fund demand will support long dated bonds. Both the M&G Corporate Bond Fund and the M&G Strategic Corporate Bond Fund have consistently held:
– over 20% in floating rate notes, which benefit from rising interest rates
– a large underweight in short and medium dated bonds, which I have expected to perform poorly due to the background of rising global interest rates
– a market weight position in long dated bonds
At various stages in the past three years both the M&G Corporate Bond Fund and the M&G Strategic Corporate Bond Fund have had large overweights in long dated bonds, but in a long-only fund it’s not possible to have a large overweight in long dated bonds while still being short duration.
Within the M&G Optimal Income Fund, I am able to create a duration-neutral yield curve view by using derivatives, so it doesn’t matter what direction the market as a whole moves. This has been achieved by:
– selling interest rate futures to benefit from UK interest rates rising
– selling medium dated gilt futures to benefit from medium dated UK gilt yields rising
– buying long dated gilts to benefit from pension fund demand
This position has made money for the M&G Optimal Income Fund, despite the very difficult environment for government bonds over the past few months.
My last housing market note at the end of March discussed how strong mortgage approvals are an excellent predictor of future house price movements. If mortgage approvals are strong, then many people are taking out mortgages. If people are taking out mortgages, then they are looking to buy a house, and if demand for housing increases, house prices do too.
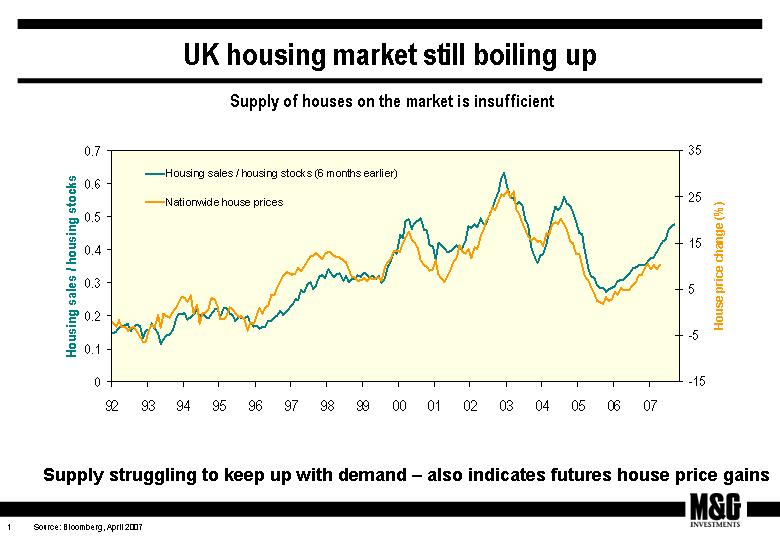 Mortgage approvals data is a good proxy for the demand for housing, but what about the supply of houses on the market? The RICS sales to stocks ratio shows the number of house sales relative to the number of houses advertised by estate agents, and is therefore a good indicator of housing market supply. Data released last week show that the sales to stock ratio has increased to 0.48, a level which has historically led to strong double digit house price growth (click on graph to view). London homeowners saw their properties rise by an average of £76,000 over the past year, 3 times the median London salary – and similar boosts to income have been seen across the UK. Therefore I am less worried than Jim about the erosion of consumers’ incomes from higher taxes and fuel costs. These rising home prices will continue to keep consumption strong.
With both demand and supply measures indicating a strong housing market over the next six months, the pressure is firmly on the MPC to hike rates. The UK bond market has sold off over the past month on strong economic data, and the benchmark 10 year gilt yield has risen to 5.10%, the highest since July 2004. The bond market is now pricing in a 0.25% rate hike next month with about a 70% chance of another 0.25% rate hike by September. If the next rate rise fails to stem the housing market (and hence the economy), then I expect significantly more rate hikes than the market is currently pricing in.


Sign up to the Bond Vigilantes mailing list to ensure you never miss a great article from our expert Bloggers. We will email all new articles to your inbox, meaning you can stay on top of the world of Bonds.
I confirm that I would like to receive information about Bond Vigilantes and products and services from M&G Securities Limited.
We will use the email address and personal data you have shared with us to send you this information. For existing customers, submitting your contact details and requesting to receive this information from us, will replace any earlier choices you have made in respect of marketing information.
You can unsubscribe from marketing at any time, at which point we will not send any further marketing information to you, by selecting the unsubscribe link in all communications.


