
Rolldown
A dispatch from the number crunchers – Yield curve rolldown
By Matthew Russell
15 April 2026

The big investment banks (led by Citigroup) have clubbed together to create a colossal $75bn SIV (Structured Investment Vehicle), which the banks hope will help solve many of their problems. The fund has been set up so that banks can pool and price bank debt, as well as CDOs, CLOs, residential mortgage backed securities (and anything else they can chuck in) that they’ve had problems selling and pricing recently. MLEC is supposed to stand for Master Liquidity Enhancement Conduit; cynics might call it the Market Level Evading Conduit.
Banks sponsor or invest in SIVs, because they provide leveraged returns from a diversified and high quality portfolio of assets. SIVs buy (or to be more precise ‘used to buy’) bank capital notes.
Banks like the high returns that SIVs provide, and they definitely like the fact that SIVs remain off balance sheets. The off-balance sheet financing means SIVs require no regulatory capital, whilst providing a nice and predictable income stream for the bank.
As SIVs have grown, more and more have been created, thus creating more capacity. The huge demand for bank paper (amongst other things) from SIVs (and other forms of structured credit like CDOs) has until recently been a huge compressor of corporate bond spreads. And so, in a nicely self-perpetuating (or incestual?) manner, the tight spreads have resulted in banks’ cost of capital falling. And the more SIVs they create, or the more capital the banks give them, the cheaper the banks’ cost of capital becomes.
The credit crunch has meant that SIVs have been struck by their perfect storm. They cannot issue any more debt because nobody’s buying it, so the SIVs cannot buy bank capital securities. Indeed, some of them have to look to sell their assets to pay their debts. And, thus, the value of these assets falls. Then banks’ capital notes cost a lot more to issue, and their capital efficiency is impaired, and their returns fall.
So, what do the banks do? They bend over backwards to avoid a fire-sale of their capital notes by the SIVs, and agree to set up MLEC, an opaque, anti-free-market vehicle that enables SIVs to avoid marking their assets to market, with the ultimate aim of avoiding the re-pricing of risk of their capital notes. We’ll give it a miss, thanks.
It turns out that the Argentinian President may well have been fiddling the nation’s inflation numbers. As a result it’s estimated that holders of Argentinian inflation-linked bonds have lost $250 million in interest payments, and the bond prices have fallen by 24% this year. Merrill Lynch reckons that inflation is actually rising at 17% per year, twice the published rate from the bonds price.
The global inflation-linked market has grown exponentially in recent years – the UK was one of the pioneers, back in the 1980s, when the authorities thought that developing the market would not only help pension funds to more accurately match their future liabilities, but also would instil discipline on the government to keep inflation low and thus keep the bond interest bill under control.
Nowadays we have significant issuance in the US, Germany, France and Italy, and a newer market in Japan. And emerging market economies have followed suit – mainly in order to give comfort to bond investors who have been badly burnt by inflation in the past.
Not much comfort in this case it seems. Happily in the UK we can wholeheartedly trust the government and the integrity of the ONS’s inflation statistics. More comforting even than that though is the fact that the Bank of England is mandated to keep an independent eye on any changes to the inflation data that might be detrimental to bond holders. Any monkey business and we get our money back.
The Rock has circa 5,000 employees, so some simple maths says that £20bn works out at around £4m per employee. Never has so much been lent to so few. The market capitalization of Northern Rock is £803m (at a share price of £1.915), which means that the B of E is providing 25 times as much finance to the company as its existing market cap. Wow.
Northern Rock continues to write business, and the B of E continues to facilitate this. Is this what central banks are meant to do? Fortunately the independent central bank has the financial backing of the UK Treasury, so it in turn cannot go bust as a result of this huge exposure to one shaky institution.
In the B of E’s defence, the action is not just being taken to support Northern Rock employees or shareholders, but for the wider good of financial stability. But while this action is only a temporary solution, it is distorting the market adjustment processes as it enables a weak industry player to continue to produce products in a subsidised manner, which in turn damages the rest of the industry. This is an industry that the authorities have the mandate to protect.
The B of E isn’t alone in its actions – the ECB is also lending, but is doing it on an anonymous basis. If you thought the B of E has been generous, the ECB has provided €136 billion of extra liquidity to markets. To put this mind boggling figure into perspective, it is about the same as Portugal or Hong Kong’s GDP last year. This financial crisis is quickly transforming from ‘small and temporary’ to ‘large and permanent’.
The latest Bank of England Financial Stability Report is definitely worth a read. Whilst I’ve yet to get through all 78 pages the overview provides insight into the Bank’s thinking as well as a good summary of how the credit crunch unfolded.
In its Q3 results, Merrill Lynch today reported a write-down of $7.9bn across CDOs and US sub-prime, significantly greater than the $4.5bn disclosed in its earnings pre-release. Net revenues fell by 94% on Q3 2006 – as the joke goes, you can only lose 100% of your revenues, although this wasn’t far off. Both S&P and Fitch cut Merrill Lynch’s rating from AA- to A+, with S&P’s analyst describing the results as ‘startling’. Merrill Lynch’s share price was at one point 10% down, before staging a slight recovery.
If you’re an equity investor, investment banks have been a bad bet over the past few months (with the exception of Goldman Sachs). The Dow Jones is close to record highs, and yet the share prices of Bear Stearns and Merrill Lynch are 30% below the highs hit earlier this year. JP Morgan and Morgan Stanley are 15% down.
From what we’ve seen in the fixed income markets over the past few months, we think that the banks’ problems are going to get worse before they get better. In the leveraged loan market, for example, investment banks have struggled to shift loans from the jumbo LBOs off their balance sheets following the repricing of credit risk over the past few months. They have now started to have some success, but they are doing this by selling the bonds at discounts just to shift them before the end of the year and the annual reporting season.
One saving grace for investment banks is that they offer a range of services that cover different markets through the economic cycle. If M&A activity grinds to a halt, they can afford to take the hit, fire most of their M&A team, and employ a new department in, say, distressed debt. This is a luxury that companies like Northern Rock (and to a lesser extent, Alliance & Leicester and Bradford & Bingley) don’t have. As Richard argued on this blog last month, Northern Rock is in serious trouble because its entire business model is no longer valid.
Oh, and yet more terrible US housing data just out – existing home sales were -8.0% in September, way below expectations of -4.5% and the worst month since records began in 1999.
Alan Greenspan made the headlines at the beginning of this year when he said that the risk of a US recession was 1 in 3, and has since said that recession risk had risen. Larry Summers (former US Treasury Secretary and Chief Economist at the World Bank) put the risk at 50/50 in September. The truly horrendous data coming from the US housing market makes us think that the risk of recession is probably greater than this.
What does this mean for high yield bonds? Well there’s a very close correlation between high yield bonds and economic growth – strong economic growth coincides with strong profits, low defaults and tight high yield bond spreads (ie high yield bonds become much lower yielding bonds). When the economy is in recession, more companies are going bust and high yield spreads tend to be wide (ie investors demand a big yield to be compensated for the significant risk that their bonds will blow up).
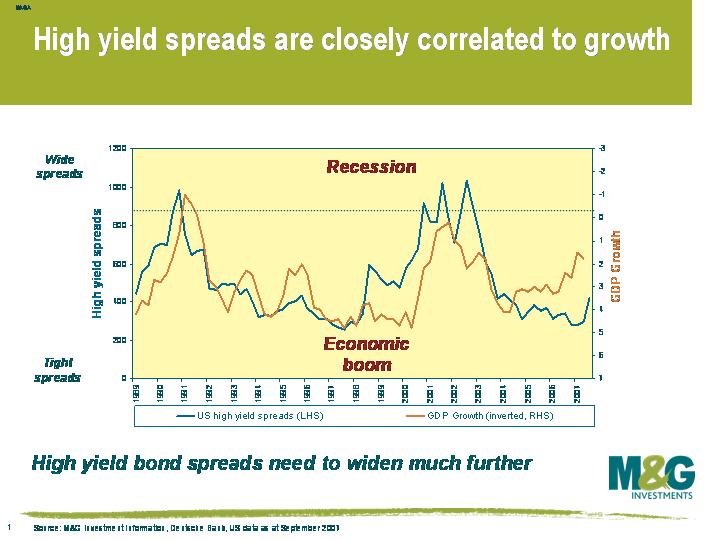 This chart shows that high yield spreads (left hand axis) are severely out of synch with US economic growth (right hand axis, inverted). There are three possible conclusions that can be drawn from the divergence of the lines. Number 1: this credit crisis will blow over and the US growth rate will jump back to 3%. Number 2: the correlation between growth and spreads has broken down (“it’s different this time”), or number 3: the high yield market is very expensive.
I favour number 3. US growth has been below trend for about a year, and yet high yield spreads actually reached their tightest ever levels in May this year. Spreads widened a bit over the summer, but are still close to all-time lows on an historical basis. And if you consider that US growth is likely to fall towards zero and possibly lower, then history suggests that the average high yield bond should yield around 12%, not 8%. A correction of this magnitude over the course of one year would result in double-digit negative returns. The European high yield market closely tracks the US market, and I remain very underweight of high yield assets across my portfolios.
Data from Moody’s shows that the global high yield default rate fell to just 1.27% in September, the lowest rate since March 1995. The global default rate has now been below 2% for 25 consecutive months, the longest stretch since 1978 (when the high yield market didn’t really exist).
The steady decline in the default rate has been a bit of a surprise – indeed, Moody’s model has been predicting a rise in the default rate for about the last two years. The likely reason for the model’s error is that companies that would have gone bust in previous cycles have escaped this time. In this liquidity-fuelled cycle, investors have been perfectly happy to bend over backwards for companies. Covenants have been broken, which legally allows bond holders to bring in the receivers and sell the company’s assets to recover their money, but investors have instead been happy to waive these breaches. In a worryingly large number of cases, troubled companies have been able to borrow even more money from investors to help them out of a hole.
Events of the past few months have resulted in liquidity drying up, and this almost unlimited supply of funding looks to be a thing of the past. Banks have had severe trouble getting financing lately, let alone rickety junk issuers, and the default rate should tick up as bond investors start to rein in lending.
Another indicator that defaults should pick up is that US interest rates have peaked. This chart (click to enlarge) shows that the global default rate has traditionally risen (and sometimes significantly) following the last Fed rate hike of a cycle. The observation makes sense – when the Fed believes it’s time to start slashing rates, the economy is usually a mess and monetary policy is too tight. Tight monetary policy means that there is little liquidity, it is expensive for companies to raise new finance, interest payments are high, all of which causes companies to run into difficulty.
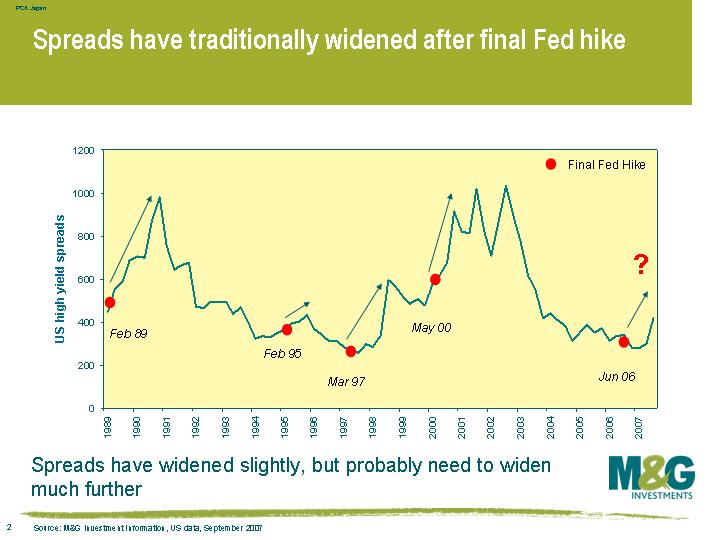
You get a similar story when you mark the high point of the US rate cycle on a graph of high yield spreads, which isn’t a shock seeing as spreads and defaults are closely correlated. As this chart shows, spreads normally start widening just before the final Fed hike in the cycle. This time around though, spreads initially tightened following the final rate hike in June 2006, and the long-awaited sell off only started in June this year. High yield spreads are still very tight on an historical basis, probably because the default rate is still so low. Spreads should widen in tandem with a rising default rate.
Confidence among US home builders has hit an all time low in October, breaking the previous record set in January 1991. All components of the survey were weak – present sales fell to an all time low (breaking the January 1991 record), future sales were unchanged (staying at an all time low), and prospective buyer traffic slipped below the previous record set in December 1990. The data suggests that the pain will continue until the huge overhang of properties begins to unwind. Bigger discounts and incentives have failed to revive demand, and further house price falls seem inevitable.
The report underlines Ben Bernanke’s comment earlier this week, when he said that the housing market’s contraction will be a “significant drag” on US growth into next year. The Fed “will continue to watch the situation closely and will act as needed to support efficient market functioning and to foster sustainable economic growth and price stability”.
As I argued on this blog in August (before the Fed cut rates by 0.5%), the Fed will have to act fast if it is to prevent a slide towards recession.
The US Treasury Department announced yesterday that August saw a record net outflow of $69.3bn from US assets (equities, notes and bonds). This is particularly alarming considering that expectations had been for a $60bn inflow. The outflow was a combination of international investors selling US assets, and US investors buying international assets.
Perhaps most interesting of all was that Chinese investors decreased their holdings of US Treasuries by $8.8bn, while the Japanese reduced exposure to US assets by $24.8bn. Richard recently argued on this blog that a falling away of Asian support for US assets should cause the dollar to weaken.
UK MBS backed by residential mortgages has suffered from the US crisis and Northern Rock debacle. Bonds that were rated AAA and yielded LIBOR + 10 basis point widened out to LIBOR + 50 basis points, although AAA spreads have tightened a little recently. Some BBB rated issues that were once yielding LIBOR + 50 basis points have widened out to levels usually associated with junk. Five year BBB paper now trades at around LIBOR +200.
Even at these levels, we are generally not buyers of residential MBS. As alluded to on this blog, our view is that this crisis has further to run. Credit rating agencies have downgraded lots of lower rated ABS/MBS deals, but are yet to make their move on a considerable number of so-called AAA rated bonds. When this does happen, we expect to see yet more repricing of this area of the structured credit market, and also anticipate some repricing in corporate spreads as former AAA deals crowd out A and BBB corporate land.
Taking a longer term view, it’s likely that residential MBS is going to be negatively impacted by a slowing of the housing market. Residential MBS will be hit hard if house prices fall, as delinquencies will inevitably rise. Slower repayment speeds on mortgage-backed deals will also slow the cycle of money being re-invested in new deals. ABS will not escape unscathed from a worsening consumer outlook either, as they are typically backed by things such as credit card repayments or car loans.
An area that looks a bit more appealing is the collateralised loan obligation (CLO) market – unlike CDOs, the underlying assets in CLOs consist entirely of leveraged loans, which are on the whole trading at attractive levels.


Sign up to the Bond Vigilantes mailing list to ensure you never miss a great article from our expert Bloggers. We will email all new articles to your inbox, meaning you can stay on top of the world of Bonds.
I confirm that I would like to receive information about Bond Vigilantes and products and services from M&G Securities Limited.
We will use the email address and personal data you have shared with us to send you this information. For existing customers, submitting your contact details and requesting to receive this information from us, will replace any earlier choices you have made in respect of marketing information.
You can unsubscribe from marketing at any time, at which point we will not send any further marketing information to you, by selecting the unsubscribe link in all communications.


