


Housing market : Down down, deeper and down
The US housing market is getting worse and worse, and the UK looks set to follow it
Yesterday saw the monthly update on the disaster that is the US housing market. Figures showed that the downturn is accelerating – the S&P/Case-Shiller Composite-20 Index showed that the US house prices fell 7.7% in the year to the end of last November. The S&P/Case-Shiller Composite-10 Index (which covers the 10 main US metropolitan markets and has a longer history – see graph) showed that house prices fell 8.4% in the year to the end of last November, the steepest fall since the index began in 1987. This is bad enough, but digging below the headline year-on-year numbers reveal a startling trend in the house prices. Taking the quarterly house price change, and annualising it, shows that the Composite-20 index fell 16.2%, while the composite-10 index fell 16.6%, which shows that the downward trend is quickly accelerating.

Then today we had the UK release of what I believe is perhaps the most important UK economic indicator, the number of mortgage approvals. We have discussed mortgage approvals numerous times on this blog (see here for our last comment), but it’s worth a brief recap. The housing market is the transmission mechanism for monetary policy – when the housing market is strong, the Bank of England increases interest rates to stop the economy from overheating. Higher interest rates slow the housing market, then consumer spending and economic growth both slow (both with a lag), then inflation falls (with a further lag), and finally unemployment starts rising as companies react to weaker growth by cutting costs. Any predictor of what’s happening to the housing market is therefore worth its weight in gold to figuring out what’s going to happen to the broader economy.
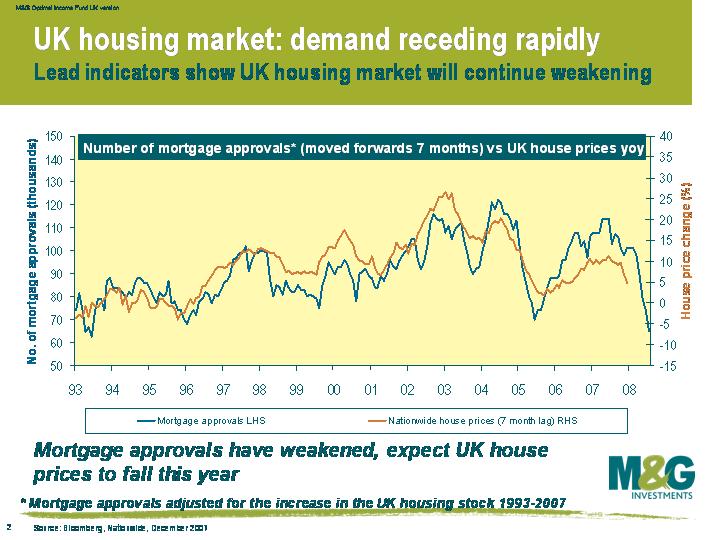
As you can see from this chart, today’s mortgage approvals number was shockingly bad. Since we last wrote about mortgage approvals we’ve made a slight adjustment to mortgage approvals, where we now adjust for the fact that the total UK housing stock has gradually increased over time. This makes recent mortgage approval data much more comparable to historical data, and improves the predictive powers of the mortgage approvals on the housing market. As you can see from the chart, the dramatic slump in mortgage approvals spells woe for UK home owners, and UK house prices look set to fall further over the next six months. The graph suggests that by the summer we’ll be seeing a year-on-year decline of around 5%.
What does a collapsing housing market mean for the central banks? It means that economic growth is set to fall very sharply. The US Federal Reserve is acutely aware of the risks, as a falling US housing market has always historically resulted in or coincided with recession. The Federal Reserve is being very active in slashing interest rates but the Bank of England has been slower to react, having cut rates only once so far. With UK rates at 5.5%, many rate cuts will surely follow. The Bank of England will not be maintaining the status quo.
The value of investments will fluctuate, which will cause prices to fall as well as rise and you may not get back the original amount you invested. Past performance is not a guide to future performance.
19 years of comment
Discover historical blogs from our extensive archive with our Blast from the past feature. View the most popular blogs posted this month - 5, 10 or 15 years ago!


Bond Vigilantes
Get Bond Vigilantes updates straight to your inbox