
Rolldown
A dispatch from the number crunchers – Yield curve rolldown
By Matthew Russell
15 April 2026

The chain of events that led to the Great Depression were extremely similar to the ones that led to the ‘lost decade’ in Japan. Firstly loose monetary and fiscal policy led to real estate and stock market bubbles. Then the bubbles popped, which resulted in a sharp fall in demand for housing (and a fall in housing investment), bank failure (since the banks had become reliant on asset prices rising), a credit crunch, a sharp drop in consumer spending, and recession.
In both cases, the authorities’ reaction to the crisis served to turn what would probably have been a ‘normal’ recession into something a lot worse. The US government of the early 1930s tried to stick to a balanced budget and this fiscal tightening resulted in the US money supply falling 25% from 1929 to 1933. The drop in the money supply caused deflation, which is the worst thing that can happen to a heavily indebted economy since it increases the real value of debts.
Quite unbelievably, the Japanese didn’t learn the lessons from the 1930s. They too tried balancing the budget in the face of a sharp economic slowdown and actually increased taxes (John Maynard Keynes would have been turning in his grave). The result? A drop in Japanese money supply, deflation, followed by a prolonged and severe recession.
The global economy today is following a very similar path to that which led to the Great Depression and Japan’s woes, but there’s one big thing missing – money supply is still rising. Ben Bernanke, one of the world’s leading authorities on recessions and depressions, has slashed rates to maintain liquidity in the system and US money supply has held up so far. The European Central Bank hasn’t cut rates yet, though, which could spell trouble for the Eurozone.
Why has the ECB been so slow? The reason is that its sole mandate is to control inflation and at the moment inflation indicators (which includes ‘M3’ money supply) are suggesting that, if anything, higher interest rates are needed. Figures this week show that the money supply is growing at a healthy clip, with the ‘M3’ measure rising by around 11.5% at the last release. This seems to more than contradict those that fear the supply of credit is falling, doesn’t it?
Well, a UBS analyst questioned the meaningfulness of this measure at the moment, for very interesting reasons: all these SIVs, CDOs, VIEs etc that have long been ‘hidden’ away in the Cayman Islands, Bermuda and Jersey and have been off European banks’ balance sheets, are now rapidly finding their way back onto banks’ books. And thus, as they come back onshore, the ‘M3’ money supply figure is rather artificially showing an inflation in the amount of corporate credit being provided to the economy.
So, let’s watch and see what happens, but it wouldn’t be that surprising for someone at the ECB to discover that this ‘growth’ in credit is not actually growth in any real, prospective sense, but is backwards looking credit growth. It may be that actual loans being made to corporates and people in the EU are not quite as healthy as the figures suggest. This realisation could cause a very quick about-turn in the rhetoric coming from the ECB regarding the future direction of inflation and hence interest rates.
Investors are almost becoming blasé to dire US housing market data releases, but the reality is that things are getting worse and worse.
The monthly S&P/Case-Shiller figures that came out on Tuesday showed that the US housing market downturn is now more severe than the one that led to the US recession in 1991. As the chart below shows, the S&P/Case-Shiller Index Composite-10 Index fell by 9.8% in the year to the end of December. In Q4, the index fell by 21.0% on an annualised basis. This index starts in 1987 – for a longer history, you need to look at indices such as the catchily-named ‘US New One Family Houses Sold Annual Median Year Over Year Price Change’. This index fell 15.1% in the year to the end of January, the biggest fall since records began in 1964.
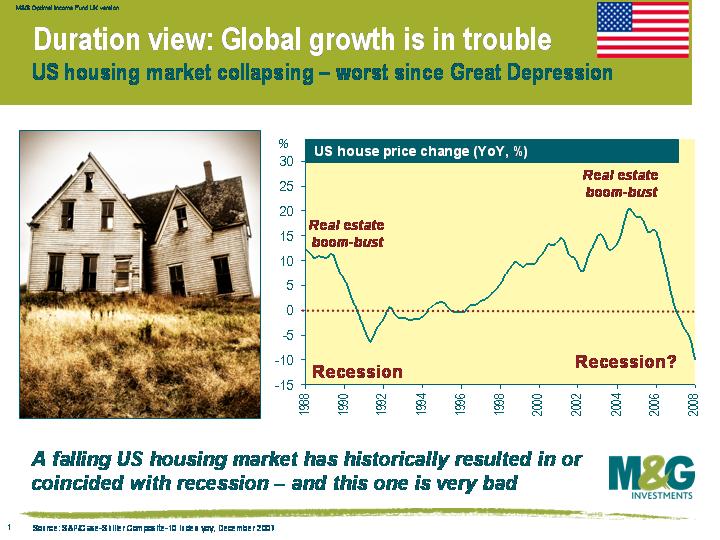
The excess supply of houses in the market suggest US house prices will continue deflating. The number of US homes for sale rose 5.5% to 4.2 million in January – at the reported sales pace, this represents 10.3 months’ supply, just below the record set last October. The months’ supply of new homes on the market rose to 9.9, representing the largest housing stock overhang in the US since 1981. US house prices will continue falling until this overhang is significantly reduced.
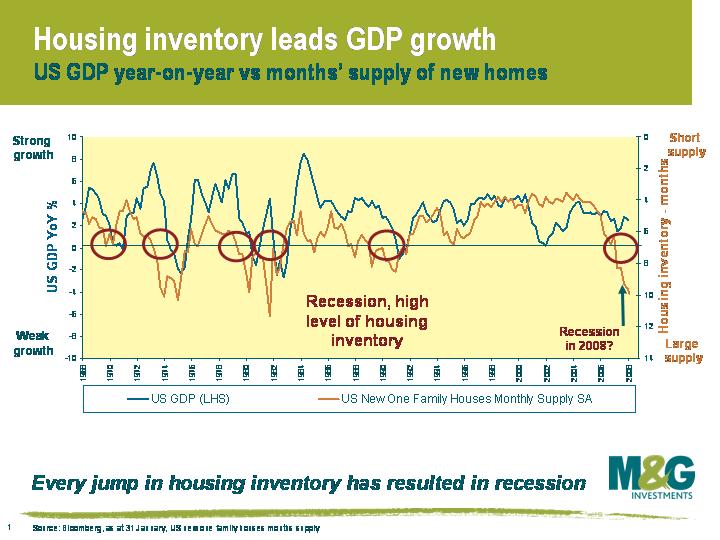
This chart shows that the months’ supply of new homes is a very good predictor of US recessions. When the months’ supply of new homes breaks above 7 months (as shown by the yellow line, inverted on the right hand axis), the economy goes into recession (blue line, left hand axis). A figure of around 10 months’ supply suggests the US is about to head into a nasty recession – worse than what we saw in 1991, more akin to 1974-5.
Ben Bernanke yesterday stated that US real GDP has ‘slowed sharply since the third quarter’, US consumer spending has ‘slowed significantly’ since the end of 2007, and that labour market conditions have ‘softened’. Furthermore, ‘the risks to this outlook remain to the downside…the housing market or labour market may deteriorate more than is currently anticipated and that credit conditions may tighten substantially further’. This is a clear indication that the Federal Reserve is prepared to lower interest rates further. The Bank of England now needs to act in a similar manner.
Banking Crisis – Change in inflation over next two years
Wall Street Crash (1929) – Fell from -1% to -10%
Savings & Loans (early 1980s)- Fell from 15% to 3%
Japanese bubble bursting (end 1980s) – Fell from 3.5% to 1%
Swedish Banking Crisis (early 1990s)- Fell from 10% to 2.5%
Asian Financial Crisis (1997)- Fell from 4.5% to 1% (Thai data as proxy)
Global Credit Crunch (2007-?) – ?
Sure, food prices are rising (and will stay high), and oil is $100 a barrel – but the key driver of inflation is the difference between actual growth and the economy’s potential growth. As the output gap opens up as growth slows, disinflationary pressure builds – there is overcapacity, and no supply of credit. With a combined share of around 15% of the inflation basket, higher food and energy prices will hurt consumers – badly – but unless they can negotiate higher wages in response (unlikely) they’ll have to reduce spending elsewhere. Thanks to the credit crunch, borrowing to finance discretionary spending will be more expensive and harder to find. Central banks need not worry about inflation – but they must stop the banking crisis from accelerating. Ben Bernanke knows this, and that’s why we could see a 1% Fed Funds rate later this year.
Porsche is beating the banks at their own game. In the ‘go-go’ pre-credit crunch days, the banks gave Porsche an overdraft facility, whereby Porsche had the option to borrow €10bn at a cost of only 0.2% over LIBOR. The banks will now be regretting that they’d offered this credit facility.
Even though we are now in a full-blown credit crunch, Porsche is still able to borrow from the banks at 0.2% over LIBOR. It can now lend this €10bn on for a profit to any one of the desperate borrowers queuing up for some short term finance. In the extreme, Porsche could actually borrow from a bank at 0.2% over LIBOR, and then redeposit this amount at the same bank at a higher rate for an instant profit. Porsche has outmanoeuvred the banks and created its own banking profit out of the banks’ largess.
Great news for Porsche, but very bad news for the banks. The banks made these cheap credit facilities available to a vast array of their corporate clients, and there will surely be a large number of companies following Porsche’s example. The banks will be forced into lending in large size at an uneconomic rate, which is unprofitable and adds further to their bloated balance sheet, making them more financially stretched.
This borrowing at one rate and lending at another by corporates is called a roundtrip, probably the most profitable round trip taken in a Porsche! It seems that Porsche not only make the best engineered cars, but are also better financial engineers than the banks.
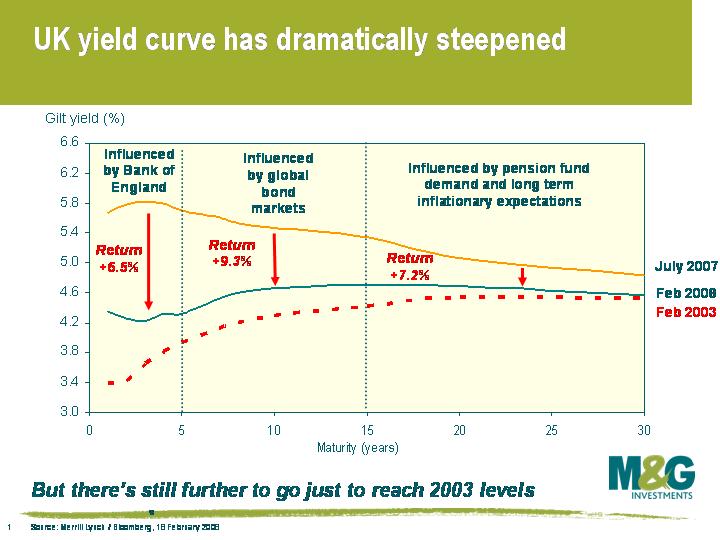 This chart shows how the UK yield curve has steepened dramatically since July 2007. Note that short dated yields have plummeted the most, which has been driven by a rapid change in UK interest rate expectations (in June 2007, Bank of England base rates were 5.75% and were expected to rise to at least 6% – by December, rates were 5.5% and were expected to fall to 4.75%). Note also that while 2 year gilts have experienced the biggest drop in yields, the best returns have actually come from medium dated gilts – this is because shorter dated bonds are much shorter duration, and short dated gilt prices are therefore a lot less sensitive to changes in yields.
To what depths can gilt yields go? Well the dashed red line in the chart shows where the UK yield curve was in February 2003, and the UK economy of February 2003 looks shipshape compared to the mess we’re in now. In Q1 2003, UK economic growth was 2.5% YoY, UK house prices had risen 25% YoY, and unemployment was slightly below its current level. The global economy was about to ride the wave created by US interest rates standing at 1.25% (Alan Greenspan’s final rate cut actually wasn’t until June 2003).
The UK economy of 2008 is rudderless and adrift – growth will do very well to exceed 2%, the housing market is about to capsize, and unemployment is likely to rise. The global economy is in the process of getting sucked into the whirlpool that is the US housing market. UK inflation is a slight headwind now (2.2% versus 1.7% in Feb 2003), and higher food and energy prices might push inflation higher over the coming months, but UK inflationary pressure should fall towards the end of this year as UK growth slows and spare capacity is created.
The gilt market has backed up a bit so far this year, and is now ‘only’ pricing in three 0.25% interest rate cuts in 2021/12. We think that rates are likely to fall by more than the market is pricing in. A worsening of the economic storm should see yields fall across the curve, and M&G’s bond funds are positioned long duration as a result.
Emerging market sovereign bonds have had a fantastic run. Since the beginning of 2003, Russian government bonds have returned 78%, while Brazil has returned 172%. Ecuadorian government bonds have returned a massive 253%. But we’re not interested in historical returns, we’re bothered about future returns. Are emerging market bonds good value now?
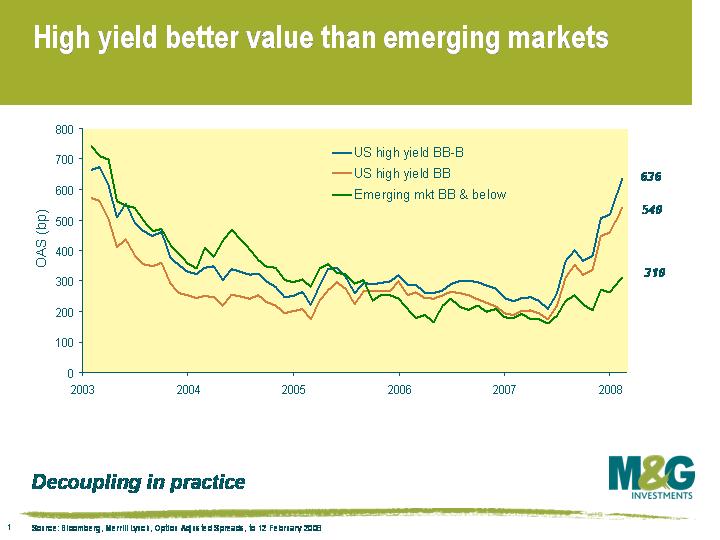
This chart shows the spread (ie the excess yield over US Treasuries) on emerging market bonds versus US high yield corporate bonds. I’ve compared an emerging market index against a US BB rated high yield index and a US BB&B rated high yield index. Based on the credit rating breakdowns, you’d expect the spread on the emerging market index to sit somewhere between the two US high yield indices.
As the chart shows, emerging market bond spreads followed the two US high yield indices fairly closely from 2003 up until the credit crunch, but the markets have significantly diverged since last summer. The average US high yield bond now pays about a 6% yield over a US Treasury, while emerging market sovereign bonds have hardly budged and only yield about 3% over US Treasuries. In fact the premium for investing in junk rated emerging market bonds is now about the same as investing in US BBB rated corporate bonds.
This looks to me like investors buying into the concept of ‘decoupling’, and as I argued here in December, I don’t believe in it. The emerging market economies will not come to the rescue of the global economy. Some investors seem to have forgotten that governments do actually default – in the last 10 years alone, we’ve seen the default of Argentina, Dominican Republic, Ecuador, Moldova, Pakistan, Russia, Ukraine and Uruguay. If anyone is still not convinced that governments default, then I thoroughly recommend skim-reading a paper from Reinhart et al – some great stats on pages 8-12: Spain defaulted 13 times between 1557 and 1882, France defaulted 8 times between 1550 and 1800 (debt restructuring “was often accomplished by simply beheading the creditors”) and Venezuela has defaulted 9 times since 1824.
I anticipate significant spread widening in emerging market bonds. The M&G Emerging Markets Bond Fund is positioned defensively, and currently holds 14% in US Treasuries and 6% in German bunds.
First Man Utd drops points to Arsenal, and then Man U’s shirt sponsor AIG admits that losses on credit derivatives were $4.88bn in October and November, four times worse than the company had previously stated. AIG’s auditor, PricewaterhouseCoopers, found “material weakness” in AIG’s accounting treatment of credit derivatives. AIG’s shares fell by 12% on Monday, the biggest one day fall in the company’s equity since October 1987. The risk of AIG defaulting on its debts rose sharply – 5 year CDS jumped from 156bps to 200bps on the news.
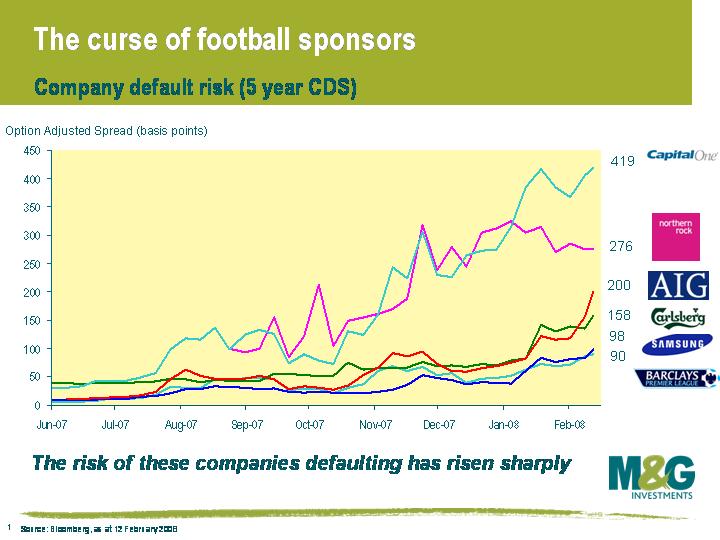
As this chart shows (click chart to enlarge), AIG is not the only shirt sponsor to run into trouble. Newcastle’s sponsor Northern Rock is in a spot of bother right now, to put it mildly. Carlsberg was put on review for a downgrade to junk bond status by Moody’s in January. Barclays (the Premier league sponsors) and Samsung are far from being in distress, but the risk of the companies defaulting has increased by a factor of 15 times and 10 times respectively since June last year. Unfortunately for Jim, the company facing the biggest risk of default on this chart is Capital One, sponsor of Nottingham Forest.
CDS doesn’t exist on a number of football sponsors – not included on this chart is F&C Asset Management’s parent company, Friends Provident, whose bonds have fallen 15% in the last four months on concerns that Friends Provident will be taken over by a closed life fund consolidator. Meanwhile Moody’s put Derbyshire Building Society’s ‘single A’ rating on review for a downgrade in January. (I don’t suppose it does Derbyshire Building Society a lot of good to be associated with possibly the worst team in premiership history either!).
The most famous example of a football sponsor going bust is Parmalat, whose fictitious earnings almost destroyed Parma football club. Real Madrid’s shirt sponsor BenQ went bust in 2006. But it’s not just clubs at the top of the table that are affected. Manchester City’s shirt sponsor, First Advice, went bust in 2003. Watford’s and Wycombe’s sponsor loans.co.uk went bust last year, while Charlton’s sponsor Llanera (a Spanish property company) went bust in January this year. US sport also appears to be cursed by the same issues – read here about Enron’s sponsoring of the Houston Astros or here on PSInet’s sponsorship of the Baltimore Ravens.
After a few teething problems, it’s not contentious to say that the euro has been a success. Helped by the US dollar’s demise, the euro is gradually becoming a rival as the reserve currency of choice for central banks. European unemployment has plummeted, and the European economy probably grew at around 3% last year. Some countries have boomed – Spanish economic growth has averaged about 4% over the past two years, while Ireland has done even better, with growth averaging almost 7% over the past decade. The unemployment rate in Spain 10 years ago was 20%, and it touched 8% last year.
The problem is, however, that some areas of Europe have been far too hot. ECB interest rates may have been about right for Germany or France, but they have definitely not been high enough for countries like Ireland and Spain. As we know so well from the US experience, artificially low interest rates cause asset price bubbles. Spanish and Irish property markets were el scorchio until recently, but the house price chart for Ireland looks uncannily like that of the US – double digit house price growth from 2000-06, followed by a slump of -7.3% for 2007. Spanish and Irish banks are now in serious trouble due to their huge property exposure.
European economics is about to get very, very political. How will Irish politicians react if the Irish economy enters a depression? Will they sit quietly while the ECB keeps interest rates on hold, and continues its tough talk on anchoring inflation expectations? How will the Irish public react when unemployment surges? Spain’s prime minister, Jose Luis Rodriguez Zapatero, kicked things off this week by saying that the ECB will cut interest rates by 0.5% this year. The ECB would have been none too impressed, given its obsession with appearing unified in its rate decisions and its communication to financial markets (Bank of England style voting results are inconceivable).
A big recession in Europe could put the European Monetary Union (EMU) at risk, as leaders accountable for their struggling economies decide that they’re better off in control of their own monetary policy.
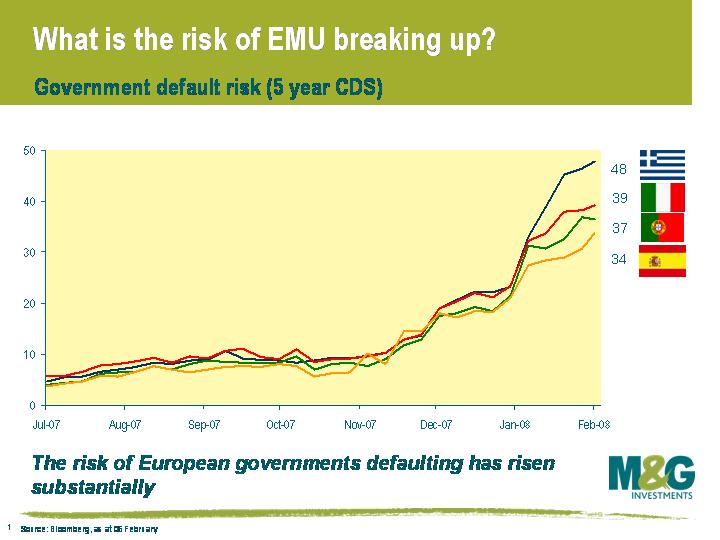
This chart is fascinating as it shows that financial markets are starting to consider the potential of EMU breaking apart. If EMU collapsed, you can be sure that countries such as Italy, Greece and Spain would trade at a much wider premium than they do now (particularly if an economic depression in these countries was the reason for EMU falling apart). As the chart shows, the cost of taking out insurance on Greek government bonds defaulting in the next five years is now 0.5% (as shown by 5 year CDS spreads). When the credit crunch began in July 2007, the cost of insurance on Greek government bonds was 0.05%. To put the figure of 0.5% into context, this is where Astrazeneca or Glaxosmithkline 5 year CDS trades right now, and is where Societe Generale senior 5 year CDS traded less than a month ago.
I believe that the risk of EMU collapsing is very small, precisely because the ECB will do anything to stop it from happening. The breakup of EMU will mean the death of the ECB, so it’s hardly in their interests. As European economic data continues to weaken over the coming months, I believe the ECB will start to downplay the inflation risks and increase emphasis on downside risks to growth. Then, from the summer, I think they will start a cycle of interest rate cutting. For this reason, I have moved longer duration in the M&G European Corporate Bond Fund, as I believe rates will fall by more than the market is pricing in.
I enjoyed this article, entitled “The Last Asset Bubble“.
US treasuries have enjoyed an incredible rally, returning 11.2% since the end of June. This has been driven by the sub-prime debacle and the Fed’s decision to cut rates from 5.25% to 3%.
Treasuries have also been supported by panicked investors fleeing from other AAA asset classes that are no longer AAA in any real sense of the word. The article makes an interesting case that returns from US Treasury bonds have peaked, and that now is possibly the time to move some of these positions elsewhere. US Treasuries of all maturities have rallied substantially, and yields haven’t been as low since Fed Funds were at 1% under Greenspan.
Consensus appears to be that a continued easing of Fed Funds will see a continued tightening in yields, and so rising prices, in longer-dated US Treasuries. But this article cites some interesting arguments for there not being much further room for yields in US government bonds to fall as the market is already pricing in further US rate cuts. The awkward consequence of this for the Fed, if the argument holds, would be that monetary policy easing could become ineffective in terms of reducing the cost of money in the economy, or increasing liquidity.


Sign up to the Bond Vigilantes mailing list to ensure you never miss a great article from our expert Bloggers. We will email all new articles to your inbox, meaning you can stay on top of the world of Bonds.
I confirm that I would like to receive information about Bond Vigilantes and products and services from M&G Securities Limited.
We will use the email address and personal data you have shared with us to send you this information. For existing customers, submitting your contact details and requesting to receive this information from us, will replace any earlier choices you have made in respect of marketing information.
You can unsubscribe from marketing at any time, at which point we will not send any further marketing information to you, by selecting the unsubscribe link in all communications.


