
Rolldown
A dispatch from the number crunchers – Yield curve rolldown
By Matthew Russell
15 April 2026

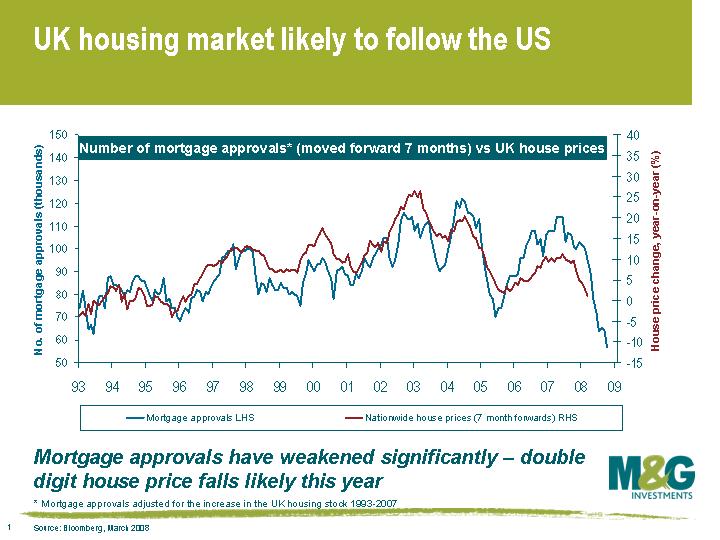 We try to look beyond the headlines, and look at real numbers. As we have previously pointed out, it is not just the headline amount that matters but the ratio of new mortgage approvals relative to the available size of the UK housing stock. So comparing mortgage approvals last month to mortgage approvals in the early 1990s is wrong, because the UK’s housing stock has risen by about 0.8% per year. The headline unadjusted number is a record low, but adjusting for the growth in the housing stock makes this number even worse. The outlook for the housing market (and hence the economy) is therefore bleaker than headline figures suggest.
The big question is are these approvals a momentary spike down, or are they going to get worse? The anecdotal evidence sadly points to ongoing falls in this number. This is due to the mortgage lenders’ decision to change their lending and business plans in the face of the credit crunch. Northern Rock typifies the change – this time last year they had the largest new market share, but they are now shrinking their total mortgage lending. The ongoing credit withdrawal is continuing. Nationwide yesterday announced that they won’t lend to a new buyers on their base mortgage rate without a deposit of at least 25%, and they’ve also decided to stop lending more than £500,000 per property. This will further hit buyer demand.
The foundation of the UK residential property market is the first time buyer and the availability of credit. If these impetuses disappear, then the credit drought could cause damage to the UK property market that will take years to repair.
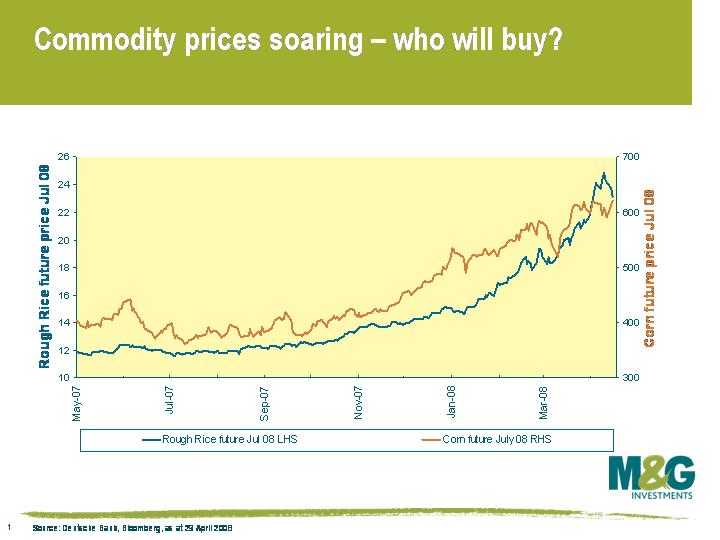 Inflation is public enemy number one for us because it picks our pockets by eroding the real value of our bonds. The latest twist to the inflationary story is the rapid rise in food prices, from the staples of wheat to rice (click chart to enlarge).
Normally central banks can dismiss volatile food prices as temporary, because prices are influenced by random effects such as drought and weather patterns. These temporary blips should not cause second round effects (eg higher wages) and therefore shouldn’t enter the inflationary food chain – indeed, the Federal Reserve targets core inflation, which strips out food and energy (see previous blog comment).
However this time around, worrying signs of political interference are resulting in inefficient economic outcomes. The policy response to food shortages in Argentina has been to raise tariffs on exports, meaning that food floods the domestic market and prices stay low. It could be their funeral, as Argentine farmers will likely react by planting less wheat, which drives the price of wheat higher and its supply lower. Shortages will be back soon – Adam Smith would not approve.
Argentina’s policy approach is being replicated by other countries around the world (eg Russia, Ukraine, China, Serbia, Kazakhstan, Egypt, Vietnam, Indonesia, India, Cambodia and Venezuela). This kind of inflationary protectionism is a worry for bond investors, as food price rises will cease to be short term and temporary, and could instead become long term and permanent. Food forms around half of poorer countries’ consumption, and government actions to keep prices down are therefore understandable. But policy markers should be reviewing the situation with regard to the long term implications, rather than do anything for short term popularity.
With food inflation hitting record highs, and oil at over $115 per barrel, it’s difficult to see that policy makers might be more worried about deflation than inflation. In fact a bit more inflation in the global economy might be secretly felt to be a good thing – anything that erodes the consumer’s debt burden could help economic growth get back towards trend. But as Jim pointed out (see article here) credit and banking crises are always disinflationary, or outright deflationary – and ditto recessions. We still expect lower rates, but also that other non-monetary policy measures will continue to be used (tax refunds, bank bailouts etc.). This fascinating 2002 Fed paper by Ben Bernanke (“Deflation: Making Sure “It” Doesn’t Happen Here“) sets out what the current Fed Chairman thinks can be done when interest rates hit zero, and deflation threatens.
Sunday night’s TV showing of The Aviator told the remarkable story of Howard Hughes, who as well as being an engineer, Academy Award winning film director, and a little nuts, was also one of the world’s richest men. It covers the early years of the airline industry, focusing on TWA‘s battle with Pan-Am (Hughes had to take on Pan-Am and the US government in attempt to end Pan-Am’s monopoly as an international carrier).
The film chronicles Hughes’ constant battle to prevent TWA from going bankrupt, and in the 60 years that have since passed, very little seems to have changed in the airline industry. The industry is a graveyard – Pan-Am went bust in 1991, while TWA entered bankruptcy in 1992, 1995 and finally in 2001 (after which it was taken over by American Airlines). Other high profile bankruptcies have been Swissair and Sabena (Belgium’s national carrier). Numerous airlines have filed for bankruptcy protection and re-emerged after restructuring (eg Delta Airlines, Northwest Airlines, United Airlines, Air Canada). See here for a comprehensive list of defunct airlines.
We’ve written on this blog before about how global defaults have remained remarkably low, partly because companies that would have gone bust in previous cycles managed to escape in the recent liquidity fuelled cycle (see article). But now that money is no longer being thrown at unprofitable companies, we’re starting to see the number of defaults pick up. The airline industry is unsurprisingly being hit particularly hard. In the last few weeks alone, four US airlines have filed for bankruptcy protection (budget carrier Frontier Airlines, Aloha Airlines, ATA and Skybus). Hong-Kong based airline Oasis also collapsed recently. Silvio Berlusconi is desperately trying to find a buyer for Alitalia, and Aeroflot are the current favourites (some match up that will be).
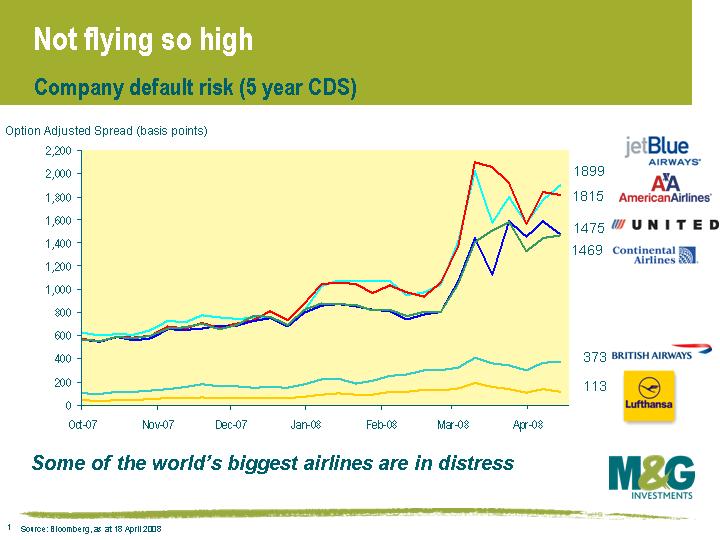
This chart (click to enlarge) shows the 5 year CDS on some of the world’s best known airlines. Lufthansa (which is BBB rated) and British Airways (BB rated) are holding up OK, but Continental Airlines, United Airlines and American Airlines are all trading at distressed levels. Record high oil prices, competition from low cost carriers, high operational leverage, environmental concerns/costs and of course the big threat of economic recession are likely to make matters a whole lot worse.
Warren Buffet had a point when he said that (as at 1992) “the money that had been made since the dawn of aviation by all of this country’s airline companies was zero. Absolutely zero.”
The government’s official unemployment rate (which looks just at the number of people claiming benefits) stands at 2.5%, the lowest rate since 1975. The UK unemployment rate under the International Labour Organisation’s measure stands at a slightly more realistic 5.2%, which is higher that 2003-06, but still way below the long term historical average.
A widely held view is that the UK economy will be OK, because unemployment is low. This view is misplaced. History suggests that unemployment is a lagging indicator – that is, it’s one of the last things to turn in an economic slowdown. What has normally happened in the past is that house prices fall, then consumer spending falls (and economic growth therefore slows), then unemployment rises, and finally inflation starts to fall as spare capacity is created in the economy.
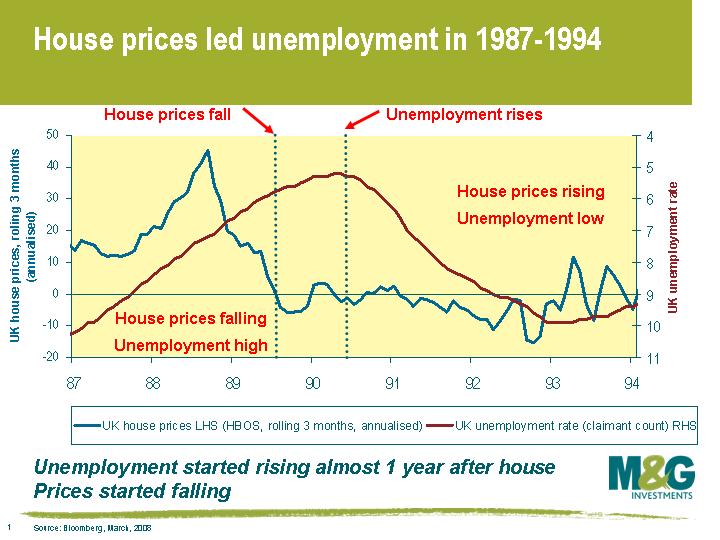
This graph shows what happened in the UK’s last recession. House prices are represented by the blue line, and we’ve looked at house price changes on a rolling 3 months (and annualised). UK unemployment is the red line, and is plotted against the right hand axis (inverted). Last time around, UK house prices started falling in mid- 1989, but unemployment didn’t start rising until mid-1990.
Unemployment is a lagging indicator because it takes companies a while to realise that the economy is slowing. Once companies realise this, it then takes them a while to lay people off. So if you want to get an idea of what’s going to happen to the UK economy (or indeed the US economy), look at the housing market, not the unemployment rate. Anyone who’s focusing on unemployment as a measure of the state of the economy is likely to be well behind the curve
So how far could UK house prices fall? The IMF said last autumn that UK house prices were 50% above where their models suggested house prices should be, although this month they toned it down to 30%. The honest answer is that nobody knows how far prices could fall, as there is a huge margin for error on long term economic predictions. We tend to stick to shorter term projections, and look at things like mortgage approvals. Mortgage approvals are a reliable predictor of UK house prices six or seven months ahead, and current data implies year-on-year falls of between 5% and 10% by early autumn (and this projection is likely to worsen, because the banks are becoming increasingly reluctant to lend, which means that mortgage approvals and hence house prices could fall much further).
If we were to have a longer term guesstimate, history suggests that when the UK housing market crashes, it tends to fall about 25%-30% from peak to trough in real terms. But given that UK house prices rose about 270% from 1995 to the end of 2007, there’s a risk that this current crash (and it is a crash) could be worse.
Let’s assume, then, that UK house prices fall by 30%. How much do homeowners stand to lose? A lot of homeowners will think that they’ll lose 30%, but they’re wrong. It’s actually a lot more. Buying a house is a leveraged investment, and the degree of leverage depends upon how big your mortgage is in relation to the value of the house. Consider someone who has a house worth £400k, and whose charitable parents have coughed up £200k for a deposit. If house prices fall by 30% (so their house falls to £280k in value), they’ve lost £120k. Unfortunately house price falls don’t make mortgages smaller, so if they sold their house, they’d only get £80k of their £200k deposit back. This means that they’ve lost 60% of their money.
Then consider someone who put up a deposit of £80k to buy this hypothetical £400k house (so that’s an 80% mortgage). A 30% fall in the value of their house leaves them in negative equity – their £80k deposit is wiped out, and they owe £40k. Maybe this person is one of the 20,000 people in the City who are forecast to lose their jobs. This wouldn’t have been a big problem in the 1990s, when the government generously agreed to pay the interest on anyone’s mortgage if they were made unemployed (no matter how big your mortgage). Now, you can only receive assistance on the first £100,000, and you’re not eligible to mortgage relief if your partner works more than 24 hours per week or if you have more than £16k of savings.
You can see from the examples above how a house price crash would have severe consequences for the economy. Due to the leveraged nature of home buying, a housing crash can greatly reduce the spending power of consumers. It’s no coincidence that house price crashes result in (or occur at the same time as) recessions. The only way out is for central banks to slash interest rates in order to encourage borrowing again, which will eventually revive the housing market.
Continental European economic data has held up reasonably well so far. Consumer and business confidence has been reasonably robust in countries such as France and Germany, although retail sales numbers released earlier this week were weaker than expected. The big problem for the euro area has been a worrying rise in inflation (European inflation reached 3.5% in March, the highest rate in 16 years and well above the 2% target), and this has meant that European bond markets have erased the rate cuts that were priced in only a few months ago.
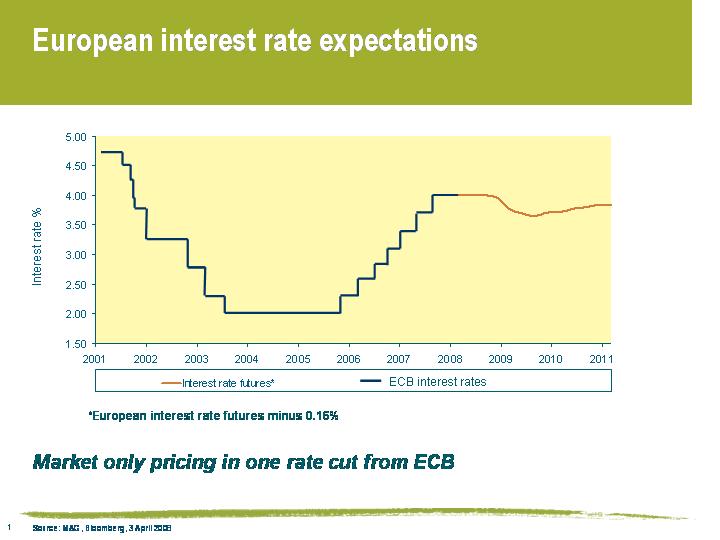
As this chart shows, European bond markets are now pricing in just one 0.25% rate cut* from the ECB, and this isn’t expected to occur until spring 2009.
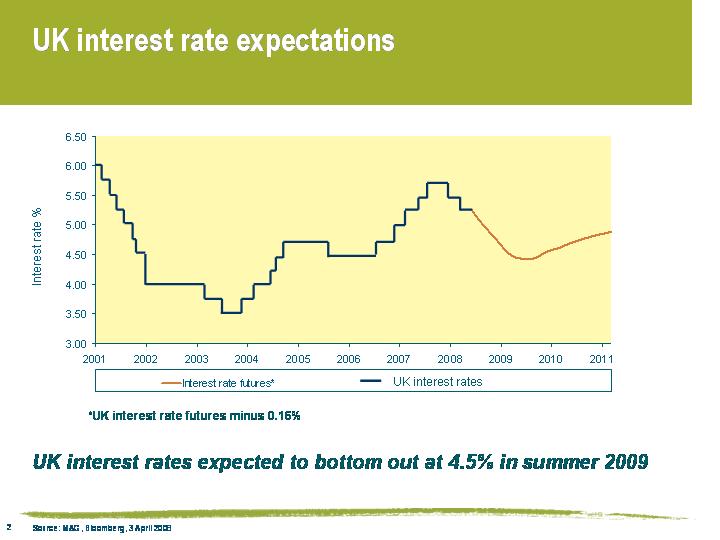
The UK bond market is being a little more aggressive, with three 0.25% rate cuts fully priced in by June 2009. This is because UK inflation is more under control that in Europe (prices in February were 2.5% higher than they were a year earlier), and because the UK economy is looking very vulnerable (figures from Nationwide show that UK house prices have fallen five months on the trot).
Do the UK and European bond markets’ expectations look reasonable?
If you believe that the effects of the credit crunch will be contained in the US, and that inflationary pressure will remain (or get worse), then yes. But if you buy into our view that economic growth is set to weaken (possibly dramatically), and that inflationary pressure will subside (see Jim’s recent article here), then good quality bonds look rather attractive right now.
*Historically approximately 0.16% has needed to be subtracted from UK and European interest rate futures to arrive at implied interest rate expectations. However, recent distortions in the money market have made interest rate futures analysis a little less reliable, particularly over the very short term. The market may therefore be pricing in slightly more in the way of rate cuts than mentioned above.


Sign up to the Bond Vigilantes mailing list to ensure you never miss a great article from our expert Bloggers. We will email all new articles to your inbox, meaning you can stay on top of the world of Bonds.
I confirm that I would like to receive information about Bond Vigilantes and products and services from M&G Securities Limited.
We will use the email address and personal data you have shared with us to send you this information. For existing customers, submitting your contact details and requesting to receive this information from us, will replace any earlier choices you have made in respect of marketing information.
You can unsubscribe from marketing at any time, at which point we will not send any further marketing information to you, by selecting the unsubscribe link in all communications.


