
Rolldown
A dispatch from the number crunchers – Yield curve rolldown
By Matthew Russell
15 April 2026

Moody’s rating agency recently released an interesting (if not a little belated) paper arguing that recovery rates on both defaulted loans and bonds in the US will be significantly lower than has historically been the case. In the past few years, the appetite for senior secured loans and corporate bonds has increased dramatically, due to leveraged borrowers being only too happy to fill their boots given the relatively cheap and abundant financing available. Loans, therefore, now form a greater portion of capital structures than has traditionally been the case. As a result, the recovery rate on loans, which occupy a senior position in a company’s capital structure, are likely to be lower. Holders of defaulted loans have historically got 87% of their money back, but this is forecast to drop to 68%.
There are implications for high yield bond holders too. As a result of the average bond having more loans ahead of it in the capital structure, bond holders are further back in the queue for the company’s assets if the company defaults. Moody’s believe that recovery rates on US senior unsecured high yield bonds will drop from 40% to 32%, while the recovery rate on subordinated bonds will drop from 28% to 18%. These numbers may be on the conservative side, judging by the involvement of non-traditional players (eg hedge funds) in the senior bank loan market who may well act in a more aggressive fashion to the detriment of subordinated lenders.
Moody’s specifically refer to the US bond market, where both loan issuance and covenant-lite loan issuance has been heavier than in Europe. We’d therefore expect recovery rates in Europe to be a bit higher than in the US. Nevertheless, for a given bond, the prospect of a lower recovery rate means that we should be compensated in the form of higher yields. Thorough analysis of the capital structure and covenants of every bond we invest in becomes ever more important.
I came across a slightly tongue-in-cheek website this week collecting signatories to petition against the ECB’s ‘intent to increase rates.’ It hasn’t had a great deal of success so far; a mere 5468 signatories out of a European Union population of around 500 million. Spain, which incidentally is likely to suffer more than most from a rate rise, has provided more than its fair share of the 5468 votes. Whilst the petition does highlight a couple of serious issues, pointing to weak consumer sentiment and retail sales for example, I’ve got a sneaking suspicion the petition won’t way too heavily on the minds of the ECB Governing Council when they meet next month.
Today’s mortgage approvals numbers came out at a record low (see this comment for why we love mortgage approvals so much). Weakening mortgage approvals is no surprise – the housing psychology is moving to a bear market from a buyers perspective, and the mortgage lenders are strapped for cash so the number of willing providers of finance is collapsing. But it’s the pace of the decline that is startling. This free fall in lending creates a vicious spiral, with a subsequent free fall in house prices. Our adjusted mortgage approvals number now predicts that UK house prices will be dropping by at least 15% year-on year by December this year (see chart).

Like any free fall, the damage is a function of where you jump from. Sadly for the UK economy, we start from the highest point in the western world. Recent research from the Bank for International Settlements (BIS, see graph 3B) looked at the house price to income per capita ratio (this is the housing market equivalent of the P/E ratio) across a selection of economies. They then compared the ratio to the 1995-2005 trend to get an idea of how far each country’s housing market has deviated from its historical ratio. As at 2007, the UK housing market was the most overvalued, closely followed by Spain. The UK housing market was twice as overvalued as the US housing market, so we certainly shouldn’t rule out the possibility of the UK having a property meltdown worse than that in the US.
Housing market crashes historically take two to three years to work their way through, and given that the past decade has seen the biggest housing boom, there is every reason to expect that the following bust will be bigger and will take longer than has been the norm. If things continue deteriorating at the current pace, then pain in the financials and construction sectors will spread way beyond the likes of Bradford & Bingley or Taylor Wimpey.
Jean-Claude Trichet at the European Central Bank has the same headache as Ben Bernanke and Mervyn King. Economic growth is set to slow sharply, at least if Tuesday’s ZEW survey of Eurozone growth expectations is anything to go by. Weakening growth would normally mean lower interest rates, but the ECB’s hands are tied because European inflation leapt to 3.7% in May, the highest rate since June 1992.
Trichet’s recent tough talk suggests that the ECB will hike rates to pull back inflationary expectations, and the European bond market has responded by pricing in at least two rate rises by this time next year. Higher interest rates will help bring eurozone inflation down, but it will also put the weaker eurozone countries under a lot of pressure.
Add into the mix Ireland’s ‘no vote’, and it’s clear that there are some big challenges ahead for Europe. As this chart shows, the default risk of the PIIGS (Portugal, Italy, Ireland, Greece and Spain) has started creeping up again. In fact, there are already signs that euro notes aren’t homogenous any more – notes printed in Germany appear to be carrying more value than euros printed elsewhere.
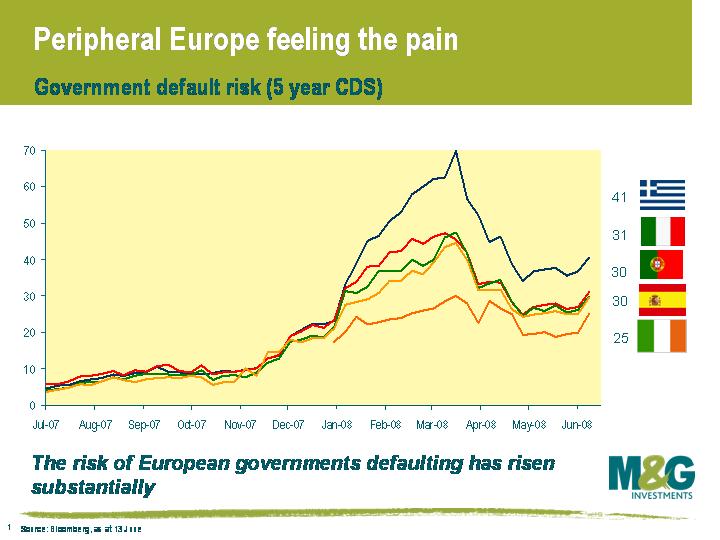
The breakup of the euro is still very unlikely, but just an increase in the perceived risk of the currency failing has big implications. For example, if Italy decided it would be beneficial to drop out of the euro and introduce a new lira, then you can be sure that Italian government bonds would have a much bigger risk premium relative to German bunds, and companies such as Telecom Italia won’t be trading where they are now. What we’ve seen in the past few months is that the bond market is starting to price in this risk.
Short dated European bonds experienced a huge sell off last Thursday, after Jean-Claude Trichet surprised the market by stating that the ECB is now on ‘heightened alert,’ interpreted by many to mean a rate hike is very much on the cards next month. The yield on two year German bunds jumped by 29 basis points, or 0.29%, which was easily the biggest daily jump in 2 year bund yields since the index began in 1990 (this is still some way below the US record of 4th October 1982, when 2 year Treasury yields soared by a record 146 basis points).
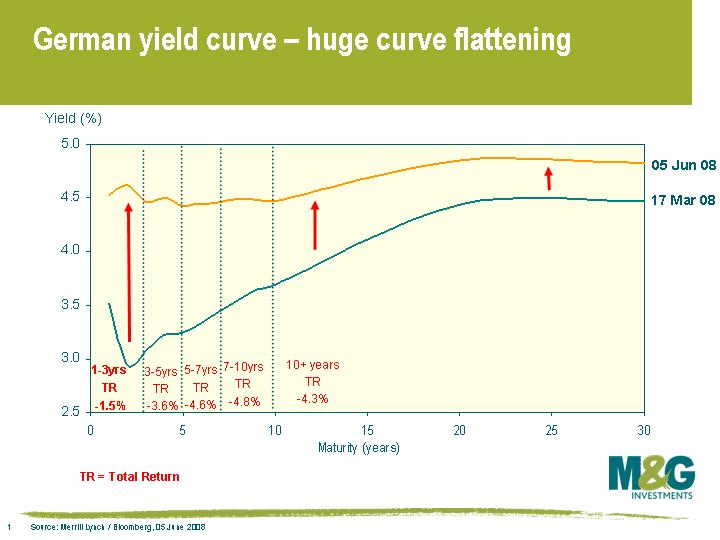
This chart shows how the German yield curve has dramatically flattened since Bear Stearn’s rescue in March, and as can be seen by the returns on the chart, medium dated bunds have been hurt the most (note that this is in local currency terms).
Whilst Trichet appeared to prepare the market for a rate hike next month, he stopped short of pre-committing to such an action. This is no doubt a lesson learnt from last autumn, when the credit crunch forced the ECB to pull out of a rate hike that had been pre-signalled the previous month. The hawkish tone demonstrates that the ECB are clearly very concerned about inflation running considerably above its 2% target – indeed, inflation has been above 3% since last year. However, the change in tone seems to have been borne out of a fear that Europe could begin to witness second round effects, as wages adjust higher to keep pace with headline inflation and longer term inflation expectations lose their anchors.
The likelihood is that inflation will remain above the ECB’s comfort zone at the same time as growth begins to slow markedly, undoubtedly posing a significant dilemma for the Central Bank. The combination of a weakening labour & housing market, tighter credit conditions, a strong euro, further banking sector writedowns and a weakening European consumer mean tough decisions lie ahead.
Stefan and I have just got back from a trip to visit our counterparties in New York. The mood is almost universally gloomy with – predictably – housing and gas prices the dominant themes. The TV news channels run an almost constant stream of features on the cost of motoring (a gallon went through the $4 mark for the first time at the weekend, up from $3.10 a year ago, a 30% rise), with interviews with disgruntled car owners explaining why they are staying at home during the driving season. One news channel has a permanent banner at the bottom of the screen saying “America’s Oil Crisis” – it’s as big a deal as “America’s War on Terror” post 9/11.
It’s difficult to see that this (and higher food prices) in an environment of plummeting house prices (down over 14% year-on-year) won’t lead to a collapse in consumption. As consumption is over two-thirds of US growth, a recession still looks likely. But there are a couple of things that do mitigate the doom and gloom for the US consumer. Firstly is the fiscal stimulus from the tax rebate cheques which have given most families anything from around $600 to $1500. About 30-40% of this money is likely to be spent rather than saved or used to repay debt. So retail sales numbers for May, June and July could look surprisingly strong and keep GDP growth in positive territory. There are rumours of a further tax stimulus package later this year too.
Secondly, employment is much stronger than it was at the time of the 2001 downturn. Then, the economy was regularly shedding from 150,000 to over 300,000 jobs monthly. Last month’s reading was a loss of 49,000 jobs and the biggest monthly fall so far was March’s 88,000. We’ve talked before about the possibility of big negative revisions to these recent data, but nevertheless the employment background is less of a headwind to growth than it has been historically. Why? Well the 2001 recession was a corporate recession – companies had spent too much on capex (during the tech bubble) and had got their balance sheets in a mess, taking on too much debt. Corporate recovery was about sorting out balance sheets (hence the rally in corporate bonds incidentally) and about downsizing the workforce. As a result they are going into this downturn with a much leaner labour force and won’t need to cull like they did last time.
So what we are seeing is that firms are not laying off employees like they did in the early 1990s. But they are cutting back on hours worked, and more importantly, for those people who don’t have a job, finding one is becoming extremely difficult. The persistency of unemployment is increasing. The unemployment rate is rising (to 5.5%) and the jobs slowdown is spreading to all sectors of the economy – but for the time being it is the cost of living increase that is hurting, not (yet) the loss of income.
A couple of final thoughts. The strains in the financial system persist despite the Fed’s bailout of Bear Stearns. Banks still won’t lend to each other, even at rates significantly above official market rates. There remains a stigma about using the Fed’s new discount window (open to brokers as well as banks) – nobody wants to be the next Bear Stearns, and rumours can still bring down weaker players. Inflation (and stagflation) worriers can, however, take heart that the Fed has not yet been using the most powerful piece of technology known to man (to paraphrase Ben Bernanke) – the printing press – to create US dollars. The size of its balance sheet remains almost unchanged since July 2007, and it has plenty of ammunition left to respond to further liquidity needs by the market before it has to start cranking up the handle and printing dollar bills.
On the credit front, the days of easy money are over for companies, and not only because of wider credit spreads. A feature of the corporate markets over the past few years has been the ease by which companies have been able to waive covenants on their debt when they got into difficulties. With the wall of capital having disappeared, bankers are playing hardball. Not only is the number of requests for covenant amendments increasing, but the costs are too. Permission might have been granted for free a year or so ago – now, for covenant renegotiations relating to financial performance a typical waiver “fee” might be 2.25% of the loan value, or an increase in the lending spread by 150 basis points per year. The Fed’s Senior Loan Officer Survey shows that lending standards more generally are tightening: 70% of the 100 odd banks surveyed in April had increased loan pricing to their corporate customers. Default rates remain super low – but for how long?
We only had time for one quick beer before heading back to the airport, at Welcome to the Johnsons in the Lower East Side. A year ago a can of Pabst Blue Ribbon there was $1. Now it’s a punitive $1.50. A sad indication of the global food price inflation trend. Elsewhere in the Manhattan bar scene we heard that prohibition style speakeasies are making a comeback, with drinking dens hidden behind, for example, telephone booths. The US prohibition ran from 1920 to 1933, covering the period of the Wall Street Crash and early years of the Great Depression – but that is surely coincidental.
US data released last week showed that US house prices fell by 14.4% in the year to the end of March (this is the S&P/Case-Shiller Composite-20 Index, which the market tends to focus more on – the S&P/Case-Shiller Composite-10 Index was down 15.3%). The track record of these indices is not very long though – the composite-20 index goes back to 2000, while the composite-10 index began in 1987. So Robert Shiller, who is the cofounder of the index, has calculated the change in both nominal and real US house prices going back to 1890. As shown on our chart below and reported in this week’s Economist, US house prices are now falling faster than the -10.5% rate witnessed in 1932. Given the month-on-month declines of more than 2% that we’re currently seeing, it should only be a few more months until the year-on-year record of -16.1% is broken, which dates back to 1901.
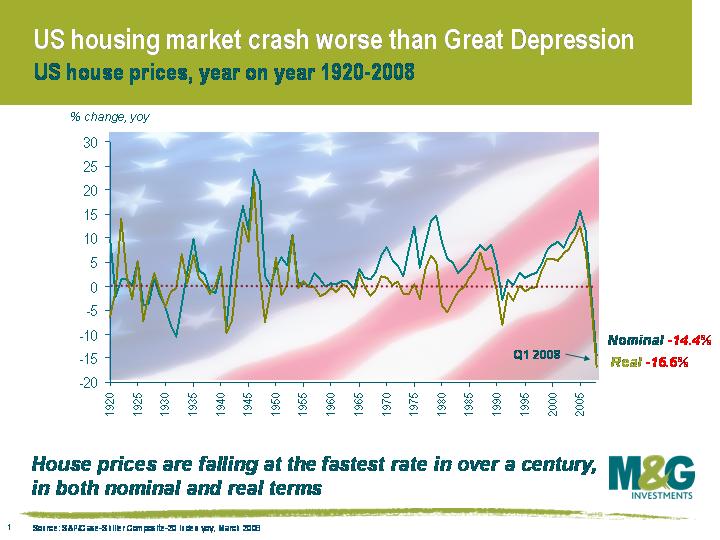
US nominal house price falls are bad enough, but the picture is even worse in real terms (ie adjusted for inflation). Real US house prices are currently falling by 16.6%, which is easily the worst figure on record. In 1932 for example, the US economy was experiencing deflation of 10.1%, so real house prices were only falling by 0.4%. The US housing market doesn’t appear to be anywhere nearer reaching the bottom either – the supply of houses on the market is very close to all time records, and house prices will have to continue falling until this is cleared.
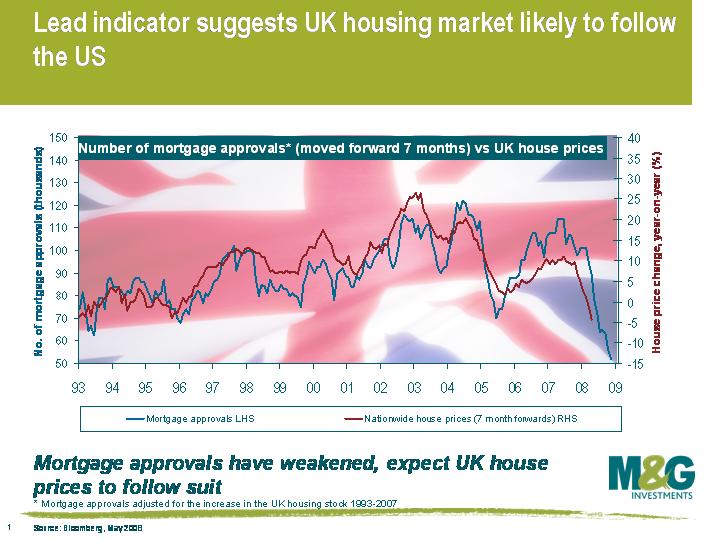
The UK housing market looks like it is rapidly following the path set by the US. Nationwide have UK house prices falling by 4.4% in the year to the end of May, while HBOS today reported that house prices are down 3.8% over the same period. Taking the last three months of the Nationwide index and annualising it shows that UK house prices are dropping at an annual rate of 17.0%. HBOS’s index has registered monthly falls of -2.5% in March, -1.5% in April and -2.4% in May, which equates to an annualised rate of -25.1%. And unfortunately, UK house prices are set to fall a lot further. We’ve charted the progress of mortgage approvals over the past 18 months (see here for Richard’s comment at the end of April), and as you can see from our updated chart, our adjusted mortgage approvals number is predicting a year on year house price decline of 15% by the end of 2008.
The central banks’ inflationary concerns are preventing interest rates from coming down as fast as they otherwise would do. This, combined with banks’ unwillingness to lend, means that demand for houses continues to wane, and a rebound in house prices is exceptionally unlikely in the foreseeable future. A collapsing housing market will inevitably have a severe knock on effect for the wider economy.


Sign up to the Bond Vigilantes mailing list to ensure you never miss a great article from our expert Bloggers. We will email all new articles to your inbox, meaning you can stay on top of the world of Bonds.
I confirm that I would like to receive information about Bond Vigilantes and products and services from M&G Securities Limited.
We will use the email address and personal data you have shared with us to send you this information. For existing customers, submitting your contact details and requesting to receive this information from us, will replace any earlier choices you have made in respect of marketing information.
You can unsubscribe from marketing at any time, at which point we will not send any further marketing information to you, by selecting the unsubscribe link in all communications.


