
Rolldown
A dispatch from the number crunchers – Yield curve rolldown
By Matthew Russell
15 April 2026

Spreads on Euro denominated ‘Tier 1′ bank bonds hit record wides yesterday, reflecting the growing concern in the market about banks’ ability and willingness to repay investors. ‘Tier 1′ bank bonds are the highest yielding, highest risk bonds in a banks’ capital structure. Essentially, banks issue a spectrum of different ‘tiers’ of debt securities in an attempt to minimise their cost of funding, ranging from senior, which is closest to customer deposits at banks (though they don’t carry the same government guarantees as deposits), to tier 1, which is the type of security that bears the greatest resemblance to equity (ie they can be perpetual, loss absorbing, and interest can be deferred). For this reason, they are the highest risk bank bonds, and so the highest yielding.
There are a number of reasons for the continued underperformance of bank bonds, and particularly of ‘Tier 1’ bonds. First and foremost is the continuing deterioration in the global financial crisis, and the further stress that this is putting on the banking sector. Professor Rogoff, who was the IMF’s chief economist from 2001-04, last week warned that the worst is still to come, going as far as to say “we’re not just going to see mid-sized banks go under in the next few months, we’re going to see a whopper, we’re going to see a big one – one of the big investment banks or big banks”. These kind of comments aren’t particularly helpful for banks – no bank can withstand a run on its assets and banking is built almost purely on confidence – but Professor Rogoff’s view is becoming increasingly widely shared.
Secondly, there is the issue that Stefan alluded to here on Wednesday. Banks need to raise more capital, and the amount will only increase as writedowns increase further. Equity investors, having been stung in recent months, are becoming more reluctant to part with the cash that banks are so desperate for. Banks therefore look set to issue even more in the way of Tier 1 bank paper, and the huge supply that seems set to come to market is causing prices to fall further.
Another problem is what’s known as ‘extension risk’. Tier 1 bank bonds can be called on predetermined dates, and it always used to be assumed that banks would repay investors at the call date for reputational reasons. However, many banks aren’t willing (or perhaps in some cases able) to repay these bonds on the call date at a price dramatically above where these bonds are now trading. These bonds may therefore go from having a maturity of a few years, to being undated, perpetual bonds. Furthermore, if banks do run into further difficulties then it will be Tier 1 investors who bear the losses first. So Tier 1 bank bonds could become perpetual bonds without any coupons – not a very attractive investment.
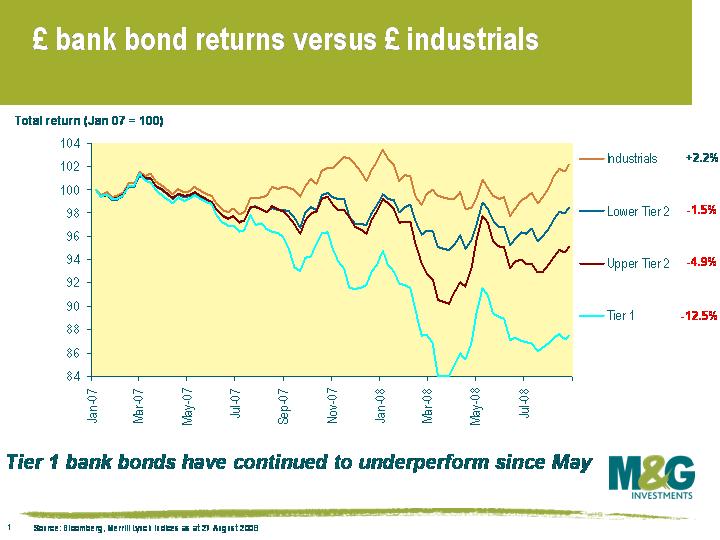
This chart shows the total return of the different tiers of sterling bank bonds since the beginning of 2007. Sterling tier 1 banks have returned -12.5% since the beginning of 2007, versus a return of +2.2% for sterling industrials and a +7.3% return for gilts. Our team’s views on senior bank bonds vary, with Richard the most bearish, but we are united in our belief that the deeply subordinated bank bonds are set to experience more pain.
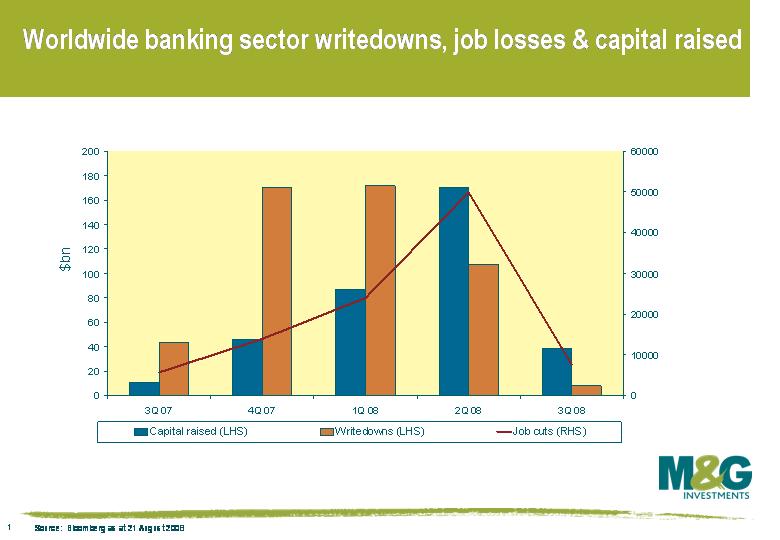
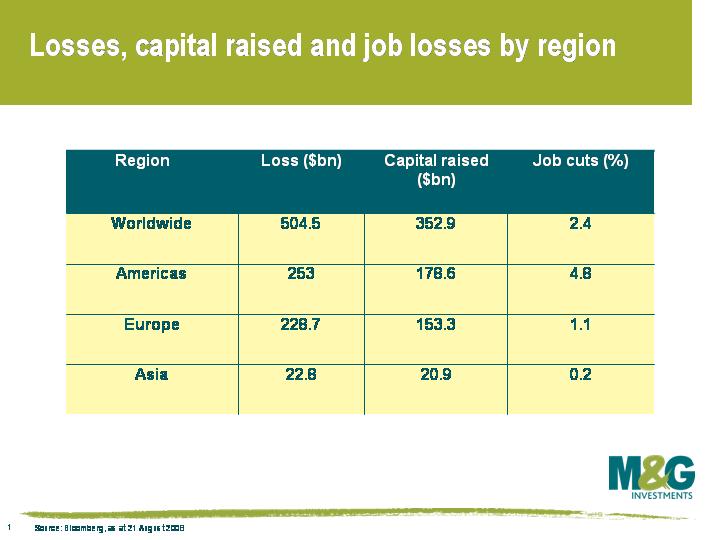
Now that many ‘experts’ have revised their expectations for total bank writedowns significantly upwards, many in excess of one trillion dollars, I thought it may be useful to take a look at those losses that have so far been realised, and how this compares to the amount of capital raised. It’s also interesting to note the correlation with the number of financial market employees that have found themselves out of work as a consequence of these losses.
So far globally, banks have taken approximately half a trillion dollars in writedowns since the summer of 2007 (see table and chart below) and despite their efforts, have only managed to raise about 70% of the capital to replace these losses. At the same time approximately 100,000 workers have lost their jobs as banks have moved to slash costs. As capital becomes ever more scarce, writedowns continue to rise, and the effects of a slowing global economy are realised, the challenge of raising capital to keep pace with losses may well become increasingly acute.
The Freakonomics column of the New York Times has taken its fun approach to economics to produce an analysis of Usain Bolt’s performance in the 200 metres sprint on Wednesday. For anybody who saw it, you won’t be surprised that it was a Black Swan event, way off the Bell Curve in terms of what you might think could be achievable (although Don Bradman’s batting average of 99.94 also puts him in the Black Swan category). There’s some other good Olympic stuff on the website too – including an analysis of the likely ages of the controversial Chinese gymnasts based on population samples.
The newspapers over the past week or so have been full of alleged leaks from the government about fiscal help for the poor British consumer. Ideas floated have included a suspension of stamp duty (although HBOS has pointed out that following the 1991/1992 stamp duty holiday, house prices still fell by 8.3% in that latter year, and transactions fell to their lowest level for 34 years), and a £150 winter fuel bonus for all child benefit recipients. As with the Bush US tax rebates (about $600 per person) earlier this year, the government must hope that a fiscal ease would provide a temporary stimulus to consumption and house prices – although whether propping up property values is a good idea in itself must be open to question even if, unlike in 1991/1992, it were to be successful.
Sadly, whilst I’m all in favour of a bit of Keynesian fiscal stimulus (it eventually proved to be the route out of the Great Depression with the New Deal) the UK cupboard is bare. Tax revenues will have already started to plunge – for example, the huge fall in property transactions will hit stamp duty receipts (worth £6.4 billion per year in 06/07), and lower prices will take those transactions that do take place into lower tax bands. Other hits to the Exchequer will come from lower VAT receipts as retail sales slow, and weaker capital gains tax receipts as asset prices (shares for example) have come well off their highs. Perhaps only VAT on fuel continues to outperform expectations as petrol prices have rallied, although reported significant falls in volumes may mitigate that too (some suggest demand is down 20% from a year ago).
With economic growth slowing significantly, the other side of the equation, spending, is also likely to move in the wrong direction. Jobless claims have started to increase for the first time in nearly 2 years for example. The worrying thing is that the government’s tax and spending estimates are based on growth rate forecasts that look much too high in the current environment, and that certainly don’t discount a recession – around 2% in 2008 and 2.5% in 2009. The IMF estimates that actual growth might be around 1.4% this year, and even lower at 1.1% in 2009. The implication is that the UK will struggle to keep its debt as a percentage of GDP ratio below the magic number of 40%.
Lower tax revenues (is a windfall tax on energy companies the only answer?) and higher spending mean that we will get higher government borrowing, and therefore more gilts. As recently as the period 1999 to 2002 the government was repaying the national debt (remember Prudence?), and the UK’s Net Debt to GDP ratio was at 30.2%. Net gilt issuance this fiscal year will be £63 billion – the largest ever, and Net Debt to GDP will be 38.5%. So far the gilt market has been remarkably sanguine about this (bar a big sell off on the day that it was reported that Alistair Darling might scrap the “Golden Rule” of borrowing only to invest).
But perhaps the gilt market is right to be relatively relaxed – in fact yields have fallen by over 50 bps at 10 years since June, and gilts have outperformed investment grade bonds and high yield so far this quarter. The last time we had a borrowing scare, in 1993-94 as we were coming out of recession, the gilt market had its best ever year despite the highest ever gilt issuance! In the fiscal year 1993-94 net issuance was £47.5 billion (again, a few years earlier there had been talk of repaying the national debt) and Net Debt to GDP went above 40%. Gilts rallied hard, with 10 year gilt yields falling from 8.25% to nearly 6% by the end of 1993. I worked on the gilt trading desk at the Bank of England at the time, and it felt as if we were issuing stock every day, demand was so strong.
Although gilts rallied hard over that period, the shape of the yield curve changed dramatically. In 1992 the curve had been inverted, with 30 year gilts yielding 50 bps less than 10 year gilts. As concerns about supply grew in 1993, the curve normalised sharply and became steeply upward sloping, with 30 year gilts yielding at least 50 basis points more than at 10 years. As borrowing requirements grew, perceived credit risk of HM Government also grew and a risk premium was demanded by the market to lend at long maturities (governments could default on their debts, or, more likely inflate them away which would have been damaging to holders of long dated gilts).
My colleague Matthew Russell has done some good work on the shape of the yield curve compared with the government borrowing. It shows that given the current level of borrowing, rather than the UK having an inverted yield curve (currently 30 year gilts yield 25 bps less than 10 years) we should have a mildly upward sloping one (perhaps 10 bps positive). If borrowing deteriorates to the level that we expect it to, the yield curve should have a positive slope of more than 50 bps. That’s why, despite the ongoing pension fund demand for long dated assets, we would rather take our bullish bond position in the 10 year area of the curve than at the ultra long end of the gilt market which should underperform. For our growing band of American readers, I point you in the direction of some research on the US yield curve which comes to a similarly gloomy conclusion for long dated US bonds, here.
There are some other issues arising from all of this – the most important of which is crowding out. An unrelenting supply of low risk government paper makes it more costly for the corporate sector, with lower credit ratings, to issue debt, thus reducing their profits. Perhaps the best example of crowding out can be seen in the finance pages of your Sunday papers every week. The state-owned Northern Rock is offering interest rates of 6.5% to 7%, with no risk to depositors – this must surely raise the cost of attracting retail deposits for the rest of the struggling UK banking sector. And finally, food for thought – during the long Japanese recession, the world’s second largest economy was downgraded from Aaa to A2 by Moody’s as its borrowing burden reduced its creditworthiness. Could the UK or the US lose their AAA credit ratings?
UK housing market numbers once again fell short today, which is not surprising given the sparsity of credit and falling mortgage approvals (see our most recent blog comment on mortgage approvals here – note that our mortgage approvals chart is now predicting year-on-year house price declines of 20% by January 2009).
Today we are going to focus on the speed of decline. During the last housing market crash in the early 90s, it took over three years for house prices to fall by 10% from their peak. Contrast this to the current crisis – figures released by HBOS today show that UK house prices have fallen by 10.2% in the last six months alone. This is important because the speed and size of this shock should be a determinant of the size and speed of response in the real economy. It would normally also determine the size and speed of the response of the government and monetary authorities, although the government is hamstrung by spending rules, and the monetary authorities are cramped by inflation.
Why is it so much quicker this time? The nature of the last crisis was the over-extended borrower (ie the inability of borrowers to pay their mortgages). The same applies this time, but we also have the over-extended lender. And the pace and magnitude of the decline may be further exaggerated this time by the lack of a safety net for homeowners (we touched on this back in April).
The Olympic motto is Citius, Altius, Fortius, or ‘Swifter, Higher, Stronger’. Sadly for the housing market it should be ……. Swifter, Lower, Weaker.
It’s now been just over a year since the credit crunch began, and there are many indicators of stress out there – equity market falls, credit spreads widening, and collapsing consumer confidence are all things we’ve focused on over the last year.
Unsurprisingly, the main stress has been in the financial sector, the epicentre of this crisis. This is best typified by the fall of Northern Rock, whose downfall we have chronicled in depth on this blog – for more information see Not waving but drowning (Jun 07), Northern Rock not so solid any more (Jul 07), Beware of Falling Rocks (Sep 07), Northern Lights (Oct 07), a Christmas-themed Stable conditions (Dec 07), and most recently Recovery plan doomed? (May 08)
Yesterday the government announced that it was injecting £3 billion of its (our) money to subscribe for shares in Northern Rock. Northern Rock’s market cap peaked at over £5bn at the beginning of 2007, had fallen to £3.6 billion by June last year. By the time its shares were delisted, it had a market cap of £380m. Now it’s apparently worth almost 10 times what it was valued at in February this year. Wow.
Have things really barely deteriorated from the summer of last year? Have we really seen the most dramatic turn around in corporate history in the last six months? Today, Nationwide announced that UK consumer confidence dropped in July by the most since records began in 2004. It is very wishful thinking to hope that the first time buyer will return, the housing market will not fall, the economy is robust – and most of all – that Northern Rock is worth three billion pounds!
It’s not quite what you might expect. On July 15th, it was announced that UK inflation jumped from 3.3% to 3.8% in June, the highest rate since mid 1992. Expectations had been for 3.6%.But over the course of July, gilts returned +2.7%, making it the strongest month since October 2001. At the beginning of July, there were two 0.25% rate hikes fully priced in to the UK bond market. UK base rates are now expected to remain on hold for the next few years.
Why the rally? Some may argue that it was part technical – after all, gilts experienced the biggest sell off in Q2 since 1994. Also a 15% drop in the oil price in the second half of the month will have helped tame rampant inflationary expectations. However the biggest driver seems to have been a wave of poor economic data. Manufacturing and industrial production data was weak, consumer confidence plunged, HBOS said UK house prices fell 2% in June (the third month in four that prices have fallen by 2% or more) while mortgage approvals dived, suggesting that this housing market crash has much further to go. Industrial trends surveys and business surveys were also very weak, and this is important because the Bank of England pays at least as much attention to these surveys as the ‘official’ economic data – see here for an interesting recent speech by deputy governor Charlie Bean (who was incidentally Richard’s personal tutor at LSE many many moons ago).
The Bank of England’s inflation report on August 13th will provide some further clues as to the MPC’s thinking, although it’s not too controversial to predict that the tone will be on inflation risks being to the upside and growth risks to the downside. We agree with the growth risks being on the downside, but as we’ve argued on this blog recently, we think there is a very real risk that inflation will undershoot the Bank of England’s 2% target in 2009-10. See the chart for our inflation view and the market’s current interest rate expectations (note that our inflationary expectations are of course subject to future revisions, depending upon what happens to wages, energy prices etc)


Sign up to the Bond Vigilantes mailing list to ensure you never miss a great article from our expert Bloggers. We will email all new articles to your inbox, meaning you can stay on top of the world of Bonds.
I confirm that I would like to receive information about Bond Vigilantes and products and services from M&G Securities Limited.
We will use the email address and personal data you have shared with us to send you this information. For existing customers, submitting your contact details and requesting to receive this information from us, will replace any earlier choices you have made in respect of marketing information.
You can unsubscribe from marketing at any time, at which point we will not send any further marketing information to you, by selecting the unsubscribe link in all communications.


