
Rolldown
A dispatch from the number crunchers – Yield curve rolldown
By Matthew Russell
15 April 2026

Dubbed by many as an economic equivalent to Al Gore’s “An Inconvenient Truth,” Patrick Creadon’s 81 minute documentary looks at the spiralling US national debt & the huge implications for the world’s largest economy. The thirty minute version (see here) is well worth the time.
This second episode of historian Niall Ferguson’s series on the story of money and finance, The Ascent of Money, is probably worth a look. It’s apparently going to cover the development and importance of bond markets, and although it includes an interview with a minor US bond fund manager rather than one of your friends at M&G, it will be interesting.
Meanwhile it’s time for a quick competition. I’m reading The Great Crash by Selwyn Parker. Whereas Galbraith’s book of nearly the same name (The Great Crash 1929) covers the stock market’s dramatic fall at the start of the Great Depression, Parker takes the story on to the next few years and covers both the policy errors made by the authorities, and the impact on the people who suffered through unemployment and bank failure. In some ways it makes me feel more optimistic about the current economic meltdown, for although we are unlikely to escape a severe downturn, at least the central bankers and governments now “get it”. We’ve now seen an expansion of the money supply and cut rates (money supply contracted aggressively in the 1930s and rates were slow to fall), fiscal stimulus (in the UK they actually put up taxes in 1930), and while in the 1930s banks were almost encouraged to fail, we are now bailing them out, allowing at least a chance for lending to recover. However, we should remember that the US economy did recover a little by 1930, until the Smoot-Hawley Bill was passed, setting up massive protectionist tariffs to keep foreign goods out of America. At this point the global economy went into freefall, and trade almost ground to a halt – the depression deepened again and lasted for 5 more years. Is there a danger that a Democratic US government, wanting to help the automakers for example, makes the same mistakes as Congress and the Senate made in June 1930?
It’s a fascinating book, but Selwyn Parker will sadly suffer the same fate as J K Galbraith, who complained that he missed out on millions of dollars worth of sales of his greatest work as no airport bookshop would stock it.
Anyway – the competition. The prize is a copy of The Great Crash, and it will go to the first person to email me the name of the US Treasury Secretary at the time of the Wall Street Crash – he’s the one who told the President to “liquidate labour, liquidate stocks, liquidate the farmers, liquidate real estate…”.
I’m sure it won’t have escaped most people’s attention that the big American car makers are suffering at the moment – sales by the big three, GM, Ford and Chrysler were down 23% last month. Both GM and Ford announced last week that they have been spending their cash reserves at a hefty pace, and GM has said that it could run out of operating cash as soon as the end of the year.
This has lead some – including Nancy Pelosi, Speaker of the House of Representatives – to call for a government bailout of the troubled firms funded by the TARP. The Troubled Asset Relief Program was designed to buy distressed assets owned by banks, although over time it has evolved and is more likely to make direct investments in bank equity than to buy asset backed securities. Last night the automakers were turned away from Congress having failed to convince Democratic leaders that they’d spend any aid wisely, but they can come back and plead their case again in December.
As pressure mounts for bailouts of honest blue collar industrial heartland businesses (rather than paying for the bonuses of Ferrari driving Gordon Gekkos) what might that mean for the bonds of the auto makers? These are huge bond issuers – together, Ford and GM have a face value of $125 bn bonds outstanding. This chart shows that as bankruptcy fears have developed the (long dated) bonds have plummeted in price to around 20 cents in the dollar. We’ve been bearish on these car producers since 2004, but is there a risk that whilst in a free market these companies would probably go bust in 2009, in today’s Keynesian borrow and spend world, they could survive, and a government equity injection could bail out not only the blue collar car workers but also the white collar owners of Ford and GM bonds?

So what’s the bull case for buying the automakers at 20 cents? Well, even in the event of a default, a typical recovery might be between 25-30% of the bond value, and the long dated bonds are trading below this historical recovery rate. However in this case recoveries might be lower than history suggests as the liabilities held by bond investors are dwarfed by those held by former employees in pension and healthcare benefits (interestingly GM is the worlds biggest private buyer of Viagra).
Another factor to take into account is where any government cash would sit in the capital structure. There hasn’t been much talk about this thus far but clearly the issuance of common equity or preference shares would be much more attractive to bond holders than a senior secured loan as an equity-like injection would sit below the bonds in the capital structure, and would be further down the queue for repayment in the event of further difficulties.
Ford currently have a bond maturing in Feb ’09 trading at around 85 cents in the dollar which, if they secure government funding, one would assume to be money good. As I said, the team has been bearish on autos for five years but with the bonds trading at these levels, and with continued political pressure on Bush/Obama to do something for the “real” economy they might be looking interesting.
Yesterday it was announced that UK CPI inflation for the month of October was minus 0.2%. The annualised rate of inflation dropped from +5.2% to +4.5%, the biggest year on year drop in UK CPI since April 1992. Inflation expectations have plummeted. The 5 year breakeven inflation rate, i.e. the rate of inflation priced in by the UK index-linked bond market, is now -0.1%. In other words, the UK bond market is saying that RPI inflation (which is the inflation measure that the linker market prices off) is going to average -0.1% per year for the next five years. UK RPI inflation has historically been about 1% higher than UK CPI inflation over the past two decades, although this is likely to change over the next couple of years as the housing cost portion of RPI (which isn’t in CPI) falls. Anyway, you get the picture – deflation is now a very serious risk. And that’s fantastic for good quality bonds, because you’re locking into a fixed rate of interest which could soon be extremely attractive.
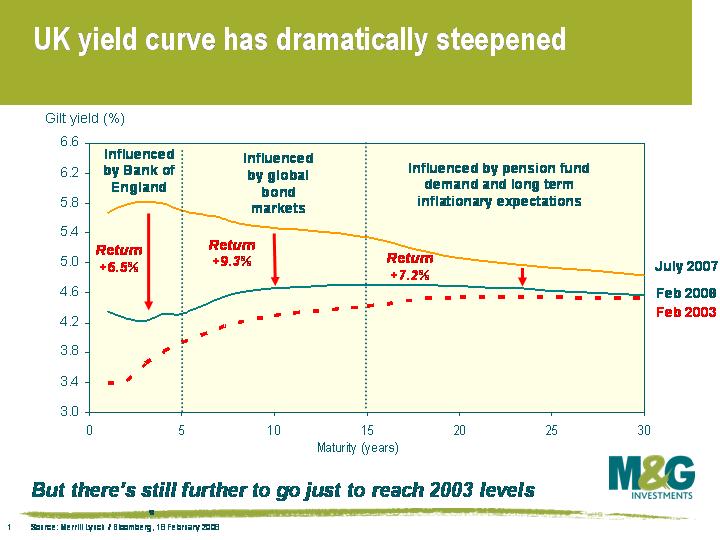
Gilts have already enjoyed a strong rally, but how much further has it got to go? I thought it would be worth updating a comment I posted in February (see here). In February, the gilt market had already rallied hard from the previous summer due to the dramatic lowering of interest rate expectations. I argued that there was still further to go just to get to where the yield curve was in 2003 (bear in mind that the UK economy of 2003 was in a much better shape than the UK economy of November 2008). This chart shows where the UK yield curve was in February 2003 and February 2008 relative to where the UK yield curve is today. The front end of the gilt market has sailed through the lows set in 2003, and 5 year gilt yields have today hit another record low (the sixth day in a row that’s been the case, in fact).
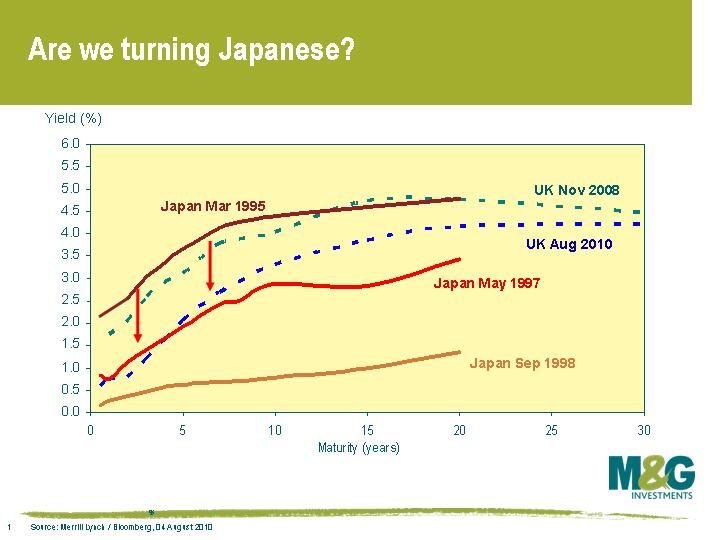
It’s time to alter our sights since we’re now through the UK’s 2003 levels – what kind of returns could we be looking at if we go into the ‘Japan’ scenario? Well this chart shows what happened to Japanese government bonds (JGBs) from March 1995 to September 1998, and it’s pretty spectacular. As you can see, the Japanese yield curve of March 1995 looked very similar to the UK yield curve today. JGBs had already had a boom in the first half of the decade, but this continued in earnest from March 1995.
So if the UK (or indeed the whole world) goes into the ‘Japan scenario’, you can expect some terrific returns from good quality bonds. What’s the likelihood of that happening? There are strong arguments that it won’t get that bad. Lessons have been learnt – banks are being saved, and with a few notable exceptions, they’re coming clean with what’s hidden away on their balance sheets. Monetary stimulus and fiscal stimulus were slower to be implemented in Japan. Our economy is (probably) more responsive to monetary stimulus. Japan’s fiscal stimulus wasn’t very effective. Japan’s real estate and stock market bubbles were arguably worse than we’ve experienced. On a trade weighted basis, the Yen was no weaker in 1998 than it was in 1992.
However, there are some arguments that it could even be worse too. Japan struggled through the 1990s at a time when the rest of the world was booming, but the whole world is in trouble this time around. And the Japanese have always had a very high savings rate which enabled the standard of living to remain high through the troubles, while the same certainly can’t be said for the western world today, where many consumers are already technically insolvent. If we do get a bout of deflation, which increases the real value of debt, the effect on the UK consumer will be far greater than the effect on the Japanese consumer.
On balance, while recession is unlikely to last for as long as in Japan, and deflation is unlikely to become so entrenched, every day seems to be bringing us closer to a Japan scenario (for example, while I was typing this sentence it was announced that US CPI fell by a record 1% in October, the biggest monthly drop since records began in 1947). If you believe that there is a sizeable risk of at least a ‘semi’ Japan scenario, which we do, then gilts, other sovereign bonds, and good quality corporate bonds could rally much, much further.
PS If you haven’t heard the song for a while, click here!
Is it? Well kind of. Credit spreads (ie the excess yields on corporate bonds over government bonds) are very closely correlated to the strength of the underlying economy – when times are good, investors demand a small risk premium, and when things turn nasty, investors demand a much bigger risk premium. Right now, credit spreads are at almost unprecedented levels – see the chart in Richard’s recent comment here.
To understand why, you need to understand what’s driving credit spreads. If you want to try to quantify it, you can think of it like this (please bear with me a second, I promise it’s actually very intuitive):
Credit spread = (risk premium for default – recovery)+ risk premium for other factors
Firstly the risk premium for defaults. When you’re a long term investor and you buy a corporate bond, the most important thing is that the credit spread compensates you for default, which is the potential loss of coupon payments and principal. In working out what default rate is priced into the market, you have to make a load of assumptions – as well as the potential for default, you have to consider the uncertainty around the timing of default, the level of recovery in the event of default, and how long it might take to see any of the recovery value.
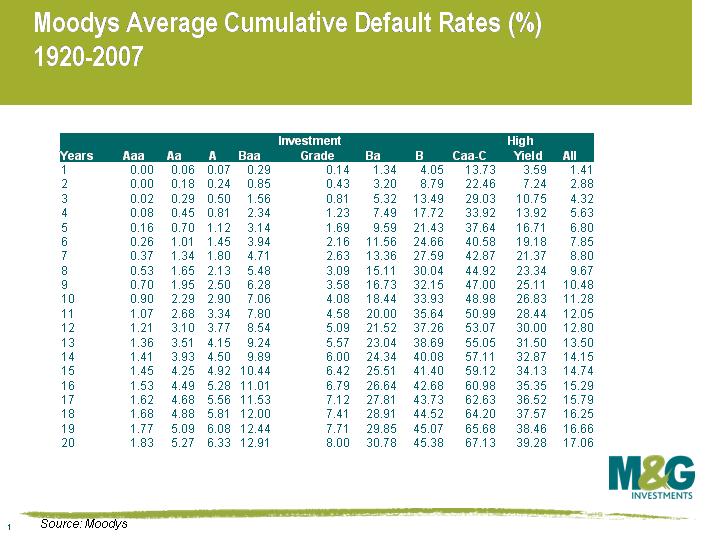 Deutsche Bank have had a go at quantifying the implied default rate. Their research suggests that current spreads are significantly overcompensating for default risks. Taking historical data compiled by Moody’s between 1920-2007 as the graph on the left shows, and assuming average recoveries, European investment grade bonds are implying 35% cumulative defaults over the next five years and European high yield 67%; way above levels experienced over any five year period since 1970, which is a period capturing a number of recessions. The previous highs were 2.4% and 31.1% respectively. In fact, even assuming an extremely improbable recovery rate of zero, current spreads are still pricing in 21% for investment grade and 48% for high yield, again way above anything previously experienced, see here.
Clearly the ‘other factors’ bit of the equation above is playing a huge part. I blame the effect that deleveraging is having on the technical side. As banks remove liquidity and delever, hedge funds, SIVs, conduits and other special purpose vehicles (SPVs) are dumping assets on the market. A lot of these assets are fundamentally fine – what we’re seeing is distressed sellers of non-distressed assets. Supply significantly exceeds demand, and prices are being forced lower.
When the number of sellers significantly outweighs buyers, prices are forced to adjust to a level where new or extra capital is attracted. In terms of bonds, this extra capital may be pension funds changing asset allocation, it may be the money you’ve been saving up in your high street bank, or it may even come from bond issuers themselves (they can take advantage of debt market mispricing by simply issuing equity or using cash on balance sheet and buying buy back debt , which is earnings enhancing).
So technicals are responsible for this extra risk premium and a lot of the volatility we’re seeing. Such an environment creates fantastic opportunities for those interested in fundamental value – those long term investors with committed capital willing to endure some short term volatility.
We talked about the possibility of Japanese-style zero interest rate policy (ZIRP) heading to the western economies in a recent blog. Today we had an unexpectedly large rate cut from the Bank of England, with the policy rate hitting 3%, its lowest level since 1955, when Winston Churchill was Prime Minister. In this link to a 3 minute video I recorded this afternoon you can look into my wild, staring eyes and hear me discuss the Bank’s decision and the outlook for bond markets into 2009.
Click here to watch (This video is no longer available)


Sign up to the Bond Vigilantes mailing list to ensure you never miss a great article from our expert Bloggers. We will email all new articles to your inbox, meaning you can stay on top of the world of Bonds.
I confirm that I would like to receive information about Bond Vigilantes and products and services from M&G Securities Limited.
We will use the email address and personal data you have shared with us to send you this information. For existing customers, submitting your contact details and requesting to receive this information from us, will replace any earlier choices you have made in respect of marketing information.
You can unsubscribe from marketing at any time, at which point we will not send any further marketing information to you, by selecting the unsubscribe link in all communications.


