
Rolldown
A dispatch from the number crunchers – Yield curve rolldown
By Matthew Russell
15 April 2026

After narrowly avoiding defeat in Cardiff, England won the second Ashes test at Lord’s and is heading into the Edgbaston test match with a 1-0 lead. For those of you not familiar with cricket and this contest, see here. As the sole Australian and new member on the team I expected a bit of ribbing from my fellow Bond Vigilantes. But not this much. So rather than debate the possible outcome of the Ashes series, I thought it might be interesting to assess the Australian and UK economies and how they have performed over this very interesting period in financial history.
As a bit of a background, Australia is currently the world’s 19th largest economy by purchasing power parity GDP, with a size of $825 billion in 2008. Following a recession in the 1980s, Australia has enjoyed 17 years of expansion, aided by growing demand for commodities and robust government policies.
Despite the large shock (equivalent in cricketing terms to losing McGrath, Gilchrist and Warne) that the financial crisis has caused to the economy, Australia is only one of three OECD countries to have avoided recession so far (the others being Poland and Luxembourg). The Reserve Bank of Australia and the Government were quick to act once it became apparent that the global economy was in some serious trouble. The RBA cut interest rates from 7.25% to 3.00% in the space of just 8 months, helping highly levered consumers and businesses. The Government aggressively swung the fiscal surplus – the result of soaring tax revenues from mining companies and record low unemployment levels – into deficit by announcing large infrastructure projects and $900 handouts to Australian taxpayers.
During 2008/2009 the Australian cricket team performed above expectations, winning two series out of three. Not a bad result considering the loss of key players. The Australian economy performed equally well. Growth has been supported by strong demand for Australian exports, particularly commodities, and like many other developed economies the business sector has responded by cutting expenditures, reducing debt levels and raising new equity. The unemployment rate has been rising but remains low at 5.8%, versus 7.6% in the UK (and considerably lower than some other developed economies – see previous comment here). House prices have fallen, but by less than 7% versus about 20% for the UK.
The past year has been simply terrible for the UK. Not only did England lose two test cricket series to India and the West Indies in 2008 (and one win in 2009), but the UK economy has now declined by the largest year on year amount since the ONS started recording GDP statistics in 1948. For a history of what has happened in the UK economy there is no better place to get up to speed than by reading the archive material on this very blog.
It is now clear that the ‘NICE’ (non-inflationary, consistently expanding) decade is behind the UK and considerable challenges face the economy. We have written about the measures undertaken by the Bank of England and the UK government to support its financial sector in the midst of the crisis and the coming wave of gilt issuance that will be required to finance government guarantees. Additionally, markets are concerned about the impact that the end of quantitative easing is going to have on the economy.
Looking at bond markets, the Australian government is rated AAA by S&P. Australian 5 year credit default swaps (CDS) are currently trading at 45bps. Australia has relatively high interest rates and an excellent credit rating. It should have no problems raising debt to finance budget deficits, should it need to do so.
The UK by comparison has been placed on negative rating watch by S&P as discussed here. The UK government may still be able to issue debt but will there be a point where markets think enough is enough? UK CDS are currently trading at 60bps. This implies that the market thinks that the UK has more chance of defaulting on its bonds than Australia does. To put this in perspective, Germany is trading at 29, Portugal at 57 and Ireland at 157. It should be noted that this measure of implied risk of default has fallen across all these countries as investors have become more optimistic on the global economy, meaning that there is a view that these countries are now less likely to default.
So like cricket, the case for one economy or one team is not so clear cut. England’s star batsman, Kevin Pietersen, is out for the rest of the series. QE looks to be ending in the UK, pushing up gilt yields. Australian captain Ricky Ponting had a shocker in the second test at Lords and needs to bounce back. The Australian Prime Minister, Kevin Rudd, has written to Australians saying they should brace themselves for rising interest rates, higher unemployment and budget cuts.
It’s going to be an interesting summer of cricket.
Mr Bean doesn’t say much publicly, so the bond market spent last week pouncing on every utterance of his UK tour (usually without much regard for the context in which things were said) in an effort to answer the key question of whether or not the Bank of England would continue its program of Quantitative Easing.
Yesterday morning we got a few more clues after the minutes of the last Monetary Policy Committee meeting were released. As could be seen from the gilt market’s reaction (10 year gilt yields at one point almost reached 3.9%, the highest for a month), the interpretation wasn’t too gilt-friendly. Some of the key messages in the MPC minutes were that although monetary data is not providing a precise guide to the success of QE, broad money growth has picked up sharply. Inflation has been surprisingly high over a number of months. Labour markets are weak and wage growth is expected to weaken further, but employment had come in higher and unemployment lower than expected. The more forward-looking surveys suggest growth and inflation (in the short term) may be higher than previously expected. So possibly it is actually the beginning of the end of QE, rather than the end of the beginning.
Another important point in the minutes was the reminder that “one risk to the economic recovery in the US and possibly the world was the US housing market”. That’s because house prices affect people’s collateral, thus affecting their ability to borrow. House prices affect banks’ assets (and therefore also affect the banks’ ability to lend), And house prices affect the amount of residential investment.
We’ve recognised the importance of the US housing market, and have written extensively about the health of the market on this blog. It was the fall in US house prices that began in the second half of 2006 that sparked the chain reaction leading to this financial crisis. Presumably, it will be a recovery in house prices that will help to bring us out of this financial crisis (and we’re definitely still in one, as CIT’s woes demonstrate).
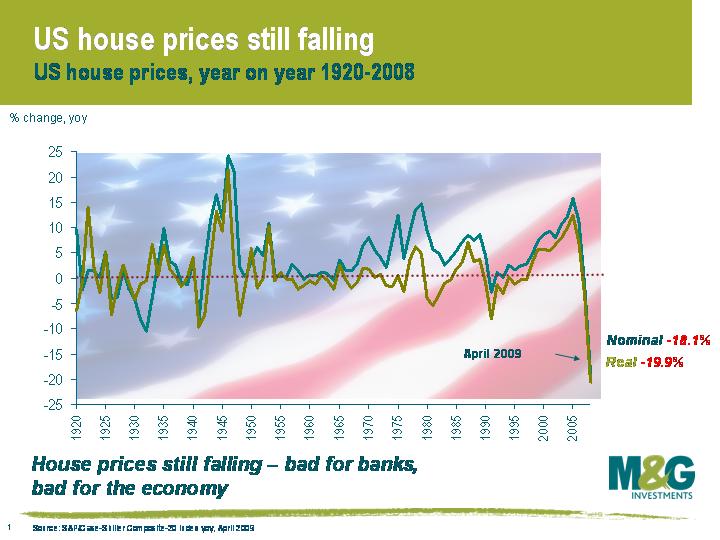
US house prices are sharply lower than a year ago, as this chart shows. According to the S&P/Case-Shiller indices, house prices fell 18.1% in the year to April (May’s numbers come out next week), albeit the pace of decline seems to be slowing, with April 2009 seeing the smallest fall since June 2008. House price data from two other sources, the National Association of Realtors and the Federal Housing Finance Agency, had US house prices rising in May.
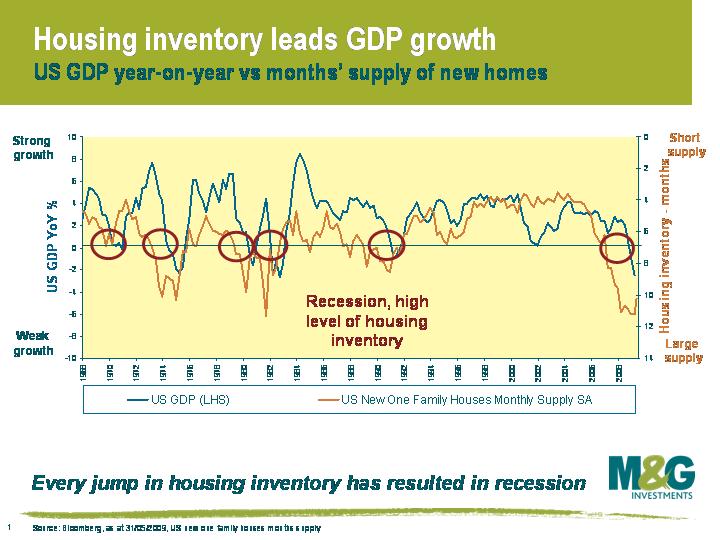
However it’s difficult to see a sustained rise in US house prices, or indeed a buoyant economy, until the overhang of unsold stock on the housing market (or ‘inventory’) begins to clear. A good measure of the inventory overhang is ‘months supply’ , which says how long it will take to clear the supply overhang at the current level of demand. The measure is a good predictor of US recessions (see blog from Feb 2008 here) and isn’t a bad predictor of growth either. Inventory levels have improved in recent months, but at 10.2 months supply, there is still a significant inventory overhang. This has much to do with delinquencies (now 25% for subprime, or 9.1% in total, which is the highest since records began in 1979), unemployment (already highest since 1983 and still rising) and rising repossessions. History suggests that months supply will need to fall to about 7 months supply before we see a sustained recovery in both the economy and the housing market.
The day after Richard’s ‘walking on custard‘ blog last week, the BoE announced that it was going to have a break from its QE program, at least until its quarterly Inflation Report comes out next month. The BoE had previously committed to buy back £125bn of gilts, £25bn short of the £150bn that the government had permitted. Market expectations had been for the BoE to announce that it would buy back the additional £25bn and provide some sort of guidance for how many more gilts it would buy over the remainder of this year.
Markets interpreted the lack of guidance as a possible first move towards a QE exit strategy. Suddenly, investors started thinking that not only is the QE support for the gilt market potentially being withdrawn, but the BoE might start selling back its £125bn of gilts to the market at some point in the not too distant future – and that’s on top of the £200bn+ that’s going to be issued in the next 18 months regardless of what the BoE does. Gilts puked a bit on Thursday, with 10 year gilt yields jumping by 0.17%, making it the ninth biggest intraday selloff of the past decade.
Then, on Friday, we had the announcement of the Charlie Bean Tour. The Deputy Governor has jumped in his battle bus and will spend this week gigging at 14 cities around the UK, armed with this pamphlet. We’re wondering why the Deputy Governor would take a week out of his busy schedule to explain to the masses how QE works just as QE finishes. So maybe it isn’t going to finish.
The market seems to have reached a similar conclusion, with 10 year gilts having recovered about half of the ground lost on Thursday . We’re probably not going to get many more clues until the minutes of last Thursday’s MPC meeting are released next Wednesday, but either way, while it’s possible that we have seen the end of QE, it feels more likely to be just the end of the beginning (and in fact, Charlie Bean has just said on his Leeds leg that policy makers were wary of ending their asset program “too early” since that posed the risk they may “nip the recovery in the bud”).
Two things from the pamphlet – firstly there is explicit talk of QE as a means of lowering government and corporate bond yields to get borrowing rates down for the economy (previously the focus was on the pure inflationary impact of pushing pound notes into UK plc), and secondly the diagram on page 12 couldn’t look more like a helicopter dropping banknotes over the nation if it tried.
The US bond market expects the Fed to start raising rates again at the start of 2010, if not earlier. The bond market is usually right, but maybe not this time. A speech last week by influential San Francisco Fed President Janet Yellen (seen as a possible candidate for Bernanke’s job, should he not get reappointed next year) suggested that keeping Fed funds rate at zero for several years is “not outside the realm of possibility”, and also talked about the problem of not being able to cut interest rates below zero (“if we were not at zero, we would be lowering the funds rate”). The risks involved in returning to “normal” too quickly were echoed in a guest article in the Economist by one of President Obama’s economic advisers, Christina Romer. Called The Lessons of 1937, it warned that the withdrawal of monetary and fiscal stimulus just as the Great Depression appeared to be coming to an end led to a second, severe downturn.
Historically, bond markets don’t enter a bear market until the Fed starts hiking (see charts), and the Fed doesn’t start hiking until unemployment is falling. Of course explosive government borrowing and massive bond issuance are factors which haven’t been present to this degree in the episodes we show, and we must accept that revulsion from the sheer quantity of bond issuance might trigger a bond bear market even if inflation and rates are low – but neither have we ever seen western governments doing quantitative easing and buying back their own debt.
One of the most widely read economics speeches in history is Bernanke’s Deflation: Making Sure “It” Doesn’t Happen Here of November 2002. I remember seeing a well connected economist around the time that it came out, when the Fed was petrified that core CPI was heading towards just 1%. The economist claimed that the Fed was discussing various “helicopter drop” type scenarios to inject liquidity into the consumer sector, to try to avoid becoming Japan. One of these ideas was that the Fed would drive armoured cars full of dollar bills into football stadia around America, and buy secondhand cars directly from anyone who wanted to sell them one. I told this as an aside to a client yesterday, as an illustration as to what the authorities might do in extremis – before suddenly realising that we are already there. Click here if you want to sell your secondhand car to the government. We must understand that we are now in extremis.
Two deflation anecdotes. Unprompted, I’ve had two drivers from a major corporate cab provider tell me that they wished that head office would cut the rates that they get paid to help reverse a huge collapse in demand, and a friend who’s a personal trainer for a national gym chain said the same – his charge out rates are much too high, and he’d rather take a pay cut and get a bit more work. The latest June employment data show that there is now zero wage growth in the US economy – perhaps unsurprisingly in an economy that has lost 6.5 million jobs since the start of this recession. Perhaps the scariest chart I have for you today shows you capacity utilisation rates in the US, EU and UK. All are now at record lows, and still falling. With a third of US capacity currently unused, the scope for further radical restructuring and job cuts must remain high.
And finally, and completely unrelated to bond markets, but combining three of my favourite things – Manchester, Kraftwerk, and cycling – I give you a video of Kraftwerk playing Tour de France at the Manchester Velodrome last week, complete with surprise appearance on the circuit by Team GB at around 4 1/2 minutes in. Altogether now – “En danseuse jusqu’au sommet/Pedaler en grand braquet/Sprint final a l’arrivee”. And “chapeau!” to Mark Cavendish.
Economic theory is simple – increase the supply of something, and its price should fall. Therefore to increase inflation, reduce the value of money by simply printing it. If this excess money is spent on a limited supply of goods and services, then inflation should pick up strongly. However if the cash is not used,and instead sits in bank vaults or safe deposit boxes, then the inflationary impact should be negligible.
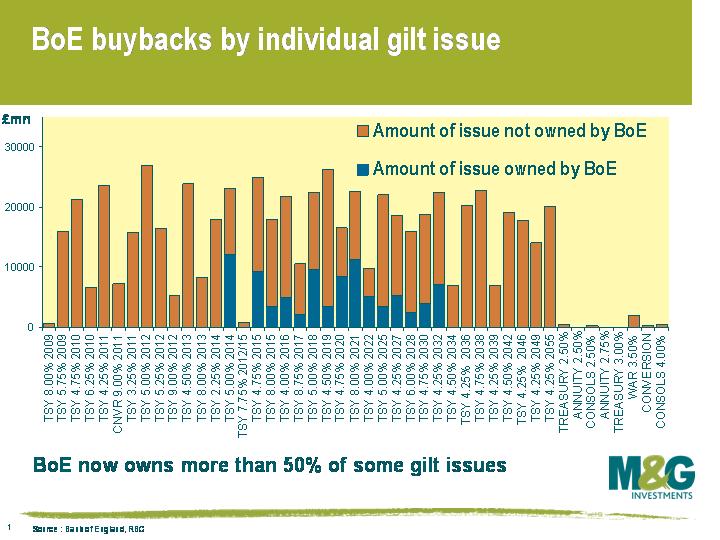
The Bank of England was initially granted permission to buy £150 billion worth of gilts. So far they have made strong progress and have bought a total of £107 billion in the last three months. In order to put that in context, £107bn equates to over 15 percent of the gilt market, a quite extraordinary number. In some individual gilts they own over 50% of the issue (see attached chart). This has the effect at least in the short term of moving gilt prices higher and yields lower, relative to where they would otherwise be.
The scale and pattern of these purchases has important implications for bond investors. As part of its operations, the BoE has been excluding short dated gilts (generally owned by overseas central banks) and ultra long gilts (generally owned by pension funds). The propensity of overseas central banks to recirculate cash into spending is low, while pension funds are facing a funding crisis that would be damaged further by long yields falling since this increases the present value of their liabilities. This focus of the BoE’s programme has therefore been on the middle of the curve. Gilts that have been included in the buyback basket have, for obvious reasons, traded expensively compared to ineligible gilts, distorting individual issues and the gilt curve.
This experiment is coming to the end of its first phase. £150 billion was originally approved, of which the Bank has said it would do an initial £125 billion. In tomorrow’s monthly monetary policy meeting, Monetary Policy Committee (MPC) members will be discussing the effectiveness of the policy so far, including whether to use their last £25 billion. It’s widely expected that they will do so – but more interesting will be the issue of whether they will ask permission from the Treasury to do more than the originally permitted £150 billion, and continue the experiment with unconventional policy.
Has the QE experiment worked so far? Sadly for the MPC, the effectiveness of quantitative easing is hard to measure, especially given the dramatically altering financial background. Presumably QE on this scale is a new intellectual challenge for the authorities. The aim of the policy is to use unconventional measures to hit the 2% inflation target in 2 years time, and presumably it is one that works with a lag, just like traditional interest rate driven monetary policy. We always say that traditional monetary policy takes about nine months to hit the real economy – if QE is similar (and who knows whether it is or not) then we wouldn’t expect to see any impact until December this year.
Does the committee continue with the unconventional policy measures until they work, or do they think the policy of QE isn’t having much effect? The crux of the problem they face, is that – in theory – providing liquidity should be inflationary, but the whole point of experiments is to see if theory works in reality. Liquidity has been added, but the effect might not be as expected. Liquidity in these conditions might not behave as you would expect. Is the value of money going to sink in a pool of excess liquidity or is it walking on custard?


Sign up to the Bond Vigilantes mailing list to ensure you never miss a great article from our expert Bloggers. We will email all new articles to your inbox, meaning you can stay on top of the world of Bonds.
I confirm that I would like to receive information about Bond Vigilantes and products and services from M&G Securities Limited.
We will use the email address and personal data you have shared with us to send you this information. For existing customers, submitting your contact details and requesting to receive this information from us, will replace any earlier choices you have made in respect of marketing information.
You can unsubscribe from marketing at any time, at which point we will not send any further marketing information to you, by selecting the unsubscribe link in all communications.


