
Rolldown
A dispatch from the number crunchers – Yield curve rolldown
By Matthew Russell
15 April 2026

In all financial and commodity markets the big figure (the first part of the price) is referred to as the handle. This allows verbally quicker and more accurate trading (see this classic Two Ronnies sketch) as the handle does not need to be mentioned in every transaction. In the bond markets the handle from a yield perspective is the first big figure, so when the yield on a security is 4.5%, the handle would be 4. The ongoing bull market in the UK means there are currently no conventional gilts outstanding with a yield greater than, and therefore with a handle of, 4.
Like the stock market’s focus on the Dow 10,000 level, bond investors also focus on significant round number levels. The psychology of hitting new lows in yields takes time for the market to get its head round, while the financial implications for issuers and investors can be enormous. The loss of the 4 handle in long dated conventional UK bonds has been replicated by the loss of the 4 , 3, and 2 handles of long dated US, German, and Japanese government bonds respectively over the last three months.
The implications of these new low yields is substantial. For an investor such as a pension fund that is short longer dated liabilities, the funding gap increases, putting it under pressure to buy more bonds at a lower yield and higher price due to the mismatch of assets and liabilities. While for issuers like the government it means they are better able to service their debt, and will need to issue less to meet their funding needs. Thus the psychology of the shift below 4 percent is compounded in favour of bulls versus bears by the realities of market positioning.
Dear Bond Vigilantes,
The small nation of Ireland has received more than its fair share of press since the credit crunch started three years ago. The financial crisis has not been kind to the Irish economy, with the collapse of the Irish property bubble having a profound impact on citizen’s net wealth and psyche. In fact, Ireland was the first country in the EU to officially enter recession. As recently as this week, Standard & Poor’s downgraded Ireland’s credit rating to AA-, its lowest since 1995. The “Celtic Tiger” was shot and wounded when Lehman Brothers collapsed.
I had previously worked in Dublin from 2007 until mid 2009 and saw the effects first hand that the recession was having. Union strikes, vacant shop fronts and alarming headlines in the newspapers were becoming an all too regular occurrence. On one occasion, an estimated 500 people queued for 15 jobs at Londis, a convenience store chain. The line of people stretched from St. Stephen’s Green to halfway down Grafton Street. Things were truly dire, and an air of uncertainty was a constant presence in conversations with colleagues, friends and family.
With these memories fresh in my mind I headed back to Ireland with my brother and old man, with a view of sampling some of the Guinness and scenery. But first a bit of background.
The problems with the Irish economy are well known. So are the measures the Irish authorities have undertaken to consolidate the governments’ finances. Sizeable cuts to public sector pay and social welfare payments have helped to restore confidence amongst the global policy community and international financial markets. After a severe decline in growth in 2008 and 2009, the Irish economy has stabilised in 2010 and is now growing again.
But the path from crisis to stability and recovery is likely to be narrow and rocky. Ireland will likely rely on exports and tourism to lead the economic recovery. As Ireland is part of the European Economic and Monetary Union (EMU), they cannot rely on a depreciation of the euro in order to become internationally competitive. The Irish need to become more productive and have to reduce wage costs. Irish banks remain a source of uncertainty with higher than expected losses, uncertainties in global regulatory trends, and limited access to funding hurting the Irish financial system.
As we travelled around Ireland, speaking to the locals, drinking with the locals, having the craic with the locals, the state of the economy would often come up. In these chats, a few themes kept re-occurring. These themes were unemployment, emigration, house prices, and the banks.
The unemployment rate in Ireland deteriorated from 4.5% in 2007 to 13.0% in 2010. This large increase in unemployment reflects significant structural changes in the Irish economy. Unsurprisingly, the construction sector was a huge employer of people in Ireland and with the house price crash it is unlikely that these jobs will come back. Looking at the unemployment data in Ireland, it is a concern that labour participation has fallen among older males as they may find it increasingly difficult to find work in the future as the economy recovers. Persistent unemployment is going to be a huge challenge for the Irish authorities.
For the first time in many years, Ireland is experiencing net outward migration. In this downturn, immigrants from Central and Eastern Europe have left Ireland in droves, whilst the Irish themselves have emigrated to places like Australia, Canada and the UK. Without emigration, the IMF estimates that the unemployment rate could have been as much as 2 percentage points higher. The concern is that Ireland is experiencing a “brain-drain” (present company excluded), and the Irish education system is effectively exporting a highly skilled and educated workforce (one that will pay taxes in their new place of residence).
Driving through the towns of Ireland we often encountered huge estates of houses that had been completed to varying degrees. These have been named “ghost estates” by the Irish. House prices shot up in Ireland during the boom years but were also accompanied by a construction boom, leading to a rapid increase in the supply of available housing (as seen in the accompanying chart), new shopping centres, business parks, and hotel developments. The dependence on the property market as a key driver of the economy and a vital source of tax revenue during the “Celtic Tiger” years has left the country with a set of serious problems that may take a generation or more to resolve. Certainly banks have tightened lending for new construction projects markedly, and it appears that there is little need for any new houses to be built in the immediate future. Some commentators have gone so far as to say the ghost estates need to be knocked down.

The National Asset Management Agency (NAMA) was a constant source of topic on the radio and in the Irish newspapers. The Irish government set up NAMA to transfer distressed property developments from the books of banks into a “bad bank”. By February 2011, NAMA will hold €81 billion of toxic debt which is roughly equal to 50% of Ireland’s GDP. The Irish have not bought into the idea of NAMA, with many suggesting that the losses incurred by the “cowboys” at the banks should not be offloaded onto the Irish taxpayer. Pure and simple NAMA is an experiment and only time will tell whether it was the right thing to do.
On the austerity measures that Ireland have introduced, I think a quote from The Daily Telegraph’s Ambrose Evans-Pritchard sums up the views of the Irish pretty well:
“Dublin has played by the book. It has taken pre-emptive steps to please the markets and the EU. It has done an IMF job without the IMF. Indeed, is has gone further than the IMF would have dared to go. It has imposed draconian austerity measures. The solidarity of the country has been remarkable. There have been no riots, and no terrorist threats. Yet as of today it is paying 5.48% to borrow for ten years, or near 8% in real terms once deflation is factored in. This is crippling and puts the country on an unsustainable debt trajectory if it lasts for long. Yet Greece is able to borrow from the EU at 5% and from the IMF at a staggered rate far below.”
It is particularly interesting if we think about the austerity measures that Ireland have had to implement and then try to determine what the possible impact that budget tightening might be on the UK and a major European country like Spain. Through assertive steps to tackle the budget problems head-on, Irish policymakers have gained significant credibility. But that is not enough. Retaining credibility will require strong commitment and active risk management. The markets view ambitious fiscal consolidation plans in Ireland, Spain and the UK as appropriate and these plans will demand years of tight budgetary control. If new governments are elected, will they continue to retain a tight control of government spending in the face of rising public discontent?
The return to a self-sustaining economic recovery, with lower levels of government expenditure, is going to take time in the respective economies. In the interim, unforeseen fiscal demands may occur and policymakers have limited bullets left in the fiscal gun. With limited fiscal resources, maintaining a steady policy course will be required to minimise risks and sustain market confidence. We saw that the market retained some confidence in Ireland during the Greek sovereign crisis in May, when CDS for other European peripheral nations widened relative to Ireland CDS.
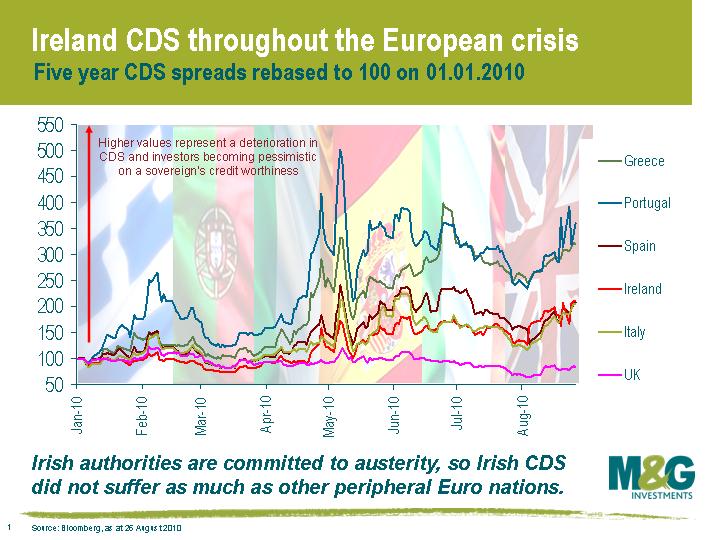
More recently, CDS for European nations has been widening due to concerns about the ability of sovereigns to issue debt and a slowdown in the global economic recovery. CDS for the UK has been stable and confirms the market’s view that the UK is relatively risk free.
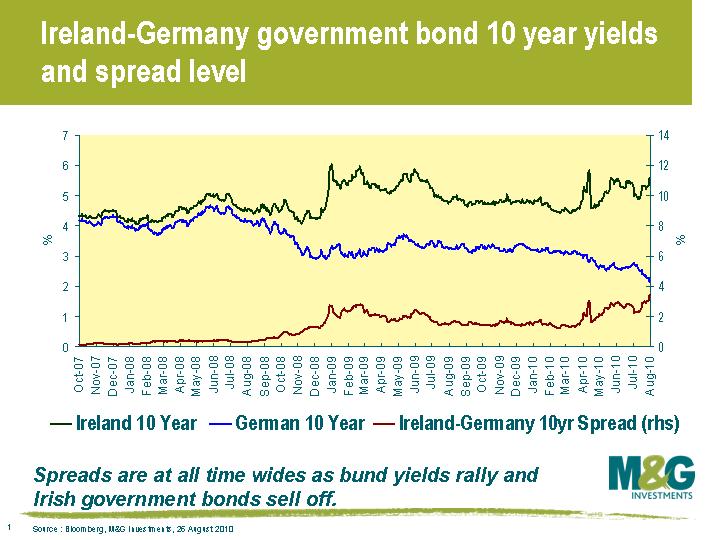
The Irish have a tough task on their hands, no doubt about it. The restaurants and pubs are quieter than they used to be and the price of a pint of Guinness has come down a little (around €3.80 on average at the pubs I visited). In many ways, the Irish authorities have done everything that was required of them and this is pleasing some market participants. Mike Riddell bought some Irish 10 year government bonds on Wednesday after Ireland was downgraded, reflecting his view that the authorities remain committed to austerity and that the bonds are attractive at these valuations. Irish 10 year government bonds are currently yielding 5.60% compared to 2.16% for German 10 year bunds. The spread of Irish government bonds to German bunds is currently 3.44% which is a record level, so investors that are willing to take more risk are being compensated well to do so. Interestingly, the ECB waded into the market and bought some Irish 10 year bonds as well on Wednesday.
There is also a lesson in Ireland’s experience for emerging market nations, particularly in Central and Eastern Europe. In the 1980s Ireland was a relatively poor, peripheral nation on the edge of Europe with a weak economy. Foreign direct investment was mainly in low-skilled, branch plant manufacturing. The 1990s saw Ireland transform to high-skilled manufacturing and the development of a domestic consumer society. By 2003, the OECD estimated that Ireland had the 4th highest GDP per capita in the world on purchasing power parity basis. Unit labour costs shot through the roof during this period, reducing Ireland’s competitiveness in export markets and leading to inflation that was usually above the EMU average. The departure of Dell, a large manufacturing employer, from Limerick to Poland was a signal that Ireland had lost its edge in low-end manufacturing. It is important governments and policymakers in emerging nations learn from Ireland’s mistakes.
Ireland will push through this crisis, but there are going to be some bumps along the way. And apart from analysing the state of the Irish economy in this letter, I’m also going to let you know what are “must-do’s” if you visit Ireland. Stay in a fishing village called Kinsale in County Cork. The Dingle Peninsula, Ring of Kerry and Aran Islands were also highlights on my week long journey. Have a few Guinness. Don’t have 10.

See you all soon,
Doyley
Travelling back from Sunday’s draw between Liverpool & Arsenal (it was never a sending off), I noted Liverpool Football Club had again made the business pages for all of the wrong reasons (see here).
The current battle between RBS, the principal creditor to LFC, and its owners Tom Hicks and George Gillett continues to highlight the dangers of utilising leverage to buyout companies in certain industries.
LFC was bought by the American pair for £219 million in 2007, including debt. Back in April of this year, and unable to re-finance the current £237 million of bank debt, Hicks & Gillett effectively defaulted and ceded management control to an independent Martin Broughton, as a condition of that re-financing. According to the Sunday press, a six month re-financing comes due on October 6th, along with a £60m penalty, at which point it is alleged RBS would take control of the club. No doubt potential suitors are well aware of the impending date and are biding their time, hoping to buy the club for the value of its debt alone. The most likely outcome, absent an earlier credible bid, is that RBS will again roll the loan in October, before finally selling the club later this year/early 2011.
So what has gone so spectacularly wrong off the pitch? Clearly the recession of 2008 proved a huge challenge to industry, although football, with a strong global support base actually weathered the storm comparatively well. Liverpool’s problems lie in the unsuitable debt load and subsequent demands placed on the club post the 2007 acquisition.
As potential debt investors in LBOs (see here) (typically through high yield bonds that are issued to help fund the transaction) we favour those industries and companies with stable and recurring cash flows. We also look for hard assets that we can fall back on if things were to go wrong (higher recoveries), as well as an ability to recognise synergies and operational improvements – leading to improving cash flow and profitability.
Sadly for the fans of clubs with spiralling debts, football fails to tick the boxes. The fixed nature of players’ contracts, an ever increasing wage/revenue ratio, and the ongoing pressure to compete with ‘trophy’ signings make the cash flow generation required to service interest costs a real challenge. Deloitte’s Annual Review of Football Finance 2010 (see here) makes interesting reading. Over each of the last three years the wage bills of Premier League clubs have grown in double digit percentage terms. ‘With wages growth outpacing revenue growth in 2008/2009, the Premier League’s wages/revenue ratio increased to 67% – a record high.’ The report goes on ‘[in] a classic example of competitive game theory, clubs are continually driven to maximise wages rather than profitability.’ Despite increasing income streams ‘the vast majority of those revenues will quickly flow into the hands of players and their agents.’ Clearly operational achievements will be massively hampered in any industry operating under said conditions.
Football clubs also tend to be asset-light businesses, with those assets that they do own proving difficult to value. What is Anfield worth if football isn’t being played there for example? How much is Wayne Rooney worth should he break a leg?
Beyond that, how willing or able would a lender be to enforce their rights in an event of default? Indeed, this no doubt partly explains RBS’s previous willingness to afford Liverpool’s owners extra time to find a buyer. Huge reputational issues aside, a punitive administration regime requiring a ten point deduction by the FA makes it a less than palatable option. Finally there is the issue of the super creditors rule, which places players, managers, the FA and other football clubs as preferential creditors in administration. The recent case of Portsmouth demonstrated that under these rules wealthy footballers are made whole ahead of HMRC. (see here)
The current underperformance of the high yield bonds issued by Manchester United in January 2010 (currently trading at 96% of face value to yield 9.6%) despite (sadly) strong performance both on and off the pitch, suggests other investors share our concerns. Whilst certain companies within industries such as cable and healthcare & packaging have proven themselves successful LBO candidates, most football clubs remain a far from attractive proposition for most debt investors.
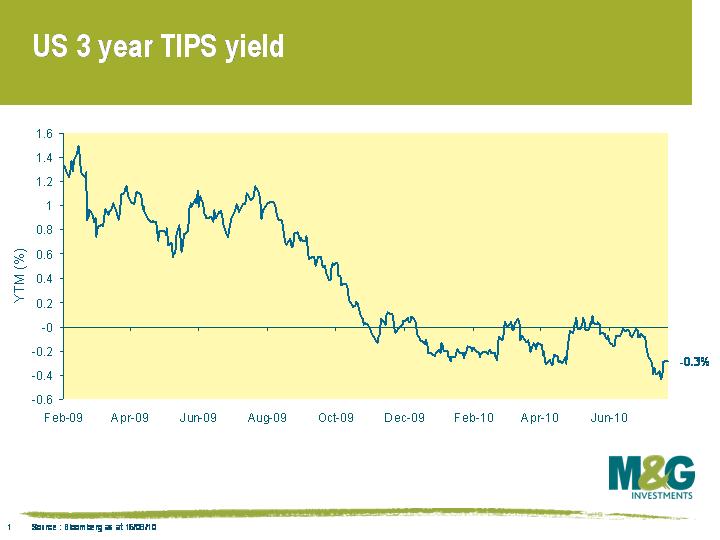
Last week a client asked us why US TIPS (inflation linked government bond) yields have been negative for much of this year (see chart), and we’re not sure we gave a very good answer. This weekend, to distract myself from the monotony of doing laps of Richmond Park on my bike, I came up with these 7 reasons why an investor would lock in a return guaranteed to be lower than inflation over the maturity of the bond.
1) Unlike the UK index-linked market, US TIPS protect the investor from deflation as well as inflation. If over the lifetime of the bond you experience negative price inflation, the $100 you invested when the bond was issued is what you get back, rather than a lower amount representing the increased purchasing power of your dollars. So as deflation fears grow, the TIPS market has an embedded option in it that turns your inflation linked bond into a nominal bond in a sustained deflationary environment – this is very much to your benefit, and is worth something. So the negative yield partly reflects the option value of the deflation floor.
2) Government bond yields traditionally reflect an amount related to nominal GDP growth in an economy. You have a choice – lend $100 to the government or invest it across the whole US economy and receive the average growth rate across all sectors, plus compensation for inflation. The efficient markets hypothesis says that ex-ante there shouldn’t be a difference between the two, or capital will flow from one to the other to equalise the difference. If you buy an inflation linked bond, you can remove the inflation compensation element of this calculation, so the TIPS real yield equals expected US GDP growth over future years. The market therefore believes that we are heading into a period of prolonged negative economic growth.
3) The market might also, or alternatively, believe that we will get strong inflation, and that they need to buy insurance at any cost. After all, where else can you buy inflation insurance? Equities, nominal bonds, property and even commodities perform badly in high inflation environments. So there’s a monopolistic seller of inflation insurance out there, and desperate buyers. When we buy house insurance we know we are overpaying relative to the risks of a fire or flood, but because the downside is so severe in the event of those things happening, we can’t afford not to be insured. And at least there is competition amongst sellers in that insurance market. So expensive and incomplete inflation insurance is better than nothing.
4) As discussed in my earlier blog about the Barclays Inflation Conference, the official inflation measures probably overcompensate investors for their experienced inflation. The Boskin Report suggested this overcompensation could be as much as 1% per year for US investors. In other words a TIPS investor gets paid measured CPI, which is much higher than the actual inflation they experience – thus they can buy TIPS at a negative yield and still get paid more than their own, actual, inflation rate.
5) Another explanation for why short dated inflation linked bond yields are negative (not just in US but in much of the world, e.g. France, Germany, Sweden, UK) is that the authorities’ reaction to the financial crisis was to slash their central bank rate (a nominal rate), such that negative real interest rates would encourage spending and borrowing. Now, if you put your savings on cash deposit at a bank, the nominal interest rate is marginally positive, but the real interest rate is sharply negative. If inflation linked bond real yields were positive in this environment then it would represent a ‘free lunch’. So negative global linker yields demonstrate that markets believe that expansionary monetary policy will be run for some time (i.e. the central bank rate will remain below the inflation rate – US TIPS yields are only negative out to 2014 but positive thereafter).
6) The previous suggestions have been about the demand for TIPS, but we can also consider the supply of TIPS by the US Treasury. Whilst the UK’s Debt Management Office targets around 20% of issuance into the index linked gilt market, the US Treasury has focused issuance on nominal bonds. So whilst the supply of TIPS has increased this year in absolute terms, as a percentage of issuance, supply has been in severe decline since 2006. Then it accounted for around a third of issuance, whereas by 2009 this had fallen to under 3%. There might be a scarcity premium in the TIPS market, which links back to the “buyers at any cost” argument.
7) Finally, one feature of a speculative bubble is that informed commentators can come up with six well thought out, rational, plausible reasons to explain an irrational price valuation. Perhaps this is one of those times.
Well sort of. It hasn’t got a lot of attention in the bond markets, but this week both Jon Hilsenrath in the WSJ, and subsequently Paul Krugman in the NYT have revisited Ben Bernanke’s paper Japanese Monetary Policy: A Case in Self-Induced Paralysis. Bernanke wrote this in 1999 as an academic at Princeton University. In it he calls on the Bank of Japan to set a “fairly high” inflation target to show that it “is intent on moving safely away from a deflationary regime, but also that it intends to make up some of the “price-level gap” created by eight years of zero or negative inflation”. Bernanke argues that an inflation target of 3-4%, to be maintained for a number of years, would give the private sector some confidence about the authorities’ desire to get away from the deflation trap.
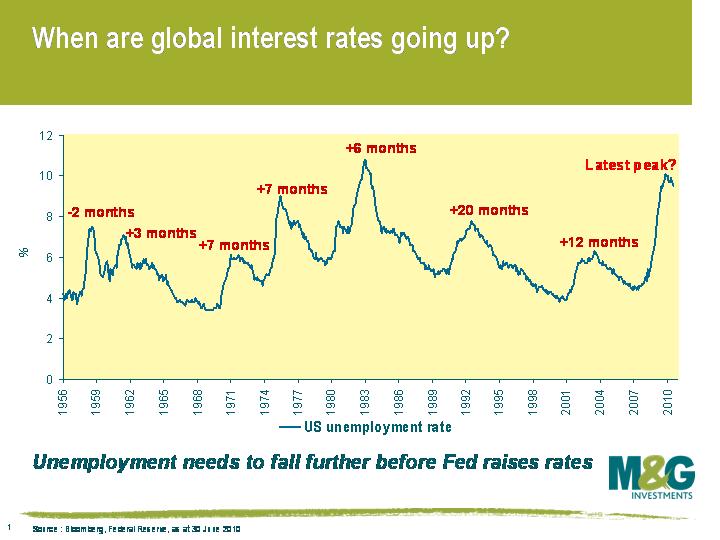
The BoJ obviously took no notice of Bernanke’s paper, and over a decade on from its publication Japanese CPI is still very negative year-on-year. The question is whether Bernanke’s plan to help Japan recover from the stagnation it suffered post the collapse of its commercial property bubble reflects his thinking on what the Fed should do to help America recover from the stagnation it’s suffering post the collapse of its residential property bubble. Currently the Fed targets a long term inflation rate of just 2%, but also has an objective to maximise employment. We’d argue that the Fed has generally put the function has always been to wait for the unemployment rate to start falling before it hikes rates (the lag between unemployment falling and the Fed hiking has been especially long in the last two economic recoveries – see chart).
However, a doubling of the US inflation target would cause carnage in the US Treasury bond market (who wants a 10 year bond yielding 2.7% when the Fed is targeting 4% inflation?) – and with one of the shortest debt maturity profiles of any developed economy, the interest burden cost of changing the target might be enough to trigger a credit rating downgrade (and in the medium term even a default?). For this reason alone I think that Bernanke is unlikely to talk about a change in the target publicly (although others, including IMF Chief Economist Olivier Blanchard have been arguing for such a change). Because of the political and public disregard for the runaway budget deficit, and the US Treasury’s behaviour in borrowing short to finance it (50% of the US Treasury market matures in the next 3 years), Bernanke’s hands might be tied. The positive impact on private sector behaviour comes from loudly signalling a change in inflation behaviour, but the reliance on overseas investors to finance the US deficit makes such signalling very expensive, and possibly lethal. So I don’t expect a change in Bernanke’s rhetoric around the inflation target. But actions speak louder than words, and we will see the zero interest rate policy continue for the foreseeable future, and continued excursions into the world of quantitative easing. As for the outcome of such policies, it would be foolish to put too much conviction as to whether the western economies end up looking more like Japan, or more like Zimbabwe.
We first started writing about the credit crunch 3 years ago (see August 2007). Since then, short-term interest rates in the USA, Europe and the UK have collapsed to near zero. Ten year government bond yields across the respective economies have fallen by around two percent. Whilst the fall in interest rates and yields has been a great present for government bond investors, the global economy has been suffering one of its worst recessions since World War II. But enough history. What about the future?
Financial market values at a simple level are driven by two basic themes – long term trend following and shorter term mean-reverting price action. This is also generally true of economies. Looking back over the past 50 years, we have seen a period of strongly upward trending economic growth within which there has been cyclical up and downturns. It has been the job of the modern fund manager from a stock selection point of view to identify if individual stocks and sectors are in a long term trend or mean reverting mode, whilst from the macro point of view they have just had to focus on where the economic cycle is within its permanent uptrend.
The challenge investors now face is to add another dimension to this traditional thinking. What if economic growth is no longer permanently upward trending? What if the trend of growing economies in the developed world is coming to an end?
The credit crunch is now three years old. Where is the upturn in economic growth? On Tuesday the US Federal Open Market Committee (FOMC) acknowledged that we were not there yet and have decided to reinvest the assets they purchased through quantitative easing. This is an acknowledgement that it is still not time to start tightening monetary policy. The FOMC have used up all their bullets in the interest rate armoury by reducing interest rates to near zero percent, encouraged the huge fiscal pump priming undertaken by government (Republicans and Democrats alike), and used unconventional measures of quantitative easing. These policies have been replicated to a lesser or greater degree within the G7 and beyond. And despite all of these extraordinary measures, the global economic recovery remains in doubt. It is fair to say that those central banks around the world that are currently running ultra-easy monetary policy will continue to do so for some time to come.
The interesting question now is whether we are in a long term structural change in economic growth prospects. Maybe we are no longer just in a cyclical downturn. It has been 3 years since the credit crunch began, and the arguments that this is not a normal economic cycle are becoming more compelling. If this is the case, it will be a long term growth environment that the Western world governments, central bankers, and fund managers have never seen before in their working lives. A challenge indeed.
The July RICS survey continued the worrying trend of weaker UK data that has been in evidence since the preliminary UK Q2 GDP data release on July 23rd. It seems that the economic slowdown that has been evident in the US in the past few months is no longer contained to the US alone. The survey showed that UK surveyors are on balance seeing house price falls rather than rises, the first time this has been the case since July 2009, and signs of both weakening demand and greater supply meant that future price expectations turned more negative.
We’ve focused on the UK and US housing markets on this blog a lot over the years, and forward looking indicators such as sales/stocks ratios or mortgage approvals played a primary role in shaping our exceptionally gloomy view on the UK and US housing markets (and hence financial markets) in 2008. The correlations between the variables has changed, as correlations always do, but you can definitely get a feel for which way the UK housing market is headed by eyeballing this updated chart, which plots UK house prices against the RICS sales/stocks ratio (ie the number of sales that estate agents have made over a rolling 3 months divided by the total number of properties that estate agents have on their books). A low ratio implies a glut of supply and/or poor demand, while a high number suggests houses are flying off estate agents’ books.
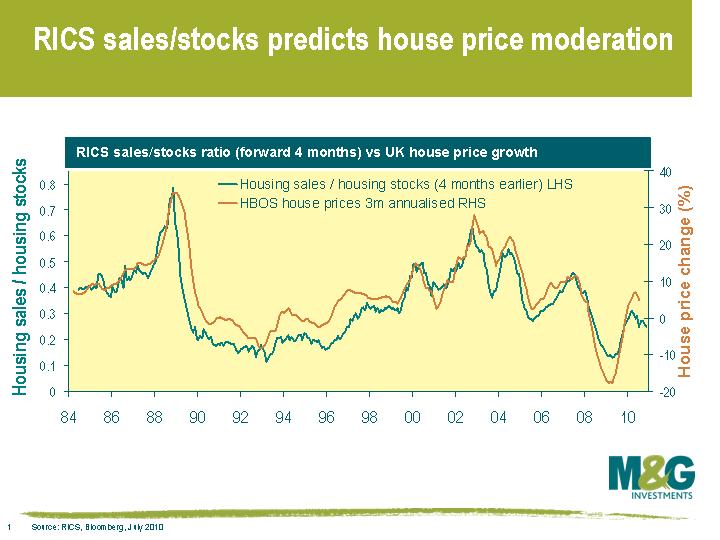
The RICS sales/stocks ratio doesn’t suggest that the UK housing market is about to fall off a cliff, but it does suggest that the short term outlook is for flat or slightly negative prices. This isn’t necessarily surprising considering that UK house prices moved sideways in the aftermath of the last housing crash in 1993-1995. But the concern is that the enormous monetary and fiscal stimulus of the past two years has only served to temporarily halt the decline in house prices, and house prices in the UK in particular still look very overvalued relative to average earnings. Another leg of house price declines will place significant strain on the already vulnerable banking sector, which would leave us looking more and more like Japan.
Returning to the recent trends in global economic data, some of the US slowdown may simply be because the economic benefit of the huge monetary stimulus at the end of 2008 has now worked its way out of the system (monetary policy operates with about an 18 month lag, as suggested in last week’s blog). The Bank of England didn’t move quite as rapidly as the Fed, with the final rate cut taking place in March 2009. The UK is only now starting to face a slowdown, which will likely be highlighted in the Bank of England’s quarterly inflation report released tomorrow. European data remains remarkably strong, although this may be partly because the ECB was slower and less forceful in implementing monetary policy (the final rate cut didn’t occur until May 2009). There have of course been numerous additional monetary and fiscal responses around the world since May of last year, but the beneficial effect of the ECB’s rate cuts will cease to be felt over the next few months and I’d expect European economic data to begin to weaken.
We’ve just got hold of some copies of the newly reprinted book about the Weimar Republic’s hyper-inflation, When Money Dies by Adam Ferguson. In 1923 the German mark was trading at 4,200,000,000,000 to the dollar, and the population was impoverished and reduced to barter to survive. Only the creation of a rival, asset-backed currency brought the hyper-inflation to an end. The book is an analysis of the causes of this monetary disaster, and the impact that spiralling prices had on a people already struggling under the burden of post-WW1 reparations. Are there any lessons to be learned by the present day Central Banks as speculation rises that the Fed is about to embark on a new round of Quantitative Easing?
We have 10 copies of the book to give away to the first 10 correct answers chosen at random to the following question:
In 1924 the UK went back on to the Gold Standard – with massively deflationary results. Who was the Chancellor of the Exchequer who took this decision?
We’ll draw the winners after the deadline of midday on Wednesday 11th August.
The information we collect from you is solely used to contact you in the event that you have won a prize.
To enter click here. (Competition now closed)
To see the terms and conditions, click here. (Competition now closed)
There is only one explanation for why 2 year US Treasury yields broke below 0.5% today (an all time low), or why 10 year government bond yields in Germany and the US are currently 2.5% and 2.9% respectively. Or, for that matter, why German 30 year bunds are now at just 3.2%. The bond markets clearly think there is a very real and increasing risk that the developed countries are going to end up looking like Japan. James Bullard of the Federal Reserve made this point in a recent academic paper, where he argued there’s a possibility that “the US economy may become enmeshed in a Japanese-style, deflationary outcome within the next several years”.
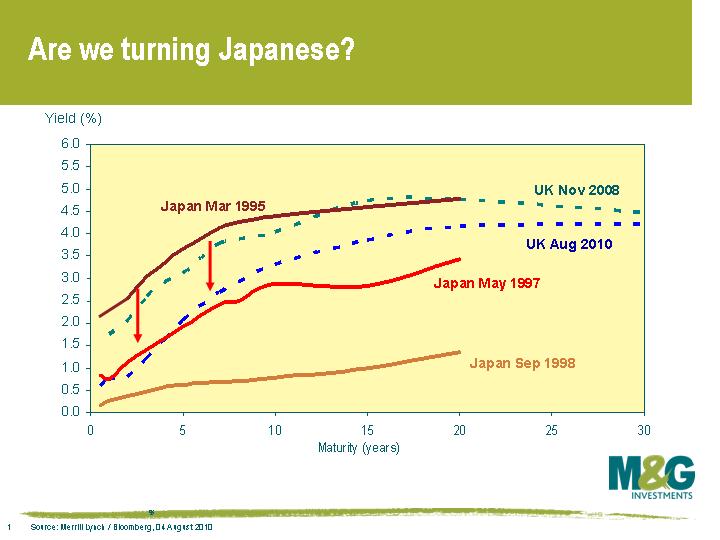
It’s interesting to look back at how sovereign bond markets have moved since November 2008, when I last made the Japan comparison on this blog (see here). In autumn 2008, the UK yield curve looked like Japan’s did in March 1995. Just under two years later, and the UK curve and indeed many other countries’ yield curves look similar to Japan’s in May 1997 (see chart).
Is the market justified in believing that we’re turning Japanese? Some may argue that the economic recovery in the developed world from early 2009 has looked distinctly un-Japanese. Preliminary figures for real UK GDP in Q2 were +1.1% (unannualised), the fastest pace of expansion since Q1 2001. US GDP hit an annualised rate of +5.0% in Q4 2009 and +3.7% in Q1 2010. While the recent estimate for US GDP in Q2 was a weaker +2.4%, global economic data (even in the US) is not (yet) suggesting anything worse than a modest slowdown.
However, Japan’s growth initially followed a similar path in the mid 1990s – the year on year real growth rate remained positive in every quarter from Q2 1994 to Q3 1997, averaging a healthy +2.1%. The problem was that what appeared to be reasonable growth was a result of a huge surge in government spending and monetary stimulus. It wasn’t sustainable. A lack of consumer demand, a broken banking system and falling asset prices then combined to feed into falling inflation. Core inflation (ex food and energy) fell from 2.3% at the end of 1992 down to 0.5% in 1995-1996. Headline inflation briefly dipped below zero in 1994-5, and both measures fell below zero in 1998 and have stayed there more or less ever since. The Japanese authorities weren’t able to do much in reaction to this fall in inflation – monetary policy became ineffective once rates hit 0.5% in September 1995.
The worrying thing for the developed world is that cuts in the Bank rate tend to take 18 months to have a full effect on an economy, and it’s perhaps no coincidence that the slowdown that hit the US a few months ago has come 18 months after the final Fed rate cut in December 2008. The only path left for central banks is unconventional monetary policy, and is something that developed economies began last year. While the policies haven’t been totally ineffective (the Bank of England estimates gilt yields are 1% lower as a result) and we’ll never know what would have happened without the extraordinary measures, money supply growth is still generally weak or falling. Developed world economies appear to have fallen into a liquidity trap, as argued by Paul Krugman here. This has serious consequences – if policy makers are running a Zero Interest Rate Policy (ZIRP) and inflation is falling, then real interest rates are rising. And if the economy falls into deflation, then you have positive real interest rates precisely when you don’t want them, ie monetary policy is tightening.
The Japanese actually had a big advantage over us – thanks to Japan’s huge domestic savings, the authorities were able to channel a huge amount of money into the domestic government bond market and were therefore able to maintain huge budget deficits and run up massive public debt levels (public/debt GDP is now over 200%). This fiscal stimulus is a luxury that most developed countries don’t currently have. We’ve had unprecedented monetary and fiscal stimuli since Q4 2008, but bond markets are forcing most governments to withdraw fiscal stimuli. Further stimuli would increase the risk of sovereign insolvency.
So now, not only are we facing deleveraging in the household sector and the financial sector, but we’re also about to face deleveraging from the public sector. The consequence of deleveraging ought to be lower growth and lower inflation and this appears to be happening. Monthly headline US CPI has now fallen for three consecutive months, which has only happened a handful of times since the data series began in 1947. Eurozone CPI is 1.4% year on year, and that’s even before the fiscal austerity has really started. The UK appears to be the exception, although while inflation is a concern as mentioned previously here, inflationary pressure can be largely attributed to the combination of a VAT increase and the lagged effect of previous sterling weakness (and note that sterling has strengthened about 8% since the beginning of March on a trade weighted basis so currency strength should soon begin to have the opposite effect).
If you take the old rule of thumb that a 10 year government bond yield should equal the long term growth rate plus the long term inflation rate, then it’s clear that bond markets are pricing in a grim scenario. Other risky assets arguably aren’t though, and there’s a clear disconnect. If the majority of the global economy does indeed go the way of Japan, I suspect that a lot of seemingly cheap assets will get even cheaper.


Sign up to the Bond Vigilantes mailing list to ensure you never miss a great article from our expert Bloggers. We will email all new articles to your inbox, meaning you can stay on top of the world of Bonds.
I confirm that I would like to receive information about Bond Vigilantes and products and services from M&G Securities Limited.
We will use the email address and personal data you have shared with us to send you this information. For existing customers, submitting your contact details and requesting to receive this information from us, will replace any earlier choices you have made in respect of marketing information.
You can unsubscribe from marketing at any time, at which point we will not send any further marketing information to you, by selecting the unsubscribe link in all communications.


