
Rolldown
A dispatch from the number crunchers – Yield curve rolldown
By Matthew Russell
15 April 2026

This morning, with the release of the MPC’s latest minutes, we discovered that a further member of the committee voted for a rate hike at the last meeting. Spencer Dale voted for an increase in the base rate of 25 basis points. That now leaves the votes: 3 to tighten, 5 to stay on hold and 1 to further loosen monetary policy (Adam Posen is still calling for more QE). The general tone of the minutes feels to me as though the committee in general is getting more hawkish and it’s becoming more likely that the base rate will be increased before too long.
One of the factors that the members of the MPC consider when making their judgments is inflation expectations. It seems pretty logical that if people expect inflation to be higher in the future, inflation will be higher – if you expect inflation to be 5% then when it comes to your annual pay review you will be looking for a 5% increase in your salary to maintain your standard of living. To meet this demand for higher wages companies will increase prices, inflation ticks up…….and so on. Well, at least that’s the theory. I’ve put this chart together to show how accurate inflation expectations have been at predicting what inflation actually turned out to be. I’ve taken data from a couple of surveys that ask participants what they think inflation will be in a year’s time and moved it on a year to show how their predictions matched up with reality.
I think the period from 2008 to 2010 demonstrates the problem with these surveys nicely. In late 2008 inflation was as high as 5%, at that point when asked what they thought it would be in a year’s time the median response was roughly the same level. Inflation was actually around 1% a year on.
As you have seen, since the financial crisis, expectations have not been a particularly good indicator of future inflation, therefore the recent talk of heightened expectations should have little, if any, bearing on the committee’s decision whether to hike rates. Let’s put them to one side for now.
The elevated level of inflation we are currently experiencing is being fed not by demand for higher wages, but by higher raw material/import costs. Monetary policy is a powerful tool but I think we’re fooling ourselves if we think that the Bank of England has any control over the price of oil for instance. Clearly they could hike rates to strengthen the pound, but in the process this would hamper our exporters – not a great way to stimulate a much needed domestic recovery.
Since the inflation pressure is coming from the supply side, increasing rates would, in my opinion, inflict even more pain on the British consumer. Whether the cost of goods (inflation) rises, or you increase the cost of the money used to buy those goods (interest rates), the outcome is the same – demand falls. I totally buy the argument for not letting inflation get away from us, but the risks on the downside to putting up rates in the short term far outweigh those to the upside, and should only be countenanced if wage pressures begin to emerge.
This week RPI broke through 5% and CPI broke through 4%. The media are almost universally calling for rate hikes, politicians are starting to voice their opinions loudly, and many investors are worried.
If the market reacts to higher inflation by pricing in more rate hikes, that’s bad news for gilts and index-linked gilts. But for investors such as us who are trading so-called breakeven strategies (ie taking a view on changes on the future inflation rate that’s implied by the bond market), a key question is do conventional gilts or index-linked gilts perform better as the Bank starts hiking? If the market believes the rate hikes will solve the inflation problem then the breakeven inflation rate would be expected to fall and linkers would perform worse than conventional government bonds. If the market believes that a rate hike won’t have any effect, or ascribes low credibility to the policy and its makers, then you’d expect linkers to outperform as the market prices in higher inflation in future.
There is an interesting and frequently overlooked short term dynamic between inflation and interest rates. Mortgage interest payments (MIPs) are a part of the Retail Price Index (RPI) number. MIPs aren’t part of the Consumer Price Index (CPI), the measure of inflation the Bank of England target, although bond markets are (currently) priced off RPI, so that means MIPs matters.

MIPs represent 3.4% of the RPI basket today. So Jim emailed us from the ski slopes saying we should find out what proportion of borrowers are on SVR and trackers, make some assumptions about a plethora of things, and try to estimate what proportion of a rate hike would feed directly into higher MIPs and so into RPI.
What we ended up doing instead, somewhat indolently, was calling BarCap’s inflation guru, Alan James, and asking him what his estimate of the sensitivity of RPI to a rate hike is? Alan was (and is) a great help to us in our preparation for the inflation funds, and I should take this opportunity to thank him! Unsurprisingly, to those who have seen Alan present or who have met him, he had already done this work, and he informed us that his belief is that the relationship is about 0.66, meaning that two-thirds of a rate hike will directly pass through to RPI via MIPs.
The market is now pricing in three 25 basis point rate hikes this year. That means of 75 bps of hikes, MIPs will be pushed up enough to cause RPI to rise by about 0.5%. So the Bank of England hikes rates to lower inflation, and a direct offshoot of this is that RPI actually rises! As this MIPs increase feeds through to RPI, I’d expect to see the front end of the linker curve outperform conventional gilts. It’s not unreasonable to expect breakeven expectations to fall at the longer end reflecting the belief that the dawn of a monetary policy tightening cycle will mean we’ll be moving towards a structurally lower inflation environment. Interesting, these unintended consequences…
A fiscal rule is a permanent constraint on fiscal policy through simple numerical limits on budgetary aggregates. The purpose of fiscal rules is to force governments into responsible fiscal behaviour at a time when it may not be in that government’s short term interests. Both the EU and the UK experimented with fiscal rules until the great financial crisis hit. Then all the rules flew out the window.
The twenty members of the European Economic and Monetary Union (EMU) are subject to the Stability and Growth Pact (SGP). Within the SGP, the member countries are expected to commit to three fiscal rules: the general government fiscal deficit is to be less than three percent of GDP; gross government debt is to be less than 60 percent of GDP and; the general government fiscal deficit should be close to balance or in surplus over the economic cycle. The Maastricht criteria were put in place for EU member states joining the EMU. The SGP was meant to ensure that European nations continue to observe the Maastricht criteria after they join the EMU.
In the UK, the “Code for Fiscal Stability” was passed into law in 1998 and contained a number of budgetary rules. The golden rule is over the economic cycle, the government will only borrow to invest and not to fund current spending. The sustainable investment rule states the public sector net debt as a proportion of GDP will be held over the economic cycle at a stable and prudent level. The government defined this level as 40 percent of GDP. The permanent balance rule indicates that tax revenues are planned to be a constant share of GDP, the permanent tax rate or share. This share is the lowest constant share of tax revenues in GDP that would ensure the long-run solvency of the government. The Code does allow the UK government to depart from the rules, as long as it gives a rationale for its decision.

This chart shows that governments broke their own fiscal rules in order to support their respective economies and financial systems. There are now a number of countries that are in real danger territory. How they will get themselves out of the mess they have found themselves in is anyone’s guess.
In the UK, the government has formally suspended the rules and replaced them with a commitment to improve the government’s finances when the economy returns to a positive economic growth rate. In Europe, the SGP is being reformed but not to everyone’s satisfaction. Axel Weber (Head of Germany’s Bundesbank until April 30) has called for more consistent sanctions on any breach of the rules and a swift consolidation of European government budget deficits.
It is notoriously difficult to enforce fiscal rules. It is not possible to fine governments as they may exacerbate the issue that the government is being fined for and would be counterproductive. Potential enforcers of fiscal rules are the investors in government debt and credit rating agencies. If fiscal rules are broken and investors and credit rating agencies become sufficiently concerned about the sustainability of the government’s finances, it will have a large impact on the cost of capital through rising bond yields. Additionally, the government may find it hard to raise finance completely from capital markets as has been the case recently in Ireland and Greece. These countries have also had their respective credit ratings downgraded on concerns about the possibility of a debt restructuring event.
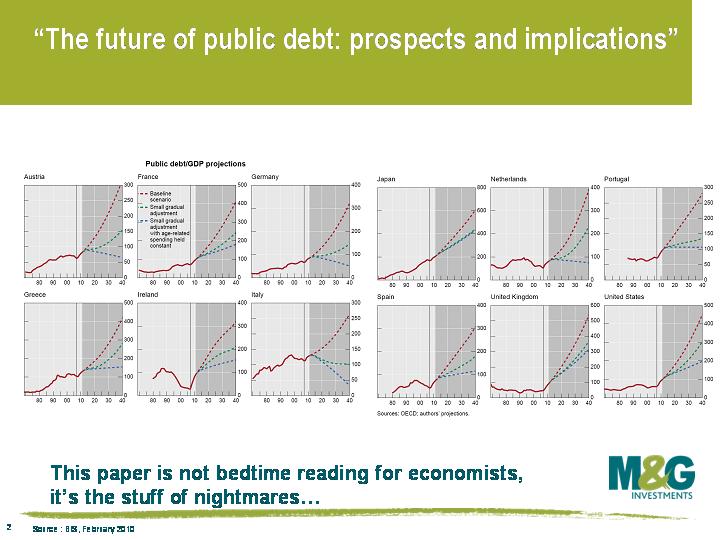
In February 2010, the BIS released a working paper entitled “The future of public debt: prospects and implications”. The attached chart show 30 year projections for the debt/GDP ratio in a dozen major industrial economies. The large deterioration in debt figures is the result of rapidly aging populations and unfunded liabilities stemming from future age-related spending in these countries. The red line represents the baseline scenario, the green line represents a gradual improvement of government finances, and the blue line represents draconian policy of cutting future age-related liabilities (an incumbent government would have to be bonkers to do such a thing!). The paper does not offer any advice on how to tackle the looming fiscal dangers but does note: “a decision to raise the retirement age appears a better measure than a future cut in benefits or an increase in taxes”. This is an interesting thought. In 20 years time, will the retirement age be 70, 75, 80?
It tends to be the case that governments faced with reducing government spending, cut potentially beneficial investment plans rather than current spending. Not good. As we all know, a newly elected government often has a tendency to abandon the previous governments announced policies. As mentioned previously on this blog, it may be the case that newly elected governments in countries like Ireland and Greece will choose to abandon the fiscal austerity plans of the previous government. This could have a massive impact not only on their respective economies but also on bond markets.
I came across this daily CPI estimate in a Bloomberg article this morning. Called the Billion Prices Project (BPP), it’s run by two MIT academics and aggregates 5 million online prices on a daily basis. Whilst the basket of goods is always going to be somewhat different to that used in the official data, the trends that the BPP model picks up can give a real-time guide to the direction of inflation. For example in 2008, following the collapse of Lehman, the BPP started showing price falls within a week – the official US CPI data didn’t reflect that prices were falling for another 2 months.
The chart below shows the latest US readings – it’s perhaps worrying to note a significant acceleration in prices in recent weeks – and the year on year numbers are showing 2.25% inflation on the BPP measure compared with 1.5% on the official Bureau of Labor Statistics numbers.
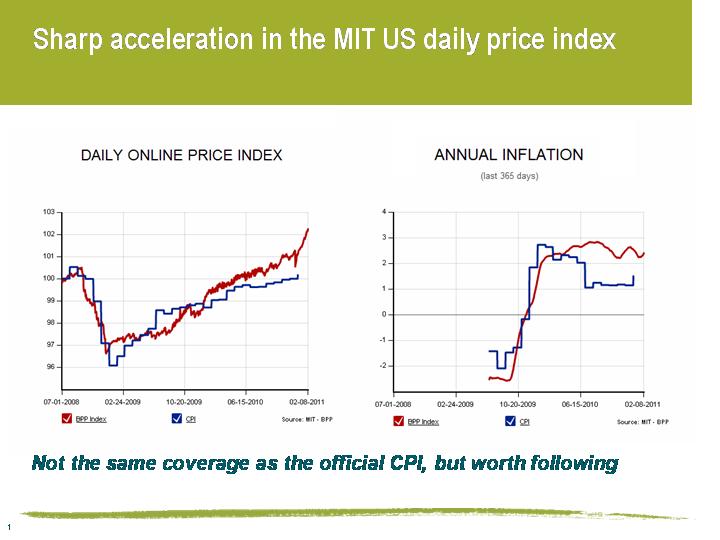
Sadly there is no UK model at the moment (it’s being updated) – it would be very interesting to get a feeling for the pass through rates for January’s VAT hike – did stores pre-hike VAT in December, wait until the 4th January, or most worrying, perhaps they have waited until the end of the sales and are implementing the hikes now?
When investing in credit, you perform a cost benefit analysis by weighing the risks you are taking against the spread you receive over risk free securities. This excess yield spread is easily observable, and from it you can work out the implied probability of default. It is not the end of the story when a bond defaults though. The important factor that will determine the eventual loss that you may suffer will depend on how much you recover in bankruptcy, and when this recovery is realised. The difference between what you are legally entitled to receive (100 cents in the dollar) and what you actually get is termed a ‘haircut’. A bond that defaults where the bondholder receives a 100 percent timely recovery rate is not much of a problem, while severe haircuts dramatically reduce returns.
The corporate bond markets, particularly the dominant financial sector, will be facing a very interesting month ahead (financials form just over half of all investment grade corporate bonds in Europe, just under half in the UK). The Irish election is being played out on the back of a weak economy and fiscal rectitude. The previous administration attempted to guarantee all senior Irish bank debt, thus saving bond investors from a haircut, in order to maintain confidence and to reduce wider systematic risk. It was thought that the Irish crisis would be temporary. The crisis however is not temporary (see my previous comments here, and Anthony’s comment here). Ruling party Fianna Fáil, the architects of the policy error, is set to be replaced by Fine Gael on February 25th as the largest ruling party for the first time since 1927. The new arrivals are campaigning aggressively from a bondholders’ perspective, arguing that senior bonds in weak financial institutions should take a haircut.
When Irish senior bank debt was issued, investors received an extra premium for the risk but saw the probability of default as remote. The implied recovery rate was estimated to be high due to the systematic implications of bank defaults, as well as the fact that senior bondholders were perceived to rank legally alongside depositors. The problem with legal contracts is that they can be rewritten by governments, and depositors are heavily protected by the state operators as they vote for the government. Legal approaches to banks in difficulty have evolved, so now it is possible to split the claims of the depositor away from those of the bond holder, allowing the politically important voters to be protected while effectively subordinating senior bondholders. Sadly for these bond holders, the haircuts they’re likely to be forced to take need to be substantial in order to make a difference to the troubled issuers of the debt, and the haircuts need to be substantial for preferred creditors such as depositors to be paid out in full.
The Irish election and resolution of their banking crisis is a litmus test for how governments and other institutions will share the burden of losses. If losses are large for investors in Irish bank debt then it will not be a “fantastic day” for bank bondholders with or without Irish exposure.
George Osborne announced yesterday that the UK’s major banks and the government have come to an agreement over bonuses. Lloyds and RBS have gone as far as limiting cash payouts to £2,000. The deal has been agreed as part of Project Merlin – the government and the banks are attempting to come to some sort of settlement over how the banks should/will behave in the future.
As well as making the bankers’ bonuses disappear, Merlin has also led to the banks committing to lend £190bn to businesses in an effort to support the economy. It’s a noble objective but one which is going to cause the banks further pain. Lending to SME’s has never been a particularly attractive activity and it has become even less so since the beginning of the financial crisis. These charts, submitted to the Independent Banking Commission by Barclays and RBS which were kindly highlighted to us by Tamara Burnell (head of our financials credit analysis team) show the cost to banks of providing credit to companies. They are effectively saying that lending to small and medium sized firms has never been particularly profitable and is even less so now.
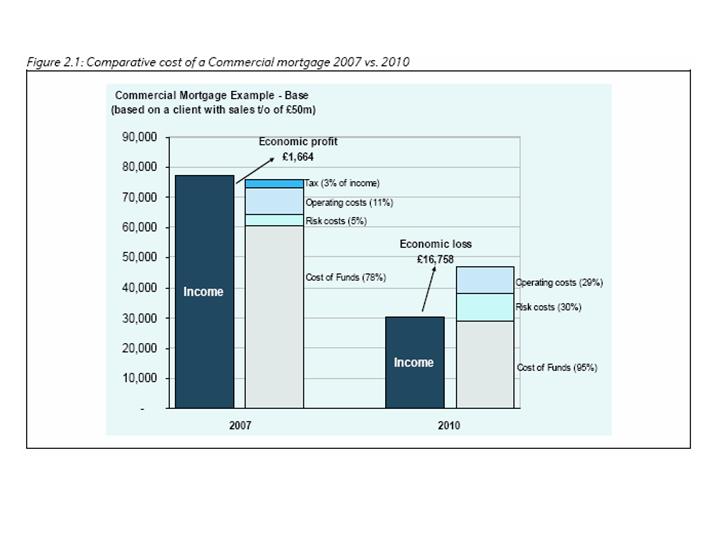
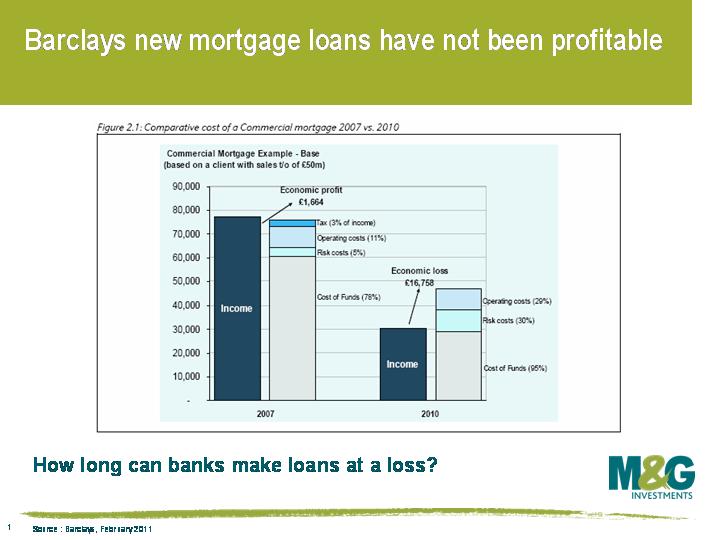
The first, from Barclays, shows that they barely made any money from providing commercial mortgages before the crisis and how unprofitable it has become for them.

The second one shows that the cost of funding for RBS is higher than the rate at which they lend to SME’s.
Forcing banks to lend on uneconomic terms at a time when they need to be increasing their capital levels feels a little counterintuitive to me. I understand the rationale of trying to buoy the economy, but putting banks under more stress when they are already weakened just doesn’t seem like the cleverest move to me. Will the bonus caps lead to a brain drain from British banks if the best and the brightest can earn more at their foreign competitors? It also doesn’t take a wizard to realise that is was too much lending that caused the financial crisis and resulting recession in the first place, will more really do the trick?
With the European Central Bank warning that the inflation outlook “could move to the upside“, and hinting that rates could rise despite the fragility in peripheral Europe, any sign of inflation-busting wage hikes would have been a big red flag for government bond markets. IG Metall, the German metalworkers union, had demanded a 6% wage rise at the end of last year. Today, IG Metall and Volkswagen announced that they had agreed a settlement for 100,000 car workers worth somewhere between 3% and 3.5%. This is obviously above the 2% ECB inflation target, and above the actual 2% German inflation rate, but taking into account productivity gains – and the strength of the car sector, which has been driven by exports (Audi, a VW brand, is ubiquitous in China, they are selling 22,000 cars per month there compared with 13,500 per month in its home market) – it looks reasonable.
The threat of high wage settlements is not over yet – the chemical union IG BCE is demanding up to 7% for its workers (we’ll find out at the end of this month). But German trade unions have been relatively feeble in recent years. Demands have often been halved by the time of the agreement, and this has been at the time of strong export growth and falling unemployment when you might expect workers to be gaining power. German unemployment is 7.4%, lower than most other EU members (Spain is 20%!), the UK and US, and continues to fall. It might be that we’ll soon approach “full” employment (although West German unemployment was as low as 3% in 1980). It is notable that the German model is more collaborative than some – remember that in 2004 Siemens cut workers’ wages with the agreement of IG Metall. This was a pragmatic response to the threat of competition from Eastern European factories. Perhaps this time round the workers and unions recognise that the ECB would respond to inflation-busting pay settlements with a hike, perhaps killing the revival in the German economy (and sending the Euro higher, killing exports too)?
You would have to be living under a rock to not notice the increasing number of articles dedicated to the topic of inflation. The increase in inflationary articles has almost been as dramatic as the increase in inflation itself. Even 3 out of our last 4 blogs have been on inflation. Unsurprising really, seeing as we are bond investors. Looking elsewhere, the pundits have decided to focus on the idea of how an investor can protect a portfolio of assets from inflation. Having done a lot of research on the topic here on the M&G bond team, we would like to draw your attention to an IMF working paper entitled “Inflation Hedging for Long-Term Investors” which adds an interesting angle on the debate.
Alexander Attie and Shaun Roache tackled the subject of inflation hedging front-on, and discovered some surprising results in the process. Attie and Roache had a look at the asset classes that typically make up the core of long-term investor portfolios – cash, bonds, equities, property and commodities – and measured the sensitivity of asset class returns to inflation over a one-year horizon.
The authors found that “the ability of cash to hedge against inflation is heavily influenced by the prevailing monetary policy regime”. This is unsurprising given the success central banks have had in anchoring inflationary expectations since the 1980s. It tends to be the case that when inflationary pressures increase, the central bank will act by hiking up interest rates.
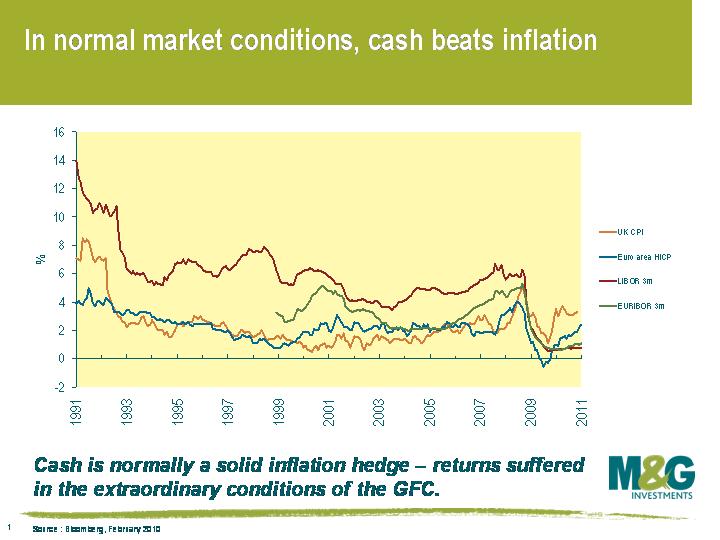
The most recent experience suggests that banks have been more willing than usual to keep rates on hold despite a pick-up in inflation. In the attached chart, we can see that inflation both in the UK and Europe has been running at a level that is higher than short term cash rates as measured by LIBOR and EURIBOR. This would indicate that whilst cash has traditionally been a partial hedge, since the financial crisis this has not been the case.
Both bonds and equities underperform if inflation increases. Looking at the analysis of returns since 1973, for a 1 percentage point increase in inflation over 12 months, the nominal annual return on a US Treasury bond benchmark fell by -1.33%. US corporate bonds fell by -1.91%. Equities experience even larger losses, with the same 1 percentage point increase in inflation leading to a fall in returns of the S&P 500 Index of -2.59%. Property, as measured by the FTSE NAREIT index does even worse, with returns falling by -3.48%.
Many investors point to the fact that commercial property rent reviews may be indexed to an inflationary measure, like RPI in the UK or HICP in Europe. However, because owners of property have generally levered their deposit through a loan, the cost of financing that loan will rise if interest rates increase to combat rising inflation. Pricing pressures on property arise when financing costs increase to material levels, causing both retail and commercial property prices to fall.
Commodities, as measured by the CRB Index, provide an effective hedge under this analysis with a 1 percentage point increase in the US CPI resulting in an increase of 3.77%. The gold spot price does particularly well, with the price increasing by 6.87%.
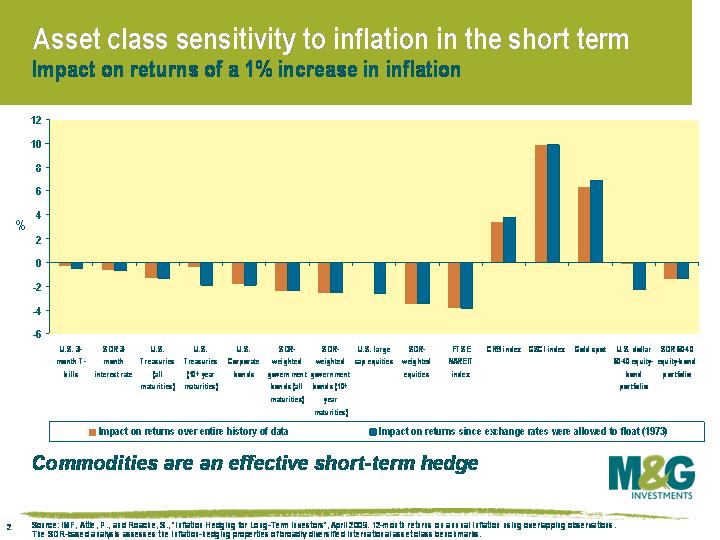
The attached chart shows the effects on nominal returns of various asset classes for a 1 percentage point increase in the rate of inflation over a one-year period. The results tend to be more conclusive for the post-Bretton Woods period since 1973. As you can see, all the major asset classes are assessed and all suffer after an increase in inflation, except commodities.
As Attie and Roache point out, “for long-term investors, a 12-month horizon is likely to be too short”. The lads use a long-run model to assess whether the returns exhibited in the short-run by asset classes are similar over a longer period (20 years).
In the attached chart, an elasticity of 1 indicates that the asset class provides a perfect hedge against inflation shocks and that real returns for the various indices remain unchanged.
The authors find that over a 20-year period, “cash returns do increase in response to an inflation shock, but the response is very gradual and less than full… Over time, cash begins to recover on an inflation-adjusted basis, but this process plays out over a very long period”. As discussed above, the move towards inflation targeting by central banks may mean that cash returns are more sensitive to inflation than has historically been the case.
Long-term treasury returns get whacked by inflation, as we would expect. Interestingly, these losses tend to peak around the 3 year mark of the 20-year time horizon with real return losses of nearly 2 percentage points. After this peak, yields and prices eventually stabilise and returns from treasuries improve due to higher running yields.
The authors find that the inflation shock is “likely to lead to higher long-term real yields, increasing the total return of bonds once the effects of the shock have been fully priced-in”. Additionally, the bond coupon is reinvested and bonds mature at higher yields. A bond investor doesn’t get fooled again after buying the bonds at low yields and inflation comes back.
With the risk of sounding like a one-eyed bond guy, I think I will directly quote Attie and Roache regarding equities:
“Equity returns decline in the months following an inflation shock and do not experience a meaningful recovery thereafter, leaving them as the worst performing asset class in our sample. After 1 year, equity returns are… 0.9% lower in real terms due to the inflation shock and the decline in returns bottoms out after about 3 years… [for a] 3% loss in real terms… Our findings are consistent with evidence from a range of earlier studies and add further weight to the evidence against the theoretical arguments for equities as a real asset class providing inflation protection when inflation is rising.”
The authors note that “this result does not imply that equities underperform inflation over the very long run; indeed there is ample evidence that equities outperform other traditional asset classes in real terms over long horizons”.
We think that what really matters for equity returns in an inflationary environment is the type of inflation an economy is facing. Is it demand-pull or cost-push inflation? In general, inflation is caused by demand-pull rather than cost-push factors. Demand-pull inflation is a sustained increase in the prices of goods and services resulting from high demand. No one is worried about economies overheating at the moment and thus demand-pull inflation. Arguably economies like Europe and the UK are facing cost-push inflation with the main cause being rising taxes and imported inflation. In an environment of cost-push inflation like the early 1970s, equity returns tend to suffer.
And whilst commodities do very well over the short-term, they tend to suffer over the long-term as the effects of inflation causes commodity prices to fall gradually over time. Commodity prices begin to fall, normally after a period of 2 years. Some reasons put forward for this relationship is that prices fall as supply comes on-stream, or demand for commodities is reduced because of higher interest rates or a business cycle slowdown.
Attie and Roache conclude that these findings have major implications for long-term investors, particularly if those investors have strong views about the path of inflation. In the words of the authors, “This is particularly true for “non-consensus” views in which investors may expect inflation surprises, whether positive or negative”.
Again, on equities I will leave it to the lads to express their conclusion:
Our results suggest that for investors who do not take tactical portfolio positions, the rationale for holding equities should be based on a very long-term horizon to ensure that the effects of inflation cycles average out. Investors with the scope to tilt their portfolios could underweight equities relative to their strategic benchmark in anticipation of higher inflation, but it may be more efficient to use other assets given their stronger and more consistent reactions”.
The paper is fairly damning for those who think they can inflation-hedge an investment portfolio: “among traditional asset classes, inflation hedges are imperfect at best and unlikely to work at worst”.
So what can investors do about protecting themselves from inflation?
Index-linked bonds (both government and corporate) are the only “traditional” asset class that will protect investors from inflation provided they hold the bond to maturity. As a buy and hold strategy, linkers work great. Because both the coupon payments and principal are adjusted in line with movements in a price index, an investor will be fully hedged against inflation (again – provided they hold the bond to maturity). Be warned – government linkers tend to be long duration securities, with the average UK and European linker having a duration of 15 and 8 years respectively. So investors have a lot of interest-rate risk in owning these bonds. Corporate linkers tend to have a shorter duration profile and it is important to have some short duration linkers in a portfolio as well. Don’t forget that there are also trading costs and there will be some price volatility as investors expectations for inflation change.
Inflation derivatives like swaps and options will also do the job, but it should be noted the markets for these derivatives are in infancy and considerably less liquid.
All in all, a very interesting paper that the pundits should try and get their heads around. It is one thing to look at a long-run chart of returns of the various asset classes through history, quite another to try and protect a portfolio of investments from future inflation.
Disclaimer – I don’t want to be accused of stealth marketing because that is not what the bondvigilantes blog is about, so here is a blog that Jim wrote about the launch of a couple of funds that aim at protecting investors from inflation. For what it is worth, we don’t think inflation is an issue over the medium term but think it will be sticky in 2011. Check out our views on inflation here.


Sign up to the Bond Vigilantes mailing list to ensure you never miss a great article from our expert Bloggers. We will email all new articles to your inbox, meaning you can stay on top of the world of Bonds.
I confirm that I would like to receive information about Bond Vigilantes and products and services from M&G Securities Limited.
We will use the email address and personal data you have shared with us to send you this information. For existing customers, submitting your contact details and requesting to receive this information from us, will replace any earlier choices you have made in respect of marketing information.
You can unsubscribe from marketing at any time, at which point we will not send any further marketing information to you, by selecting the unsubscribe link in all communications.


