
Rolldown
A dispatch from the number crunchers – Yield curve rolldown
By Matthew Russell
15 April 2026

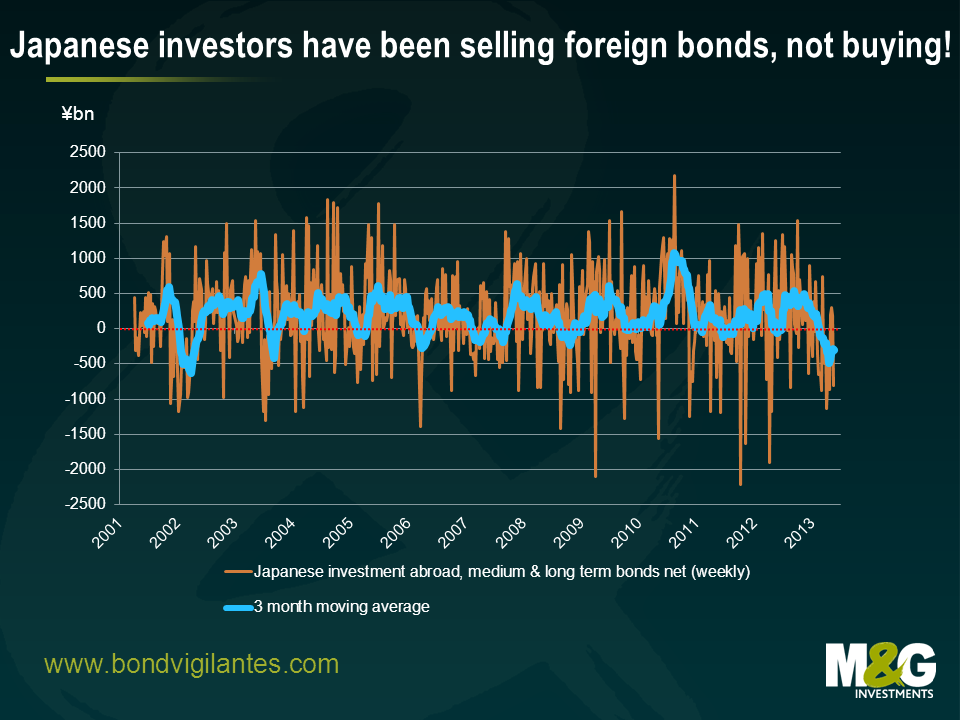
One of the stories that has driven global financial markets higher for the past few months has been about how Japanese investors are piling, or will pile, into foreign assets. Surely a rational Japanese investor would dump Japanese assets in an attempt to escape the exploding yen and the ravages of domestic inflation, or at the very least seek out a bigger yield than the puny returns available on the artificially suppressed domestic government bonds?
Well, they haven’t been buying foreign bonds; actually they’ve done the opposite. There were lots of headlines earlier this month after Japanese investors were (just about) net purchasers of foreign bonds in the three weeks to May 10th. But data out overnight showed that there were ¥804.4bn worth of net sales of foreign bonds in the week to May 17th, which more than reversed the previous three weeks’ purchases.
The chart below shows the weekly net purchases of foreign bonds, where the data is based on reports from designated major investors including banks, insurance companies, asset management companies etc. The blue line in the chart below is the 3 month moving average, and it shows that Japanese redemptions of foreign bonds are running at close to the highest rate since data began in 2001.
It’s difficult to deduce too much from all the data, but it appears likely that the rally in the Nikkei, the drop in the yen and the rally in semi-core Eurozone government bonds has been down to foreign investors front running something that so far has not actually happened. Japanese investors may still flee their domestic market, but it will require (mostly foreign) investors’ already high inflation expectations to be realised (the bond market is pricing in Japanese inflation averaging +1.8%pa for the next 5 years, despite there being little evidence that QE in Japan or other countries has succeeded in either generating inflation or in weakening currencies). It probably also requires changes to the higher capital charges that major Japanese investors face when investing in overseas assets, although even with this, funding costs and hedging requirements will ensure that home bias continues.
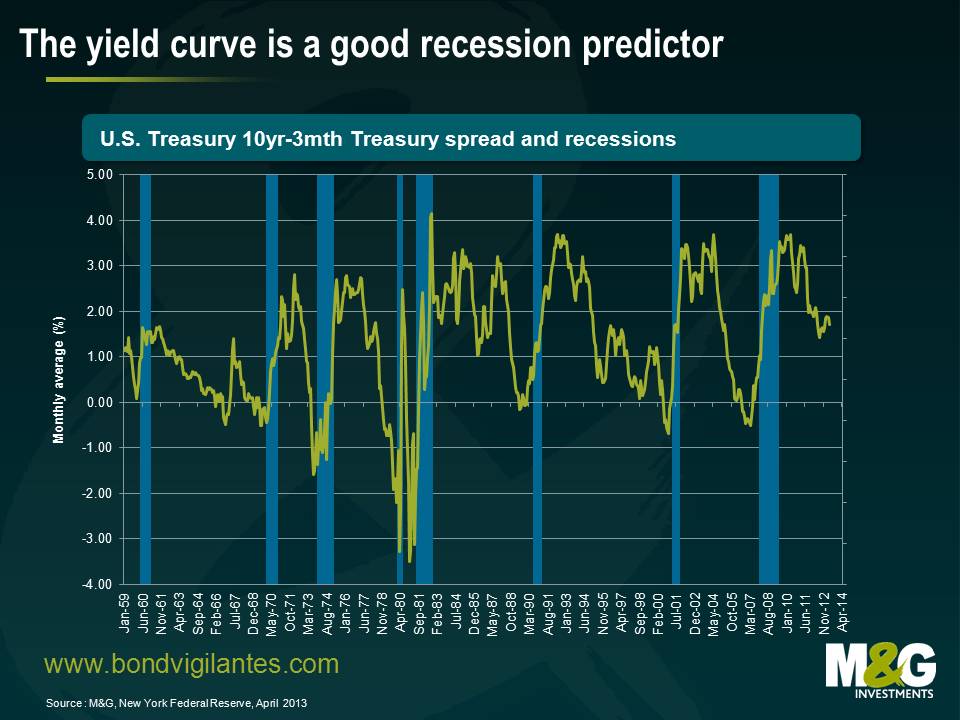
Knowing how poor the central banks have been at forecasting economic indicators, and having analysed the IMF’s wild forecasts, we think that it makes sense to take consensus views with a large grain of salt. However, there is a substantial body of empirical evidence that has emerged since the 1980s that suggests that the bond market is a pretty good predictor of real economic activity.
It has been proven that the slope of the yield curve has had a consistent negative relationship with economic activity in the U.S., with a lead time of around 1-1.5 years. By analysing the difference between 10-year and 3-month Treasury rates (also known as the treasury yield-curve spread), it is possible to calculate the probability of a recession in the U.S. in the coming 12 months. The theory goes that a monetary tightening will increase short-term rates, resulting in a flat (or inverted) yield curve as the economy slows and demand for credit falls. Additionally, inflation expectations may also fall at this time.
Research has shown that the yield curve has predicted essentially every U.S. recession since 1950 with only one “false” signal, which preceded the credit crunch and slowdown in production in 1967. This is shown in the chart below. There is also evidence that the predictive relationships exist in other countries, such as Germany and the United Kingdom.
Having established the predictive power of the yield curve, economists naturally wanted to assess what the yield curve was telling us about the probability of recession going forward. In 1996, economists from the Federal Reserve Bank of New York estimated the likelihood of recession based on the yield-curve spread.
Helpfully, the Federal Reserve Bank of New York updates its research on a regular basis. So what probability of recession in the next 12 months is the bond market currently pricing in? The answer is 5.38% to be precise (this is probably lower than it should be due to the Fed embarking on a record amount of quantitative easing).
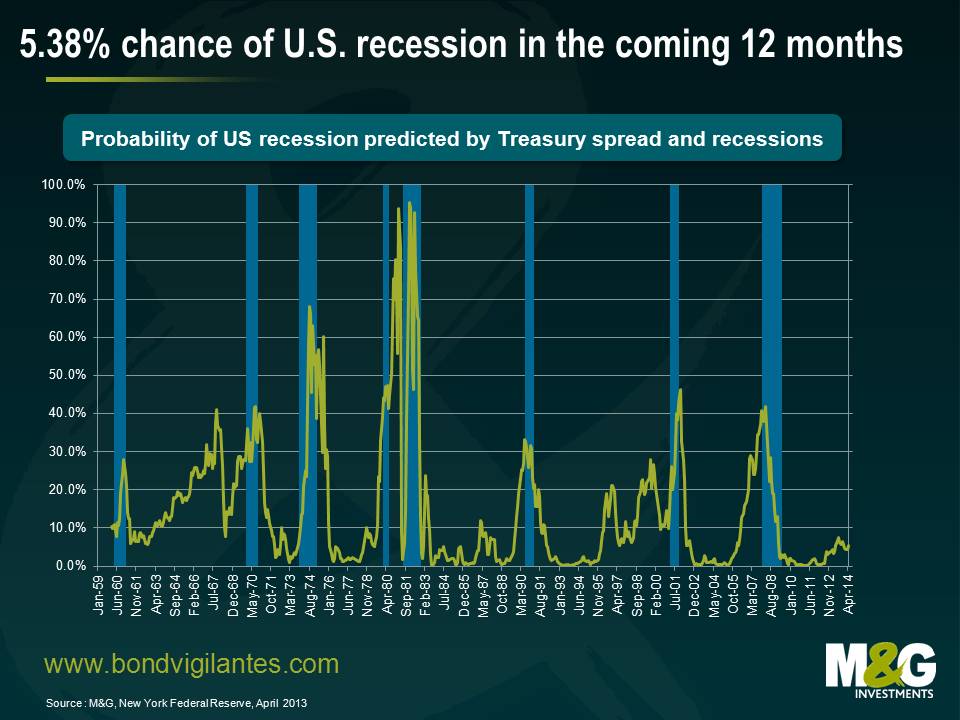
Some economists swear by the predictive power of the yield curve. Others argue the yield curve has lost some of it predictive power due to other factors that are driving the longer end of the yield curve; such as quantitative easing, currency pegs to the U.S. dollar, and regulations. However, the simple rule of thumb that the difference between ten-year and three-month Treasury rates turns negative in advance of recessions is still reliable, with negative values observed before the 1990-1991, 2001 and 2008 recessions. Perhaps Alan Greenspan’s “conundrum” of low long-term interest rates wasn’t due to what Ben Bernanke termed as a “global savings glut”. Rather, the yield curve was telling us that the chances of recession were rising, and this is reflected in the increase in the probability of recession from 4.5% in January 2006 to 38% in January 2008.
The yield curve remains a great tool for investors. Its power to predict recessions cannot be ignored, so beware if it inverts again.
Today is the last inflation report for Mervyn King, Governor of the Bank of England. He has served the bank for many years and has been the key figure at the bank for the past eight years.
King’s abdication (retirement) is a time to reflect on his achievements at the top. A keen football fan who happily uses soccer analogies, King would probably recognise his time as Governor has been a game of two halves.
The first half was great, with no apparent need to interfere with a perfectly balanced, strong growth, low inflation economy. The second half involved a great deal of stress and the need for intervention as the economy was weak, the inflation target was constantly missed, and he faced the financial equivalent of Chernobyl, as the banking sector began to meltdown.
King is not only a football fan but is also a regular sight at Wimbledon. Rudyard Kipling’s poem ‘If’ is the guide to how players should play on its perfect English grass courts. It is fair to say that King has appropriately treated success and failure in the same way. I would argue that his failures were in the first half of his term and his strength and ability shone through in the second half of his term. Although his critics may say that the seeds of the financial crisis were sown under his watch.
I think the seeds of the UK financial crisis were as follows:
Inappropriately low interest rates in the USA following the tragic events of September the 11th.
The removal of bank supervision from the Bank of England by Gordon Brown.
The need to hit a rigid inflation target when the world was enjoying low inflation because of world trade and productivity growth meant the use of over stimulative policy, causing a boom to keep inflation on target.
The euro creation resulted in an unstable financial system in Europe.
The first three of these have been resolved with the passage of time, a change in UK banking regulation back to the old ways, and a move around the world to more flexible inflation targeting. The last – the issue of banking in the eurozone – remains unresolved, but there are strong signs that potentially successful attempts are underway to solve the dichotomy of banking support from sovereign states within the eurozone.
We are avid watches of the inflation reports, and will be watching it today. The journalists get to ask questions. If I was there these are the three I would like to ask:
1. What do you think of the euro as an economic concept?
2. How close were we to financial Armageddon?
3. How does QE work?!
Sadly I think Mervyn will be as discreet as always in the press conference. Let’s hope that when he is allowed to speak freely, we get to see a little less candour and more transparency and insight into what has been an exciting time to be at the bank.
I think history will show that Mervyn King did a good job in handling the crisis. After all, that’s what central banks were created to do as lenders of last resort. From an economist’s point of view, what does his leadership prove? Well, Goodhart’s law was again proving itself to be correct. You aim to be a boring central banker and look what happens!
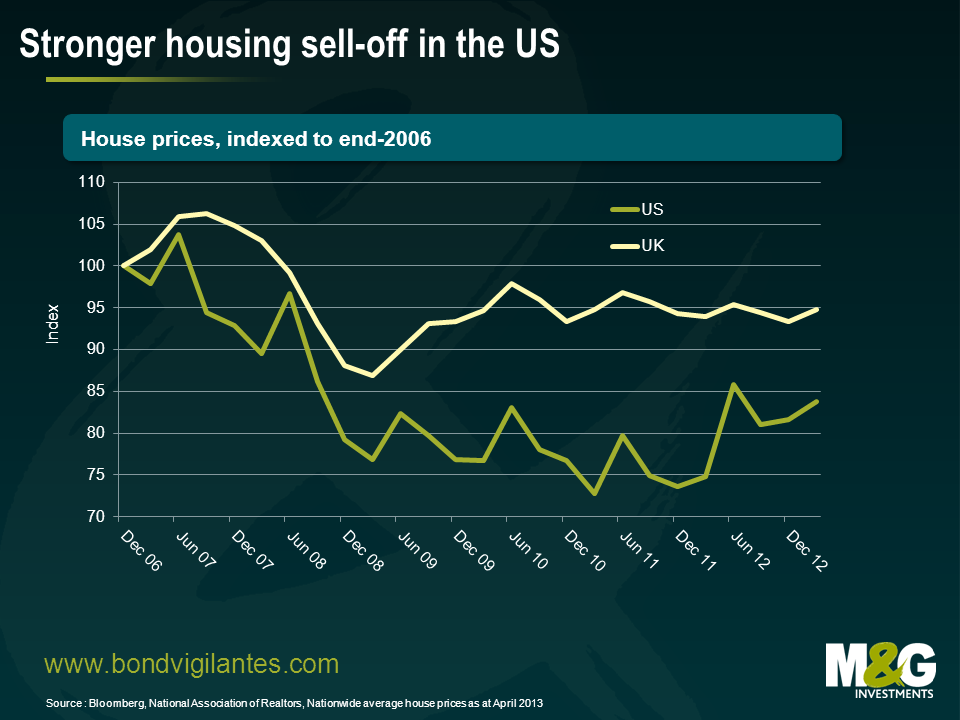
In recent months we have blogged about the recovery in the US housing market that is currently underway. This is in contrast to the UK experience, where the housing market appears to be stuck in the mud. We thought a quick look under the bonnet could reveal the dynamics at play in both countries.
In order to do this, we have constructed a housing affordability index that captures the three main barometers of the health of the housing market; wages, house prices and mortgage rates. By combining average house prices and mortgage rates, we can estimate the typical payments facing a mortgage holder in either country. We have then divided the average wage in both countries by this number. We think that this enables us to get a pretty good read on how affordable housing is in the respective countries.
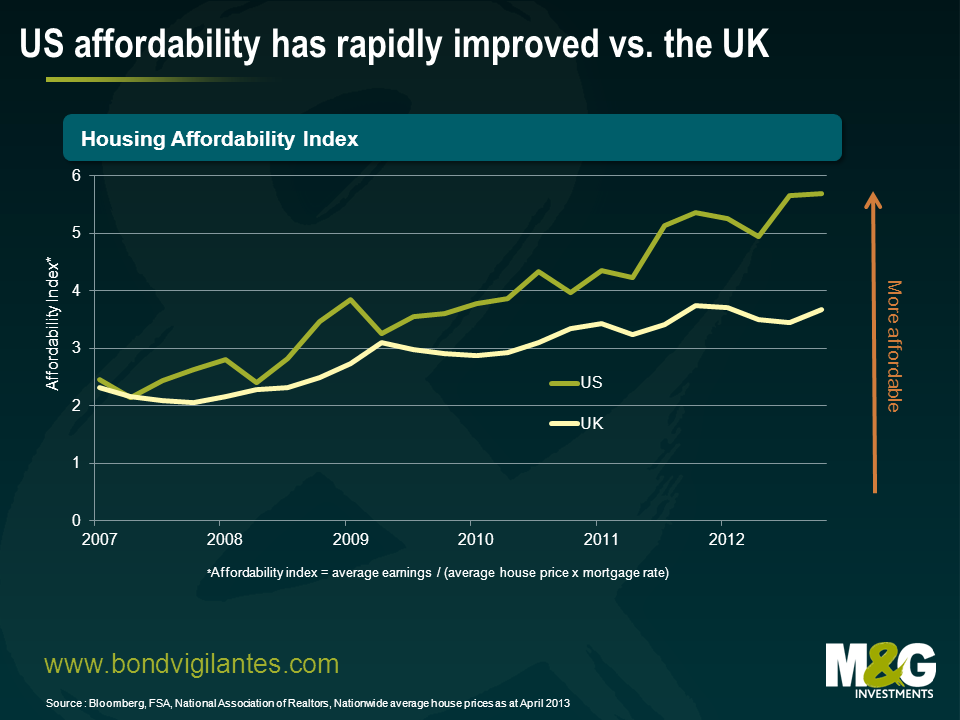
As the chart shows, owning a house has become considerably more affordable in the US relative to the UK since 2007. There are a number of reasons why this has occurred.
Firstly, US house buyers are feeling rate cuts to a greater extent than their UK counterparts. For example, at the end of 2012 30-year US fixed rate mortgages were 3.35% compared to an average UK fixed rate mortgage of 4.10%. As outlined earlier this month, UK building societies are finding it difficult to pass on any rate cuts because of the impact that such a move would have on their profits. Secondly, wage increases have also favoured potential American homeowners. In the US, wages have risen by nearly 16% compared to an increase of 12% in the UK.
The US has improved on two metrics relative to the UK, but the difference isn’t enough to explain the divergence in affordability between the two markets. The dominant affordability factor has been house prices.
US house prices saw a greater correction, falling by 30% from the peak to trough, while UK prices only fell by 18%. We have now seen US house prices generate solid returns for buyers, with prices now growing at over 10% year-on-year. This is likely to have a significant impact through the multiplier effect on consumption and GDP growth. In contrast, the UK housing market recovered relatively quickly, but since late 2010 house prices have been anaemic.
With the standard variable mortgage rate rising over the last 11 months, limited upward pressure on wages, and stable house prices it appears unlikely that the UK housing market is going to become more affordable for home buyers anytime soon. It is thus understandable that in order to assist potential homeowners, the government has launched its “Help-to-Buy” scheme (following the muted impact of its Funding for Lending scheme) which will come into effect in January next year.
Whether the scheme will work or not will continue to be debated amongst economists. The Help-to-Buy scheme should theoretically impact house prices in a positive way. But this could actually have a negative impact on those looking to buy and potential homeowners may end up borrowing more to purchase a house than they would if the scheme didn’t exist at all.
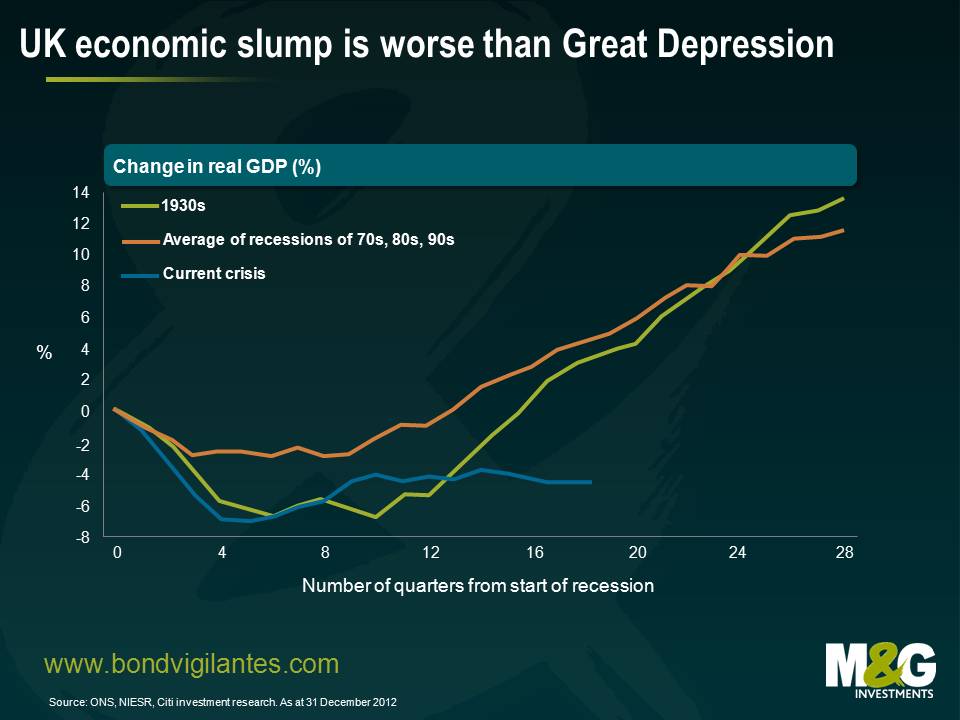
Mark Carney, currently Canadian central bank governor, will become the Governor of the Bank of England at the start of July. Handpicked from outside of the official application process by Chancellor George Osborne, he comes with high expectations about what he can do to get the UK economy out of a downturn arguably more severe in GDP terms than was seen during the Great Depression (or The Slump as it was known here). This now famous chart from the NIESR shows the extent of the underperformance of the economy relative to past recessions.
Carney’s stock is high – whilst the UK and the Eurozone remain in, or around, recessions, Canadian GDP is growing at 1.7% year on year, and its growth has outperformed the US economy both during and post the financial crisis. Inflation in Canada has averaged 1.8% over the past 6 years, compared with 3.1% CPI in the UK – perhaps the real blemish on inflation puritan Mervyn King’s legacy.
With Osborne having ruled out fiscal policy as a tool to get the UK out of its current Slump, our hopes now rest on either a significant and speedy recovery of our biggest trading partner, the Eurozone economy (and that looks to be going in the wrong direction), or monetary policy. In other words do the government’s hopes all rest on Carney doing something new and different, or massively increasing the scale of what the Bank of England has done before? If so we might all be disappointed. Here are five reasons why Mark Carney’s degrees of freedom might be fewer than he, and we, had hoped…
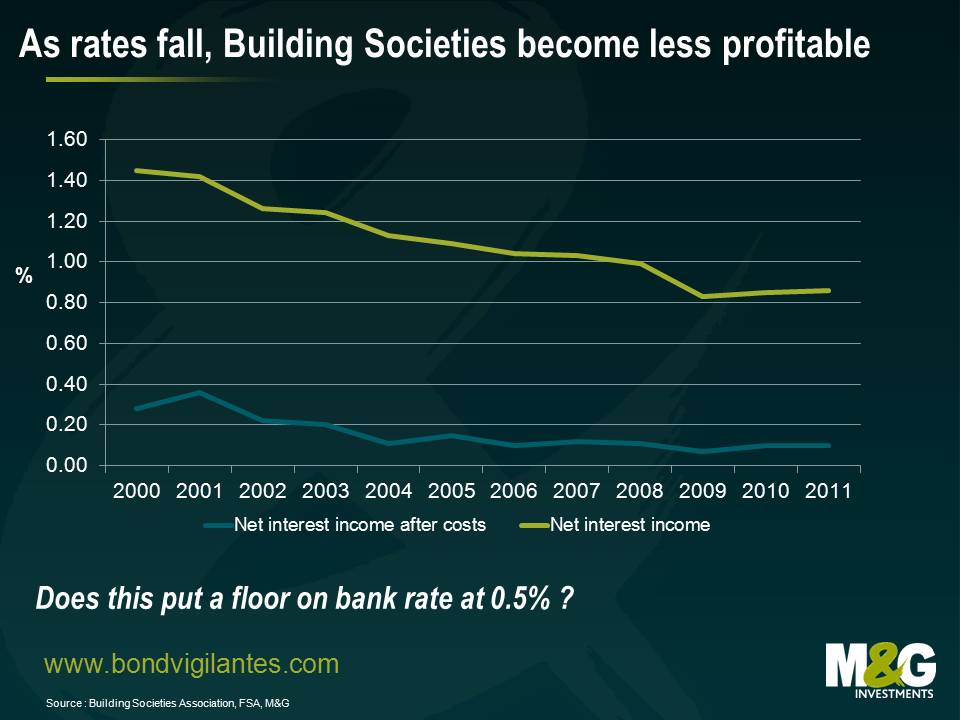
1 You can’t cut bank rate in the UK because you hit the building societies.
Easy right, you fly over, cut rates and give a small but welcome boost to the economy. But bank rate has been stuck at 0.5% since early 2009, through double dip recessions and increases in Quantitative Easing. There is clearly scope to cut towards zero (like the Fed) and this would clearly have some benefit to consumers and companies who have mortgages and loans linked to base rate, or Libor. But the Bank has repeatedly rejected calls to cut from here – not because those benefits might be modest (although that was a line at one point) but because the building societies might well become loss making if further cuts were made. And we need our building societies – as banks’ appetite to lend has fallen, the societies now provide 22% of gross mortgage lending compared with 13% in 2009. Why do the societies get hit disproportionately by lower bank rate? The first problem is the amount of tracker mortgages that they sold historically, where homeowners pay interest explicitly based on a bank rate plus (and in some cases MINUS) basis, so revenues fall as rates fall. And at the same time the societies have very little share of the current account market, so to fund mortgage lending they rely on having market leading savings rates to raise deposits. In recent years much of this has been done on a fixed rate basis. The chart below shows that net interest income as a percentage of assets has been falling steadily as bank rate fell from 5.5% to 0.5% over that period. Once costs are taken out (the “net of costs” margin is shown in blue) there is little room for revenues to fall before the sector becomes loss making. As for negative bank rate (mentioned by Paul Tucker as being “unlikely…but we should think about all sorts of things”), that would be even more harmful.
2 You can’t target a weaker £ because the impact on consumption is higher than the boost to manufacturing.
A competitive devaluation of the pound would lead to a windfall for our manufacturing economy as exports become cheaper. Contrary to urban myth and legend, we do make stuff (manufacturing is 12% of the economy and the UK is good at making cars, jet engines, chemicals and military hardware). Carney could use Open Mouth Policy to talk down our Winston Churchill branded currency (slogan “I have nothing to offer but blood, toil, tears and sweat”), or failing that intervene by printing pounds and selling them to buy foreign currencies. We could even end up with our own Sovereign Wealth Fund! Again there is a “but”. It feels like the Bank of England already tried this, and realised that it wasn’t going to work – trade weighted Sterling fell by 7% in January and February this year before Mervyn King stated that “we’re certainly not looking to push sterling down…we’re moving to a properly valued exchange rate. I think we’re probably there”. The problem is that whilst manufacturing is important, consumption is much more so. Morgan Stanley research shows that contrary to popular opinion, UK manufacturing barely benefits from declines in the pound. And rising import prices as a result of a weaker pound mean that inflation rises, which means that real incomes fall, which means that consumption falls. And as the consumption impact is greater than the manufacturing boost impact (negligible), the impact of a weaker pound on the UK economy is negative.
3 You may be the boss, but the only power is in voting last and thus having a deciding vote.
And right now 6 out of the 9 MPC members don’t want to do more monetary stimulus. You could be in the minority forever, although a prudent Governor probably realises that this kind of split might be damaging for perceptions of stability – not what you want when foreigners are net buyers of on average £6 billion gilts every month. The Canadian monetary policy framework is based on “consensus” rather than voting – my gut feel is that this delivers more power to senior Council members in comparison to a straight vote.
4 If there was a chance to review the Bank of England’s remit from the government to make it significantly more pro-growth, it may have gone.
In the March Budget, George Osborne set out a new remit: “the new remit explicitly tasks the MPC with setting out clearly the trade-offs it has made in deciding how long it will be before inflation returns to target”. He is also changing the timing of the exchange of letters between Chancellor and Governor when the inflation target is breached. And he asked the Bank to review its communications policy (it “may wish” to provide forward guidance). But Osborne didn’t wait for Carney to arrive before changing the remit and given the market’s expectations of a much more pro-growth Governor arriving (helped by Carney’s Nominal GDP speech to the CFA Society of Canada in December), these remit changes feel modest. Perhaps the only hope for a more radical Bank comes with that potential change in communications strategy – does that open the way for statements linking future rate hikes to sustained GDP growth rather than just inflation changes?
5 And finally, the UK is not Canada.
Our banks are broken (Canada didn’t even have an official bailout during the credit crisis, although some speculate there was significant support through the state mortgage agency the CMHA). Our biggest trading partner is broken (Canada’s biggest export market is the US, which is far stronger than the Eurozone). Our natural resources are in decline (North Sea oil is producing 1.5 million barrels per day compared with 4.5 million in 1999; Canada is the world’s largest uranium and hydro-electricity producer, and the world’s fifth largest energy producer in total). And most importantly Canada had its fiscal crisis in the 1990s. S&P cut it from AAA to AA+ in 1992 triggering a consensus amongst politicians to reduce the national debt burden. Debt/GDP peaked in 1996 at around 70%, and by 2002 Canada was AAA/Aaa again. The UK is in a very different economic position, and one with substantially greater fiscal headwinds than those experienced by Mark Carney during his time in charge of Canada’s central bank.
But it’s not all bad news. Although there are clear limits to what Mark Carney will be able to do, he might have luck on his side when it comes to timing. To quote Deputy Governor Paul Tucker, who spoke last night, “looking over the past year (the UK economy is) perhaps not as bad as the headline figures suggest…I think there’s a long way to go but there’s certainly reason for hope”.


Sign up to the Bond Vigilantes mailing list to ensure you never miss a great article from our expert Bloggers. We will email all new articles to your inbox, meaning you can stay on top of the world of Bonds.
I confirm that I would like to receive information about Bond Vigilantes and products and services from M&G Securities Limited.
We will use the email address and personal data you have shared with us to send you this information. For existing customers, submitting your contact details and requesting to receive this information from us, will replace any earlier choices you have made in respect of marketing information.
You can unsubscribe from marketing at any time, at which point we will not send any further marketing information to you, by selecting the unsubscribe link in all communications.


