
Rolldown
A dispatch from the number crunchers – Yield curve rolldown
By Matthew Russell
15 April 2026

On Friday last week, EM debt funds saw a daily outflow of $1.27bn, which equalled the record set during the dark days of September 2011, a time when the Eurozone periphery and the ECB were particularly active bungee jumping down a precipice. Outflows were even bigger on Monday this week, as EM debt funds were hit by $1.44bn in outflows. The fact that Monday saw a daily record wasn’t much of a surprise; markets were violent, even by recent standards, with some Turkish bank bonds down 10% intraday at one point. Outflows were a slightly less bad $1.07bn on Tuesday this week (the most recent data available), but that’s still $3.78bn of EM debt fund outflows in just three days.
The chart below plots the year to date daily flows in US high yield and EM debt, courtesy of EPFR. Note that this data is for mutual funds only and doesn’t include flows from insurance companies, central banks etc, so while it gives you an idea of how grim the picture looks, it’s perhaps only 10% of the whole picture. Note also that the EM debt asset class is significantly bigger than it was just two years ago thanks to a huge amount of debt issuance, meaning that although Monday saw a record outflow in absolute terms, it actually ranked number four relative to the size of the market.
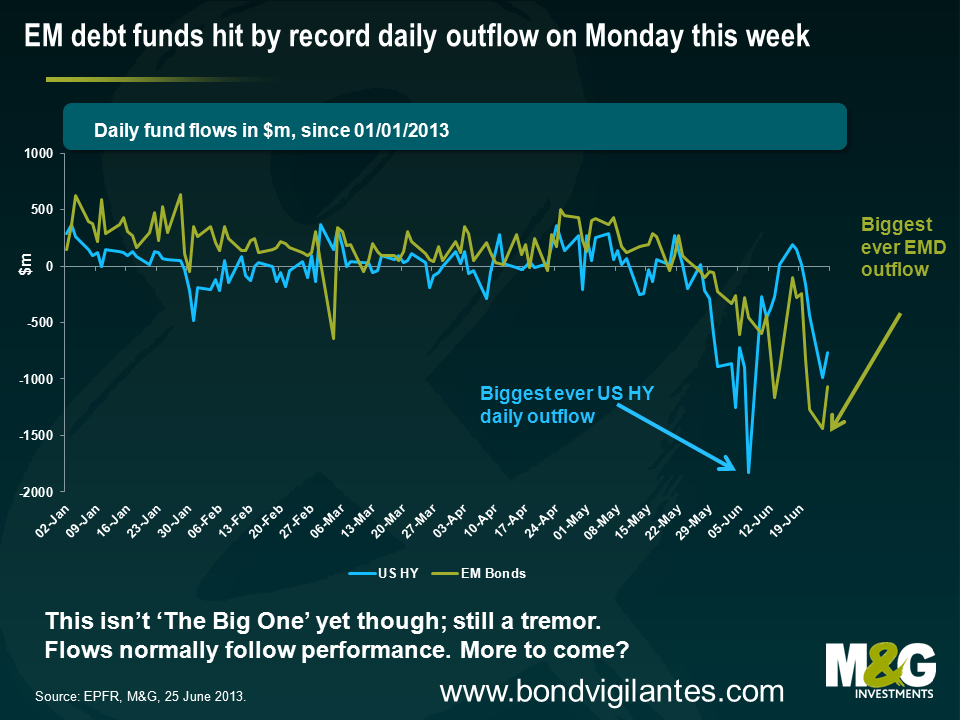
Do the outflows matter? EM debt bulls might argue no – fund flows tend to lag market performance and flows have historically had little if any predictive power in forecasting future returns. The collective human instinct is always to buy at the top and sell at the bottom, and the losses in EM assets in the last seven weeks told you the outflows were coming. Bulls might also argue it is comforting that EM debt outflows haven’t actually been bigger. EM debt has seen the biggest drawdown since Q4 2008 – in the last 7 weeks the JP Morgan GBI-EM Index, a commonly used EM local currency sovereign debt index, has plummeted 13%, and the JP Morgan EMBI Global diversified index, a widely used EM sovereign external debt benchmark, has fallen over 10%. Real money investors aren’t yet capitulating, which suggests that the huge inflows of the last few years are relatively sticky.
EM debt bears might look at it another way – in the context of the enormous inflows into EM debt in the last four years in particular, outflows haven’t actually been that huge, and yet returns have been abysmal. One of the unintended consequences of much tighter bank regulation and balance sheet deleveraging is that market markers have reduced ability to warehouse risk, so relatively small changes in EM debt fund flow dynamics are causing far greater swings in market prices. If outflows continue at this pace or worsen, then the effect on EM debt will likely be cataclysmic.
Are these outflows just a tremor, or are we witnessing ‘The Big One’? To begin to attempt to answer that, it’s necessary to figure out what has caused such a violent sell off. About a year ago I tried to explain that the reasons most people seem to buy EM debt – strong growth, good demographics, low government debt levels, an ‘under-owned asset class’ – are broadly irrelevant. Thailand and Malaysia had great demographics in the mid 1990s, but that didn’t prevent the Asian financial crisis. Ireland and Spain had very little government indebtedness prior to 2008, but that didn’t help much either. EM debt returns are instead largely a function of US Treasury yields, the US dollar, and global risk appetite, where the mix varies depending upon whether you’re looking at EM local currency debt, or EM external sovereign or corporate debt (see Emerging market debt is cool but you may be surprised what you find if you strip away the marketing myths for more).
The recent EM debt sell off appears to justify this view of the primary drivers of EM debt returns. Market commentators’ explanation for the recent leg down in EM debt is Bernanke’s tapering talk, and this is clearly a factor. Treasury yields have jumped, the US dollar has soared, and EM currencies have mostly slumped. This is something that we had anticipated and were positioned for as explained in January, see Why we love the US Dollar and worry about EM currencies.
If you assume this EM debt sell off has all been about Fed speak, then I’d actually be much more comfortable about EM debt valuations now. EM bond yields have risen significantly faster than US Treasury yields, while EM currencies have generally fallen sharply, so EM debt valuations are obviously relatively more attractive now versus two months ago. At the time of writing back in January, 10 year US Treasury yields were 1.8% and we believed they looked ripe for a correction. Now, however, yields are above 2.5%, and yet the solid but unspectacular trajectory of the US economy hasn’t really changed that much. Meanwhile US inflation expectations have in fact fallen considerably – for example the US 5 year 5 year forward breakeven inflation rate has slumped from 3% to 2.4%. Jim discussed the US economy following a research trip in a blog earlier this month, see While the market gets excited about unemployment falling to 6.5%, the Fed’s attention is turning to falling inflation.
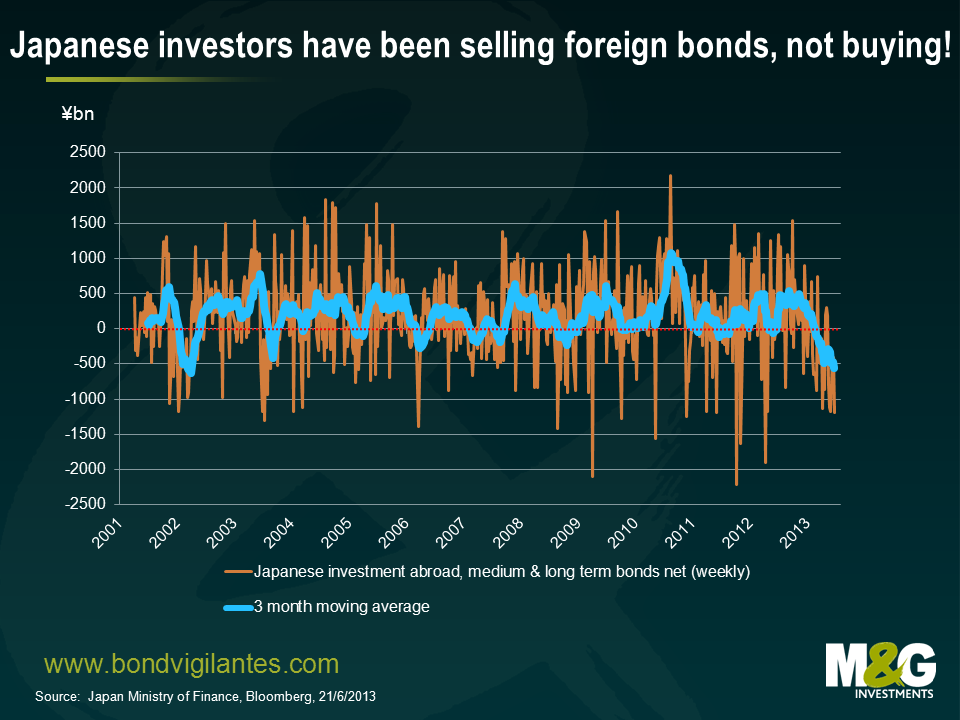
However, the recent EM debt move is unlikely to be all about Fed speak. EM debt has been a stand out underperformer in the great carry sell off of the last two months, and dynamics in Japan and China are surely also important. I believe that the behaviour of domestic Japanese investors is playing a greatly under-appreciated role. In the early days and months of the much hyped but so far little-achieving ‘Abenomics’, every man, his dog, and his dog’s unborn puppies seemed to have gone long USD, short JPY, long risky assets and particularly long EM debt. Some did it in a very leveraged way, and these trades have been a disaster since the beginning of May. As mentioned in a blog a month ago, Japanese investors have in fact done the precise opposite of what every market participant seemed to think they would do. Below is an updated chart from a blog last month (see Japanese investors are not buying foreign bonds, they’re selling). Japanese selling of foreign bonds has accelerated further recently, with the announcement overnight that there were ¥1.2 trillion of sales alone during the week to June 21st. Taking a rolling three month average, Japanese investors are selling foreign bonds at a near record pace.
It is the China dynamic that I find particularly worrying. Commentators have focused on the drying up of Chinese inter-bank liquidity as demonstrated by spiking SHIBOR rates, although I think fears are overblown. There is much speculation as to why SHIBOR has soared, the only additional observation I have is that spikes in SHIBOR are nothing new – I wrote a brief comment about a previous episode in January 2011, see funny goings on in Chinese banking sector. There was a near replica of the current SHIBOR spike exactly two years ago, and while the SHIBOR moves this time around are particularly big, it’s hard to see why this time it’s different and the PBOC won’t supply liquidity.
A much bigger longer term China worry is that market participants still believe that China can grow at 7%+ ad infinitum, but I can’t see any scenario under which this is actually possible. China’s wages have doubled since 2007 and its currency has appreciated 25% against the euro and 35% against the US dollar (based on spot return) since China dropped its peg in 2005. Competitiveness has therefore significantly weakened. Intentionally or unintentionally, the Chinese authorities have tried to hit an unsustainable growth target by generating one of the biggest credit bubbles that the world has ever seen. If you add that an enormous demographic time bomb is starting to go off in China (eg see article from The Economist here), China’s long term sustainable growth must be considerably lower than consensus expectations. Some believe the Renminbi’s destiny is to become a currency to rival the US dollar. I think it’s more likely that opening up the capital account will encourage big capital outflows as domestic investors seek superior investment returns abroad (as an aside, Diaz-Alejandro’s paper Goodbye Financial Repression, Hello Financial Crash offers some background on Latin America’s experience with financial liberalisation in the 1970s and 1980s).
My central thesis remains, therefore, that China will experience a significant slowdown in the coming months and years and this will have profound effects for global financial markets and EM debt in particular. If you like clichés, China is in effect ‘turning Japanese’, but unlike Japan, it has grown old before it has grown rich. Rather than regurgitate the arguments, see blog from March (If china’s economy rebalances and growth slows, as it surely must, then who’s screwed?). I continue to believe that EM and developed countries with a heavy reliance on exporting commodities to China are vulnerable, countries that are increasingly reliant on portfolio inflows from developed countries to fund their current account deficits are vulnerable, and those countries that tick both boxes (eg Australia, South Africa, Indonesia, Chile, Brazil) are acutely vulnerable.
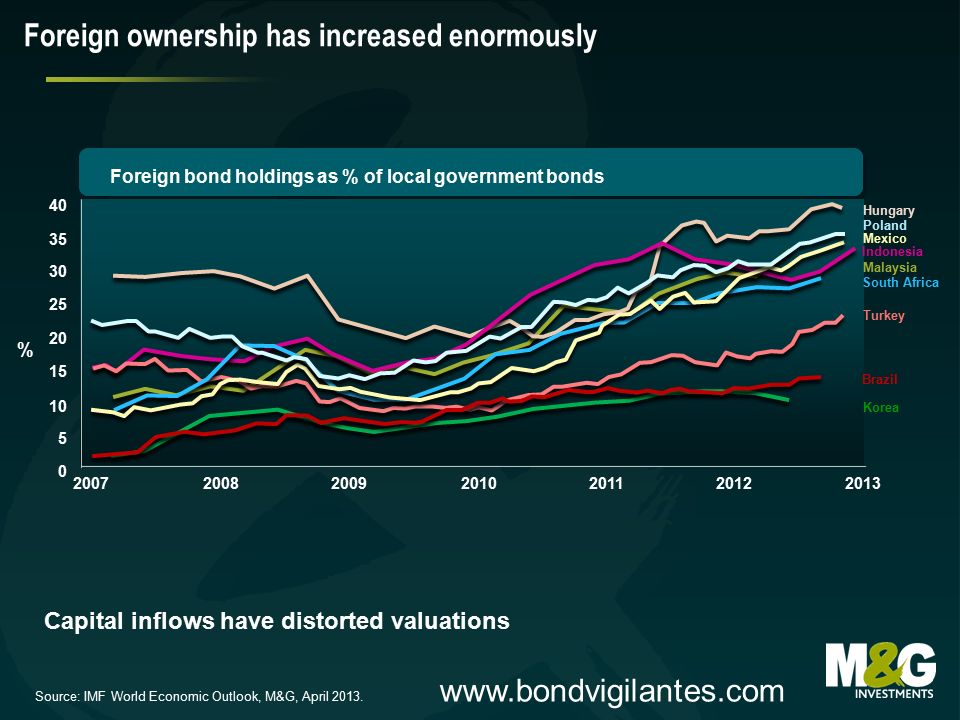
In sum, EM debt now offers relatively better value than a few months ago, and it therefore makes sense to be less bearish on an asset class that we have long argued has been in a bubble. That doesn’t mean I’m bullish. The arguments put forward in September 2011 (see The new big short – EM debt, not so safe) are more valid now than ever. Foreign ownership of many EM countries’ bond markets has climbed higher (see chart below), and the EM debt outflows of the past few weeks are a pimple on an elephant’s derriere in relation to the decade-long inflows. These inflows were initially driven by US investors fleeing the steadily depreciating US dollar, and more recently driven by European investors looking to park money outside the Eurozone. Following the recent sell off, the vast majority of investors who have piled into EM debt in the last three years are underwater, and it will be interesting to see how they react.
The recent EM debt sell off probably isn’t yet ‘The Big One’, it is more a tremor. ‘The Big One’ will probably need either US growth and inflation surprising considerably to the upside or China surprising to the downside. If that happens then EM debt could really rumble, and these eventualities still don’t seem to be remotely priced in. It will take a much bigger sell off in EM debt, and specifically much higher real bond yields, before I’d turn outright bullish on EM debt and EM currencies. Developed markets and specifically US dollar assets appear more likely to appreciate, and it’s ominous that previous periods of US dollar strength (1978-1985, 1995-2002) have been coupled with EM crises.
Today we have launched the M&G YouGov Inflation Expectations Survey with the aim of assessing consumers’ expectations of inflation over the short and medium term. There has never been a better time to gauge the views of consumers, with interest rates at multi-century lows, central bankers waist-deep in the experiment of quantitative easing and politicians wavering on whether or not austerity is the right thing to do. The report is available here.
Surveys of consumers’ inflation expectations are now a key component of monetary policy and there are a few in existence. However, our survey differs from existing surveys of consumer inflation expectations in a number of fundamental ways.
Firstly, it is the main survey of its kind to ask a consistent set of six questions to consumers in nine different countries across Asia and Europe. In total 8,000 consumers are surveyed on a quarterly basis by YouGov, the online market research company, in order to get timely and highly relevant results. Our consumer panels are weighted and are representative of the entire adult population of the country surveyed.
Secondly, by surveying consumers across the UK, Austria, France, Germany, Hong Kong, Italy, Singapore, Spain and Switzerland, policy makers and investors alike will be able to analyse how inflation expectations are changing over time across nine different countries. Importantly, the survey will also give a good indication of whether inflation expectations are becoming unanchored. If they are it could trigger changes in the nominal exchange rate, affect consumption and investment decisions, as well as wages and prices, and could cause inflation to persist above the target for longer than the central bank expects.
Finally, we have used best practice developed by the Federal Reserve Bank of New York in determining how we ask consumers about their inflation expectations. In late 2006, the Federal Reserve Bank of New York joined academic economists and psychologists from Carnegie Mellon University to assess the feasibility of improving survey-based measures of consumers’ inflation and wage expectations. The results of this project were announced in 2010 and can be viewed here. Interestingly, academic researchers found that there were a number of limitations in existing surveys.
For example, the Reuters/University of Michigan Survey of Consumers asks respondents to forecast changes in “prices in general” rather than changes in the “rate of inflation.” This wording, the researchers suggest, invites diverse interpretations and prompts many respondents to focus on price changes specific to their own experience rather than changes in the overall price level.
To address this limitation, the M&G YouGov Inflation Expectations Survey asks respondents to report their expectations for the annual rate of inflation in one year and five years from now rather than ask about prices in general. We also question respondents on whether rising inflation is a concern at the moment, how they think their net income will change in 12 months’ time, whether or not their central bank is pursuing the correct policies to meet its target of price stability, and whether their government is following the right economic policy. Importantly, this should allow us to gauge the public’s perception towards the credibility of central banks and governments.
The initial findings of the survey are shown below. The next report will be available in September.
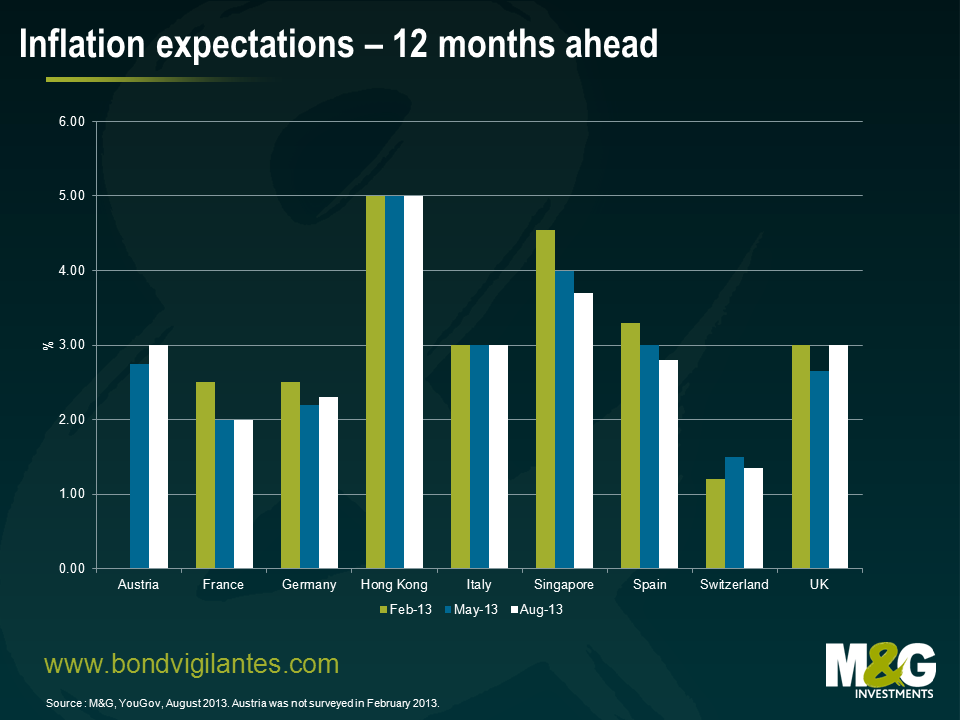
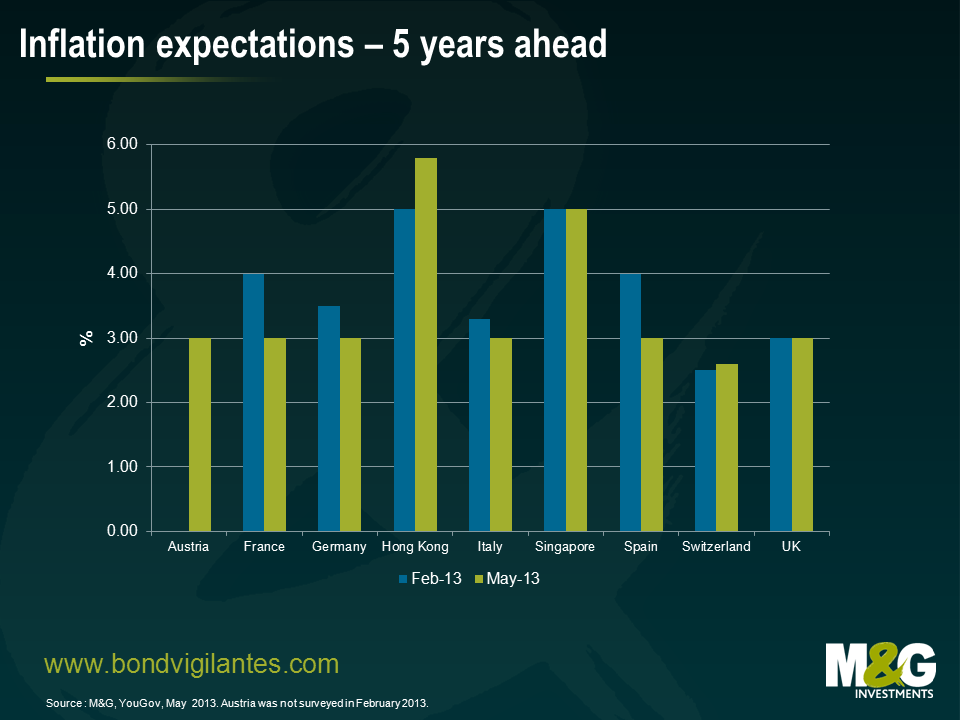
The results of the May 2013 M&G YouGov Inflation Expectations Survey suggest that consumers in most countries surveyed expect inflation to be elevated above current levels in both one and five years’ time. In the UK, inflation is expected to be above the Bank of England’s CPI target of 2.0% on a one- and five-year ahead basis. All European Monetary Union (EMU) countries surveyed expect inflation to be equal to or higher than the European Central Bank’s CPI target of 2.0% on a one- and five-year ahead basis. All countries expect inflation to be higher in five years than currently, while four – Hong Kong, Italy, Singapore and Spain – anticipate it being equal to or higher than 3.0% in a year. Encouragingly, there are some signs of short and medium term inflation expectations falling from the levels reported in February in some countries.
We think that this report will be vital reading for central bankers, particularly as a time series is built up over the next couple of years which will allow us to monitor trends that may be developing. Ben Bernanke, Mark Carney, and Mario Draghi are all on the record stating how important inflation expectations are in achieving price stability and the economic benefits that go with it. It will also be highly relevant for both consumers and markets alike, particularly in a world where Central Bank Regime Change – where debt and unemployment rates become more important to central banks than inflation targets and price stability – is likely to occur. We aren’t there yet, but initiatives like the M&G YouGov Inflation Expectations Survey may be the bellwether that signals inflation expectations are becoming unanchored. And when that occurs, that is when central banks will face one of their toughest tests – trying to maintain their inflation-fighting credibility.
I spent a couple of days in New York last week seeing economists and academics. The US Treasury market had just seen a significant sell-off, with 10 year yields rising from 1.63% at the start of May, to over 2.2%, with much of the damage done by Bernanke’s surprise talk of QE tapering during the Q&A following his address to Congress’s Joint Economic Committee. US 30 year mortgage rates sold off in parallel, and are now around 4%, potentially damaging the housing recovery.
I came away with two main conclusions. Firstly, given the stuttering nature of the US growth recovery (and the second half of this year could be mediocre, thanks to some back-loading of fiscal cliff tightening) the case for a slowing of QE in the next few months is not at all strong. Economists point out that Bernanke’s prepared testimony to the JEC was very dovish and in no way suggested that tapering might happen this year. His Q&A response appears to have been a communication error, as evidenced by some rolling back over the last couple of days via well connected journalist Jon Hilsenrath in the Wall Street Journal. And secondly, whilst we all focus on the jobs data in the States and try to forecast the timing of hitting the 6.5% unemployment rate threshold, we might be taking our eyes off the Fed’s other concern, inflation. Having spiked higher in 2011/2012, thanks largely to higher commodity prices (cotton, oil), core inflation measures, and particularly the Fed’s preferred Core PCE Deflator statistic, are falling to around 1%. Wage growth is also weak. With inflation 1% below the target level, a Taylor Rule approach would see the Fed easing interest rates by 1.5%, not hiking or withdrawing monetary stimulus! And with rates at the zero bound and a cut impossible, unconventional monetary policy would have to take the strain. More, not less, QE might be more likely than any tapering.
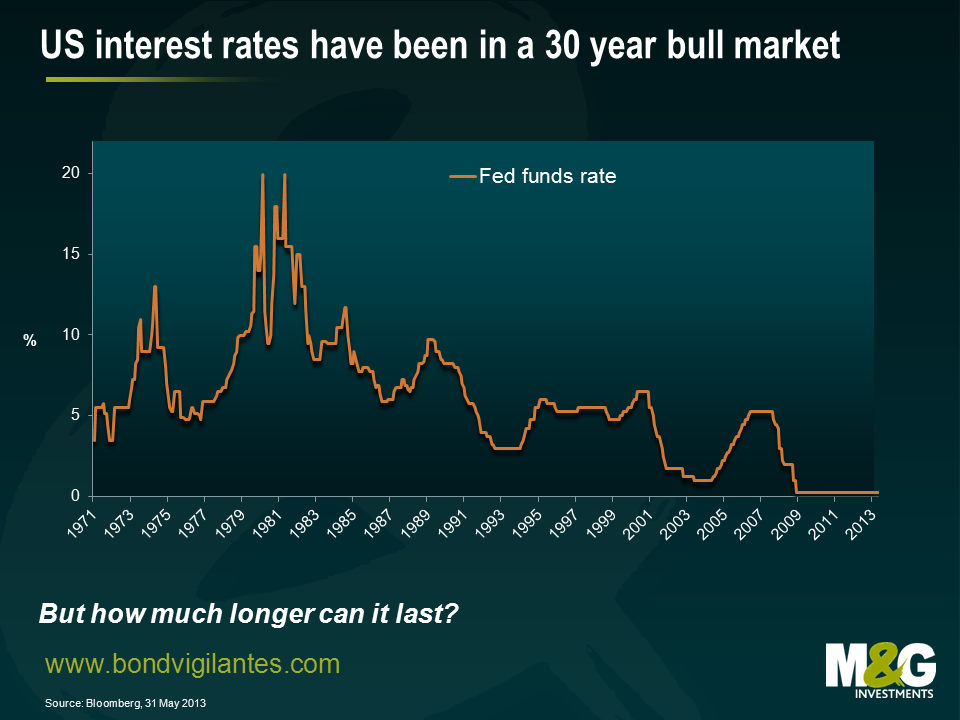
The punch bowl of easy money that the US Federal Reserve has offered the market has been significant over the last 5 years: from low rates, to quantitative easing and benign regulation. The purpose of the party was to keep animal spirits high and prevent the gloomy cycle of recession from turning into depression. This generosity has been mirrored around the world in different guises, and so far the policy has worked with varying degrees of success. The net effect has been to avoid economic depression.
Low interest rates and deficit spending have worked in the USA. The two charts below show the long term trend in US interest rates (wow what a party!) and the trend in unemployment, with the annotations showing how long after the peak in unemployment the Fed waited before hiking rates. This time around, not only has the volume of liquidity that has been served been record breaking, but the extent of the party, in terms of how long we have been sitting at the bar enjoying ourselves, has been remarkable compared to other cycles. Unwinding this is obviously going to pose some challenges.
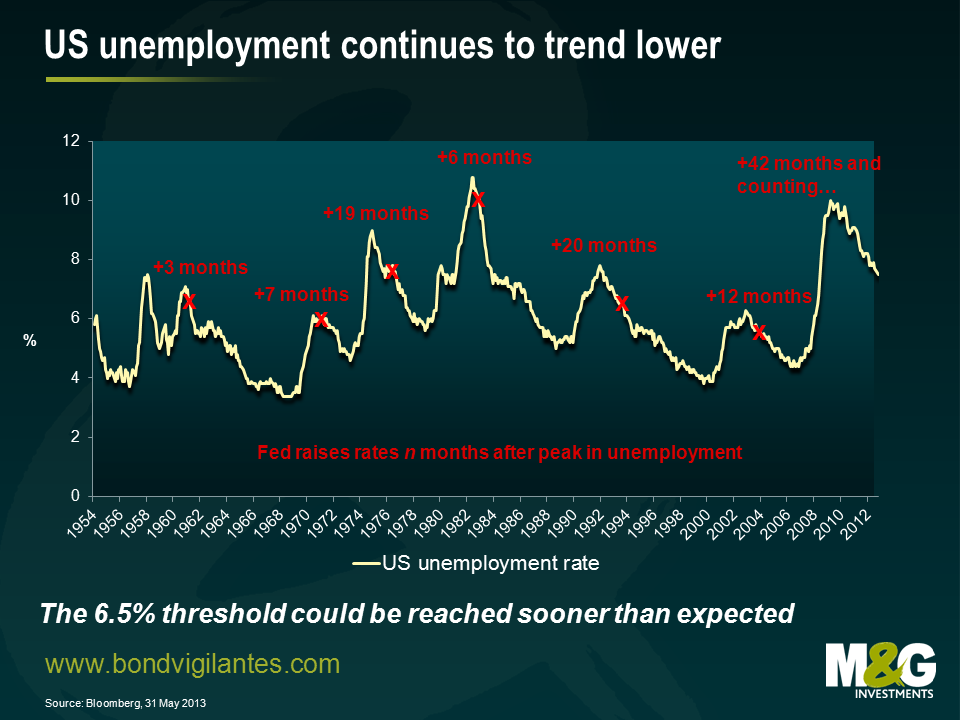
Barman Ben Bernanke realises he is faced with this problem, as depression is now highly unlikely in his neighbourhood. The financial system is functioning, the housing market is in a new bull market, and unemployment is on a firm downtrend. The futures market is currently discounting the first rate hike from the Fed in early 2016, but growth could easily come in stronger than expected given the rebound in the housing market, which could also reduce unemployment faster than people anticipate (see Jim’s blog here for a discussion of how powerful the housing effect could be). So there’s a real risk that the Fed will have to move before the market expects. The attached chart shows that according to Unicredit, given the average pace of payroll gains over the past 6 months, the unemployment threshold could be reached as early as mid 2014, and possibly sooner if the housing market continues to strengthen.

Given the jittery moves in the markets over the past couple of weeks on talk of tapering QE, Bernanke needs to decide how to wind down the party he has generously hosted, with the minimum of damage.
He does not want to upset his customers (the markets) too much, as the chaos that can ensue when a crowd of drunks is thrown out onto the street is never pleasant. He needs to gently guide his customers genially to the door.
This in effect is what Fed speak is currently doing. The Fed knows the economy is on a sound footing and that it needs to take some of the financial stimulus away. It is basically saying thanks for your custom, please finish up your drinks and leave the bar. And like any fine host, the Fed pats its drunk customers on the back and promises they will reopen tomorrow so the customer leaves smiling and hopeful.
Time gentleman, please.


Sign up to the Bond Vigilantes mailing list to ensure you never miss a great article from our expert Bloggers. We will email all new articles to your inbox, meaning you can stay on top of the world of Bonds.
I confirm that I would like to receive information about Bond Vigilantes and products and services from M&G Securities Limited.
We will use the email address and personal data you have shared with us to send you this information. For existing customers, submitting your contact details and requesting to receive this information from us, will replace any earlier choices you have made in respect of marketing information.
You can unsubscribe from marketing at any time, at which point we will not send any further marketing information to you, by selecting the unsubscribe link in all communications.


