
Rolldown
A dispatch from the number crunchers – Yield curve rolldown
By Matthew Russell
15 April 2026

2013 has offered another injection of both adrenaline and performance to fixed income investors. A rapid sell-off shook emerging markets just before the summer while the Fed was conducting a “tapering yes/tapering no” ballet that lasted for more than six months. European peripheral countries finally came out of recession, although unemployment levels remain alarmingly high. In parallel, global high yield markets delivered further stellar performance, while Japan started to feel the effects of the unprecedented monetary and fiscal revolution driven by Shinzō Abe.
However, a common theme clearly emerged: the developed economies appear to be finally growing at a reasonable pace. Markets largely normalised as volatility and correlations returned to pre-crisis levels. While central bank intervention (set to continue for some time) has been the mantra in a liquidity driven environment, the world is transitioning back towards a growth based model. The US is well positioned to lead the pack, although high debt levels in Europe may continue to leave governments with limited room to support the recovery via fiscal stimulus. However, the good news here comes from a healing and deleveraging banking system, as well as rock solid support and a clear accommodative stance by the ECB and its leader Super Mario Draghi.
In this context, many fixed income asset classes offered satisfactory returns. Which assets have been top performers? The results are surprising. Who would have said, back in January 2013, that – together with a new Pope from Argentina, China landing on the moon and an economic bailout in Cyprus – Spanish “Bonos” would have offered total returns in excess of 11% YTD, for example? Let’s take a closer look at government bonds, corporate bonds and major currencies compared to the US dollar (all total return YTD figures are measured from 31 December 2012 to 17 December 2013 in local currency).
Government bonds
Risk-free government bonds have been negatively affected by expectations over rising rates and tapering uncertainty. The UK gilts index – with an average duration of over 9 years – has been the most negatively hit, followed by US Treasuries (5+ years duration) and finally by less volatile German bunds (6+ years). It was a different story for some countries in the European periphery, where Greek government bonds offered tremendous total returns above 50%, followed by Spanish and Italian sovereign debt. Following the May debacle, emerging market government bonds in hard currency (measured by the commonly used JPM EMBI Index) took a significant hit and offered a negative return below 6%, despite a decent rebound after the summer, while the local currency index (JPM GBI-EM) looks set to end the year broadly flat (while once translated in USD, it is negative by around 8%)
Following 2012’s fall from grace for linkers, due to both falling inflation expectations and very low inflation in Europe and US, 2013 has continued to see the US, European and EM markets negatively affected while the UK market is about to close in a marginally positive territory thanks partly to the decision to maintain the link to RPI earlier this year (here’s a blog from Ben on the topic).

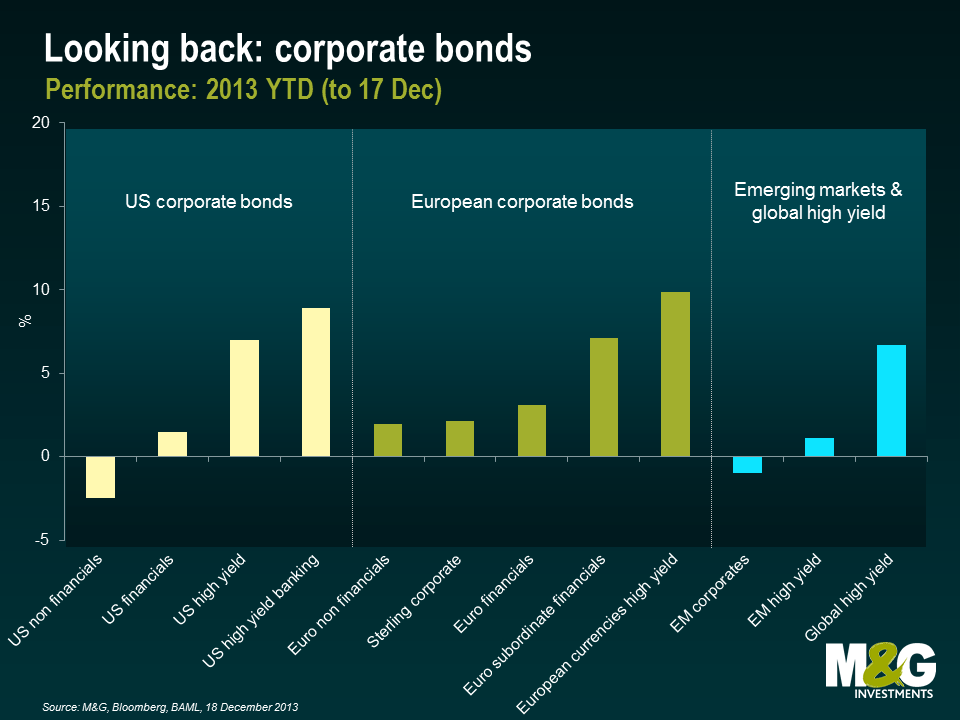
Corporate bonds
A great degree of value over the past year was to be found in corporate bonds. Companies are benefitting from the broad-based economic recovery around the developed world and from the subsequent increase in consumer demand (higher consumption = higher corporate revenues) and public investments. A conservative management of financial resources and balance sheets by bond issuers on average (especially in Europe), improving economic prospects, forward guidance on interest rates and a low inflation environment have all supported the ride of corporate bonds. Names active in the high yield space – especially in the US and Europe – have been amongst the standout performers within credit. Financials have also had a very strong run, especially in the subordinate space, helped by a healthy investor demand for higher yielding and more cyclical paper, as well as a general financial deleveraging process that is going in the right direction to restructure their balance sheets.
Performance highlights include European high yield (+9.9%), European subordinated financials and US high yield banking (+7.1% and +8.9% respectively) and an overall good showing from BBB non-financial corporates in Europe (+4.4%, to compare against -0.8% in the US). Emerging market corporate debt was in negative territory overall (-1.0%), while the high yield portion was marginally positive (+1.1%).
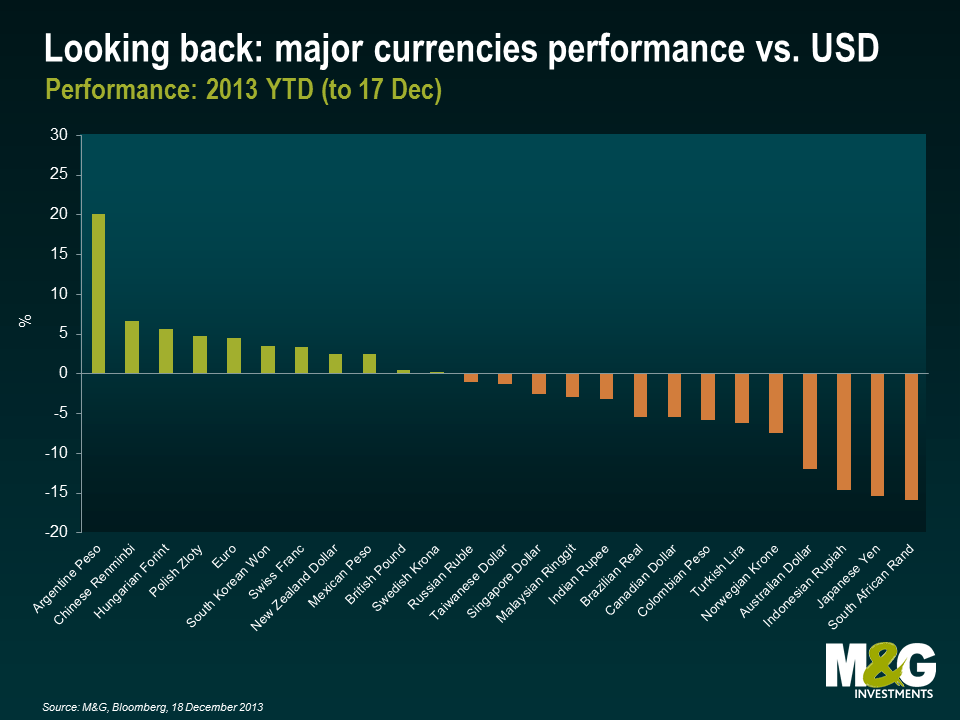
Currencies
The most noticeable development amongst major currencies has been a general lack of excitement around the US dollar from global investors, probably due to the ongoing tapering tantrum together with fears around the US fiscal cliff and the recent government shutdown. The USD index (DXY in Bloomberg) has generated a rather lacklustre performance of +0.4% YTD. We need to make a clear distinction between two separate trends this year: the index generated positive returns for around 6% between January and early July, while it lost ground in the second part of the year (around -5.6%) due to uncertainties around the US government shutdown and Fed’s decision to maintain loose monetary policy. However, today the US economy is growing, its current account deficit is decreasing, the nation is moving towards energy independence, and Fed policy is now clearer following its tapering announcement on 18 December: we strongly believe that US dollar is good value and is set for a strong rebound.
Amongst G10 currencies, the Euro and GBP have gained significant value over the USD in recent months. Thanks to surprisingly strong economic developments in both the UK and the Eurozone, sterling and the euro have been amongst the best performing global currencies between March and December. Stay tuned on the British pound, because the UK’s 5.1% current account deficit in Q3 is the 3rd is the worst in UK history (and worse than Indonesia, India and Brazil). This suggests that there is no sign of the UK economy rebalancing and the UK’s economic recovery in its current form is nowhere near as sustainable as the US recovery.
The Japanese Yen has lost significant value (-15.4%) versus the US dollar due to the fresh efforts of the Bank of Japan to create inflation (and nominal growth) in the country. Some emerging market currencies offered strong performance, including the Argentine peso, Chinese Renminbi, Hungarian Forint, Polish Zloty, and Mexican peso, but the majority of EMFX has underperformed the US dollar, notably the Brazilian real, Indonesian Rupiah or South African rand, with the latter being the only currency to return less than the Yen at the time of writing.
In conclusion, who would have expected such an interesting ride for fixed income asset classes this year? What is going to happen in 2014? Will next year be a negative or positive one for financial markets, and fixed income specifically? Read our latest Panoramic here and continue to stay tuned to this blog, explore recent posts (here from Ben, here from Mike and here from myself) and read more in the upcoming weeks.
Before saying goodbye, let me ask you something related to the Chinese calendar. The Year of the Snake, which began on 10 February 2013, will be over at the end of January 2014. In the Chinese zodiac, the snake carries the meanings of cattiness and mystery, as well as acumen, divination and new beginnings. Do you see any fit with 2013? The new year of the Horse will start on 31 January 2014. The horse is considered energetic, bright, warm-hearted, intelligent and able. Any hint? Good luck and happy 2014!
Today I came across an article in which the Bundesbank took the festive season as an opportunity to discuss if all the Christmas sales discounts are going to turn into a permanent phenomenon for the Eurozone. “No deflation in sight” (in German) concludes that the Eurozone is unlikely to experience continuously falling prices, ie deflation. The Bundesbank does however identify some parallels between today and the 1930s – the last period of deflation in Germany. The Bundesbank attributes the current disinflationary trend in the Eurozone to the austerity imposed on the peripheral economies. It is striking that this line of argument offers the opportunity to draw some historical parallels. In the early 1930s, chancellor Brüning’s retrenchment policies (in form of emergency decrees) in response to the global economic crisis and the perceived lack of German competitiveness included severe wage cuts for civil servants, public sector job cuts, reduction of pension payments and entitlements as well as higher income taxes. These policies marked a period of severe economic downturn and deflation with major historical consequences.
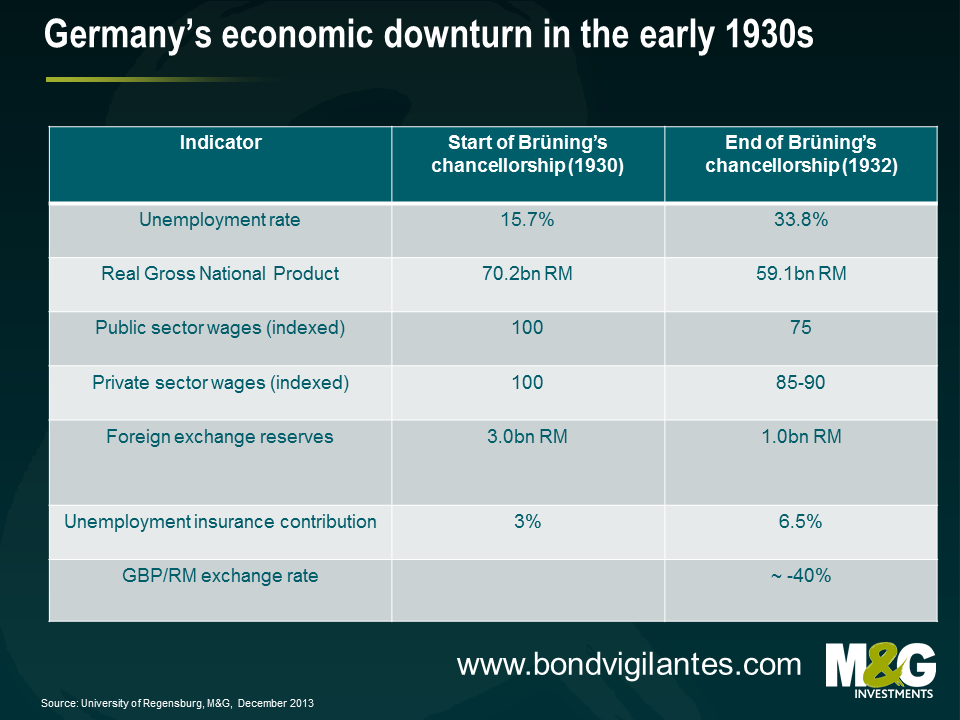
However, the Bundesbank seems to take some comfort out of the fact that the deflationary experiences in the periphery have not been as severe as in Germany in the 1930s and not sufficient to drag the entire Eurozone into a deflationary spiral so far. The German central bank anticipates that the austerity measures will show their positive effects on the peripheral economic competitiveness soon which should pay off in form of a return to modest economic growth in 2014 and 2015. While the high unemployment rates in the Eurozone, and in the periphery in particular, will continue to ease any inflationary pressure, the paper concludes that the pickup in economic activity will provide an anchor to the downside. In other words, the worst is over, and that’s why there is no deflation in sight. SocGen’s Sebastien Galy critically points out that the Bundesbank bases much of its analysis on the assumption of a strong positive correlation between growth and inflation which historically has not always been evident and doesn’t seem to be consistent with the trend of disinfloyment that the US is currently experiencing.
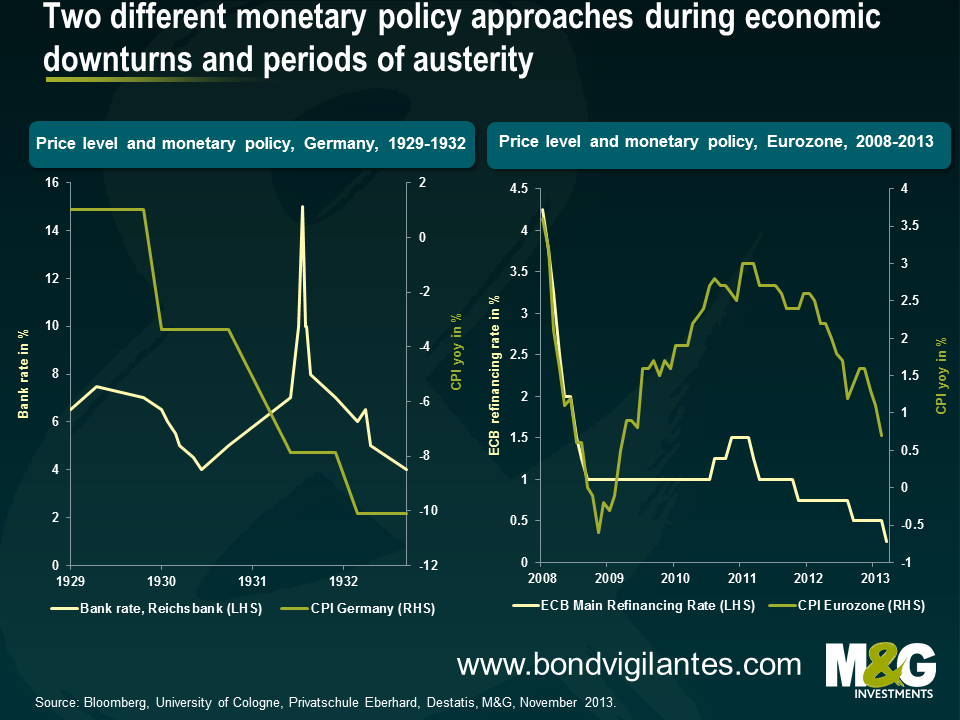
The Bundesbank also sees the deflation risk contained in the Eurozone as the ECB’s monetary policy response is very different to the 1930s. Back then, the economic downturn was aggravated through the monetary policy response of the Reichsbank. As the chart above shows, the central bank kept interest rates at a very high level which led to unbearable financing costs in the real economy and suppressed credit growth further. The reasons for this policy approach were certainly very complex, but, without delving too deep into any academic debate, it seems that the German room to manoeuvre might have been restricted by the Young Plan and that the shock of hyperinflation in the 1920s built a psychological barrier to loose monetary policy. The Bundesbank article points out that today’s monetary response by the ECB is very different. Today’s historically low ECB refinancing rate of just 0.25% is a reflection of the ECB’s very expansive monetary policy approach in response to the Eurozone crisis and is, therefore, providing another anchor of price stability, i.e. reducing the downside risk of deflation.
However, the psychology of deflation doesn’t get sufficient focus by the Bundesbank in this particular article in my view. The authors touch upon the concept of inflation expectations and their impact on consumption behaviour (if you expect prices to go down, then you delay purchases which puts further downward pressure on prices), but don’t go into much detail. As the latest M&G YouGov Inflation Expectations Survey showed, expectations were still well-anchored in November, but on a declining trend across Europe, and it will be interesting to see how inflation expectations have adjusted considering that recent data showed that not only did the periphery experience real wage declines in the third quarter, but German workers also saw real wage declines for the first time since 2009. This is certainly a surprising, if not worrying trend with regard to both disinflation and the Eurozone rebalancing efforts.
Before we get all beared up about tapering, it’s worth seeing how far we’ve come already, and what the end game should be. The sell-off in US Treasury bonds has already been severe. 10 year yields have risen from a low of 1.4% in July 2012 to nearly 3% today. Most street strategists have yields rising further in 2014, with the consensus 10 year forecast at 3.37% for a year’s time.
But as well as looking at the spot yield, we should see what the yield curve implies for future yields. The chart below shows the 10 year 10 year forward rate – in other words the expected 10 year UST yield in a decade’s time backed out mathematically by looking at long dated UST yields today. You can see that the implied 10 year yield is now over 4%, at 4.13%.
The other thing I have put on the chart is a shaded band representing the range of expectations within the Federal Open Market Committee (FOMC) for the longer run Federal Funds rate. You can find this range of expectations here on the third slide of the charts from yesterday’s FOMC minutes. Four members think that that the long run Fed Funds rate is as low as 3.5%, and two think it is as high as 4.25%. The median expectation is 4%.
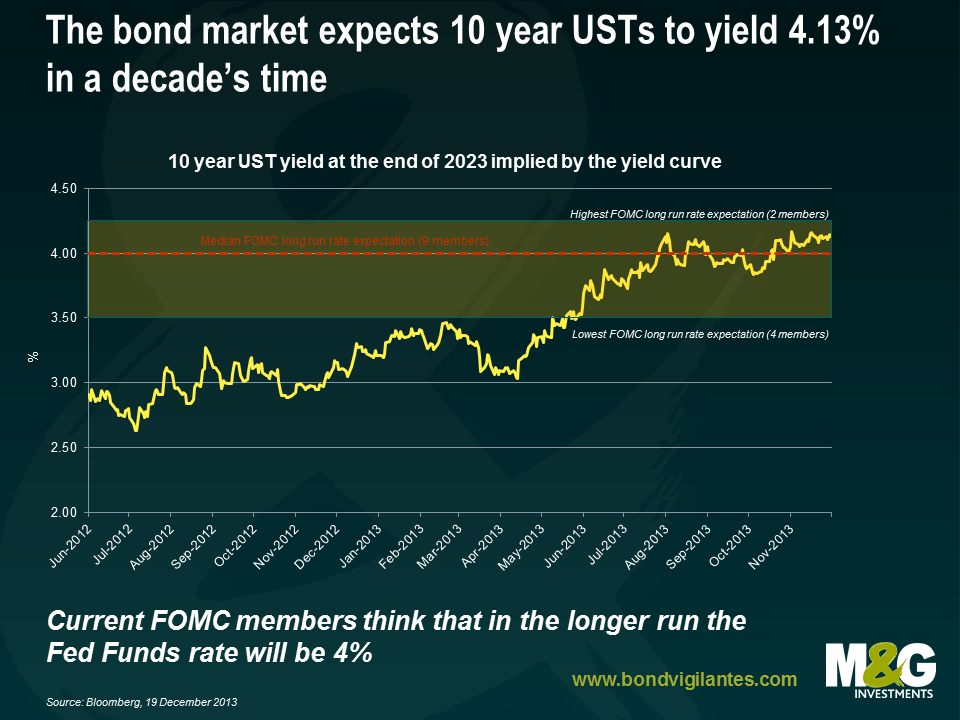
Now the 10 year bond yield is effectively the compounded sum of all short rates out to 10 years, plus or minus the term premium (which we will discuss in a minute). If the FOMC members are correct that 4% is the long run interest rate, then if the term premium is zero, the 10 year forward rate at 4.13% has already overshot where it needs to be, and we should be closing out our short duration positions in the US bond markets.
The term premium is important though (this blog from Simon Taylor is good at explaining what it is, and showing some estimates). The term premium is compensation for the uncertainty about the short rate forecast. Historically it has been positive, as you might expect, reflecting future inflation or downgrade risks. In recent years though it has been negligible, even negative – perhaps due to a non-price sensitive buyer in the market (the Fed through QE), but also perhaps due to deflation rather than inflation risk? It is likely however that the term premium rises at a turning points in rates – and also that if inflation ever made a sustained comeback, with central banks refusing to fight it, like in the pre-Volker years, the risk premium would rise strongly. We also know that markets tend to overshoot in both directions. Nevertheless, whilst it’s too soon to say that we’ve seen the highest yields of this cycle, as a value investor you could say that yields are moving towards fair value.
Whilst I was listening to Ben Bernanke last night, who announced his decision to reduce the monthly rate of purchases of treasuries and mortgage backed securities by $10 billion per month, it became clear that the time has come to coin a new phrase. With the employment picture improving substantially in the last few months from a very weak point, and with GDP growth moving in a similarly positive direction from a similarly weak point, it is entirely justifiable in my opinion that the Fed continues to provide historically vast quantities of liquidity, albeit at an ever so slightly slower pace. The Fed sees growth returning to between 2.8% and 3.2% for the next couple of years, and it sees unemployment falling to between 5.5 and 5.8% within that horizon. Take a step back, briefly, and you would look at these predictions for the economy and expect the policy rate to be substantially higher than zero. So why did Ben Bernanke spend so long anchoring the market’s expectations for the future path of interest rates, and why is he still creating $75 billion of cash each month?
In the 1970s the more economically developed nations were experiencing an unexpected new phenomenon: low employment and high inflation. This, as we all now know, came to be known as stagflation. Today, the US, and just very recently the UK, is experiencing the opposite: rapidly improving employment and falling inflation. I am going to call this disinfloyment.
Chairman Bernanke said that low inflation is “more than a little concern”. One has to think that it was the improving economic and political picture, as well as perhaps some concern over early bubble formations, that brought about the decision to taper, on the one hand, and the inflation picture that brought about the strengthening forward guidance and lowering and weakening of the unemployment rate ‘knockout’ on the other. Otherwise, given a better broader economic outlook, you would expect a truer normalisation of policy, with the provision of liquidity being stopped and rates being hiked. The concern I think Bernanke has, and the question I would have asked him, would have been “what if zero interest rates, massive liquidity provision, and forward guidance do not manage to generate inflation at or above target? What then Ben?”
If the Fed were to find itself in a position of full employment, acceptable growth, and disinflation, with policy rates and long term interest rates near their extreme floors, and the efficacy of increased liquidity provision being increasingly marginal of benefit, or perhaps worse, then the Fed is alarmingly close to the limits of its powers. Perhaps only helicopter drops would remain a viable tool at this point. It is the awareness of this that I think is framing current Fed action. At 1.5% 10 year treasury yields earlier this year, rapid liquidity provision, and zero interest rates, there was almost nothing the Fed could do to counteract falling inflation; it simply couldn’t add much more stimulus. The utterance of the ‘t’ word in May, and now the first minor reduction in the pace of stimulus last night has seen 10 year yields rise to 3%, and from this point there is scope for data to disappoint to such an extent that yields fall, forward guidance is pushed out further, and QE can be increased so as to stimulate the economy.
So disinfloyment is a state of the economy that policymakers are rightly very scared of, as, depending on the economy’s starting point, it is a state in which economic policy is getting ineffective. But do I actually think that this is a term that we will hear more of in the next couple of years? Probably not.
For disinfloyment to become a problem, the employment picture must continue to improve, and inflation must continue to fall or fail to rise. Whilst I believe the former to be highly likely at this point, I find that latter harder to believe, and the Fed’s projection yesterday was for inflation to return to 1.4% to 1.6% in 2014. Whilst this is clearly still below target, it is less worryingly so than it is today. Bernanke told us yesterday that he presently sees the glide-path for tapering to continue at $10 billion at each meeting, until liquidity provision stops at the end of 2014. I believe that there is a very difficult line for the Fed to tread over the next 12 months. As tapering continues and the markets come to expect the end of the stimulus, long-term yields will rise (as we saw in the Summer) and the economic data risks going in the wrong direction for the tapering to continue. For a gradual rise in rates not to detrimentally affect the recovery, the economy must be growing with such underlying momentum as to shrug off these higher rates: and in this environment, surely inflation would be returning? So: either the Fed finds the recovery to be too fragile to continue tapering, in which case it continues to increase the supply of money each month, thereby risking higher inflation further into the future when the economy improves; or the recovery is sufficiently strong, and inflation (excluding commodities, which the Fed cannot control) is rebounding.
Markets are being staggeringly complacent about inflation at the moment, aided by presently low inflation in the developed world. We would do well to remember that monetary policy since the start of the Great Financial Crash has been designed with one major purpose: to avoid the spiral of deflation witnessed in the 1930s. Deflation, clearly the greater evil of the dichotomy, has been avoided so far. But now developed economies are recovering, liquidity-driven positions are coming back out of commodities and emerging markets, which are pushing down inflation numbers around the world. 2014 will be treading a fine line between these disinflationary forces prevailing, and so monetary policy having to re-start the liquidity machines, and recoveries managing their ways through this transition and finding underlying momentum. Respectively, we either continue to risk higher inflation further in the future through increasing the supply of money, or we start to see it come through sooner than we all presently think: either way, we get inflation. Lest we forget: the Fed will have increased the supply of money by $4.25 trillion at the end of the tapering cycle. When the velocity of money starts rising on top of the increases in money supply, nominal output will start to rise unless the money supply is taken out to an offsetting extent. It is this that I find so unlikely, and it is this that would increase the probability of disinfloyment. In my opinion, we are more likely to get nominal output surprises, and so returning inflation, than anything else in the UK and US. We won’t hear too much, at that stage, about disinlfoyment.
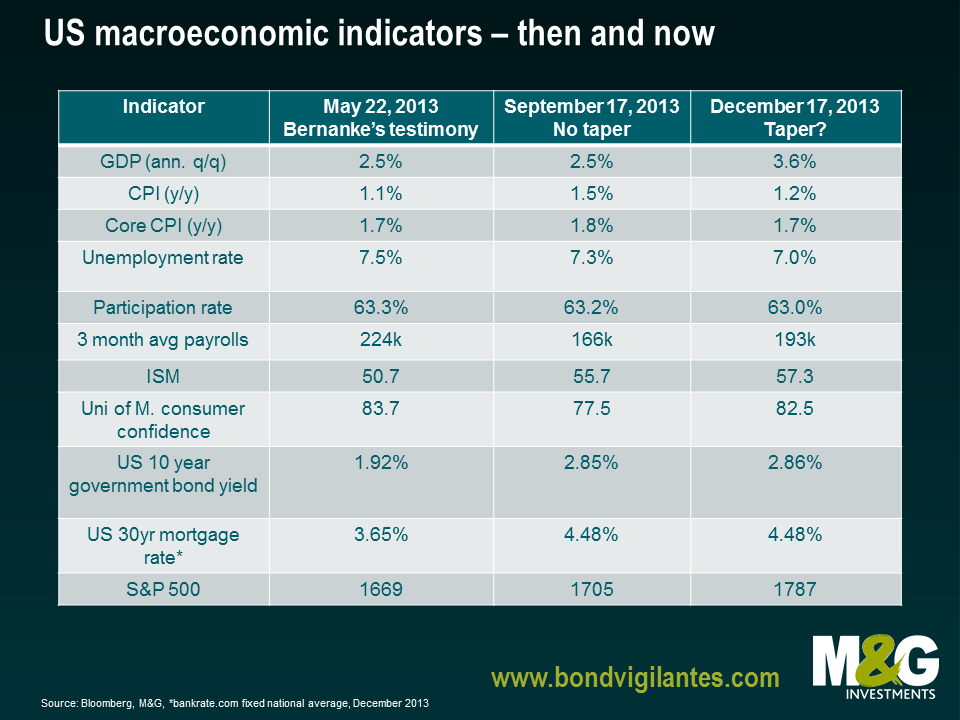
The FOMC took markets and economists by surprise in September this year when the committee members decided to hold off from tapering and maintain its bond-buying programme at $85bn per month. Three months down the road and the consensus for the December meeting outcome is that the Fed will not reduce the pace of MBS or treasury purchases. Consensus has been wrong before; will it be wrong again tomorrow? We think it will be a closer call than many expect.
In our opinion, there are several good reasons for the Fed to taper very slowly. Firstly, inflation is a non-issue, below target and close to lows not seen for decades. Secondly, the 30 year mortgage rate has risen from 3.5% in May to around 4.5% today, impacting US housing affordability and already tightening policy for the Fed. Thirdly, there is continued concern that 2014 may bring a return of the political brinkmanship that characterised late September, with the US Treasury signalling that the debt limit will have to be raised by February or early March to avoid default. Ultimately, the Fed is nowhere near hiking the FOMC funds rate.
There is no doubt after the September decision that tapering is truly data dependent and in this sense, macro matters. Fortunately, Ben Bernanke has told us what economic variables he and the FOMC will be looking at a press conference in June. The Fed wants to see a broad based improvement in three economic variables – employment, growth and inflation – before reducing the scale of bond buying.
The table below shows that the data has improved across the board. Annualised GDP is stronger, the unemployment rate is lower and the CPI is only 1.2%. Other key leading economic indicators like the ISM and consumer confidence are higher while markets are in a remarkably similar place to where they were three months ago with the 10 year yield at 2.86%.
After the surprise of September’s announcement, we believe that every FOMC meeting from here on out is “live” – that is, there is a good chance that the Fed may act to reduce its bond-buying programme in some way until it reaches balance sheet neutrality. A reduction in bond purchases is not a tightening of policy, we view it as a positive sign that policymakers believe that the US economy is finally healing after the destruction of the financial crisis. As I wrote in September, interest rate policy is set to remain very accommodative for a long time, even after balance sheet neutrality has been achieved.
Given the positive developments in the US economy over the past three months, the December FOMC announcement could announce a) a small reduction in bond buying and b) an adjustment of the unemployment rate threshold or a lower bound on inflation. Whatever the case, quantitative easing is getting closer to making its swansong.
The squeeze on UK consumers through falling real wages has been regarded as a significant factor in the (until recently) anaemic economic recovery. Employers have taken a good share of the blame for this – but is that fair? Have employers deliberately kept earnings below inflation as a means of boosting their own profitability, or was this an unintended outcome of upside inflation shocks?
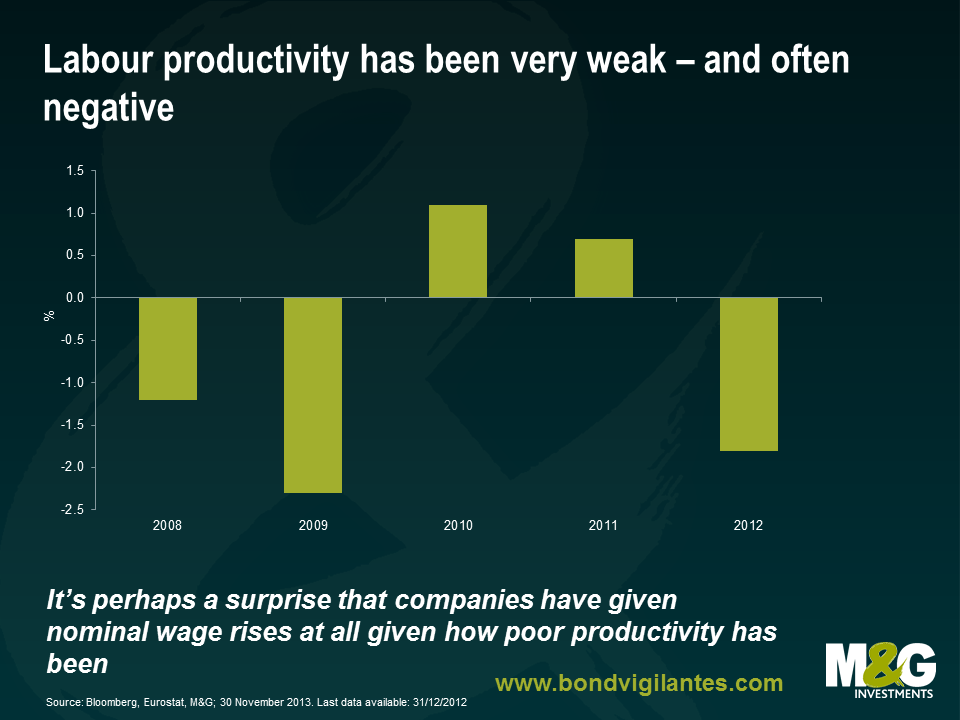
If we look at Eurostat’s nominal wage growth series in the UK since the credit crisis, it’s only in the last couple of years that nominal wage growth has been well below the Bank of England’s inflation target of 2%. In 2008 nominal wage growth was 6.1%, 2009 1.8%, 2010 3.6%, and 2011 2.1%.
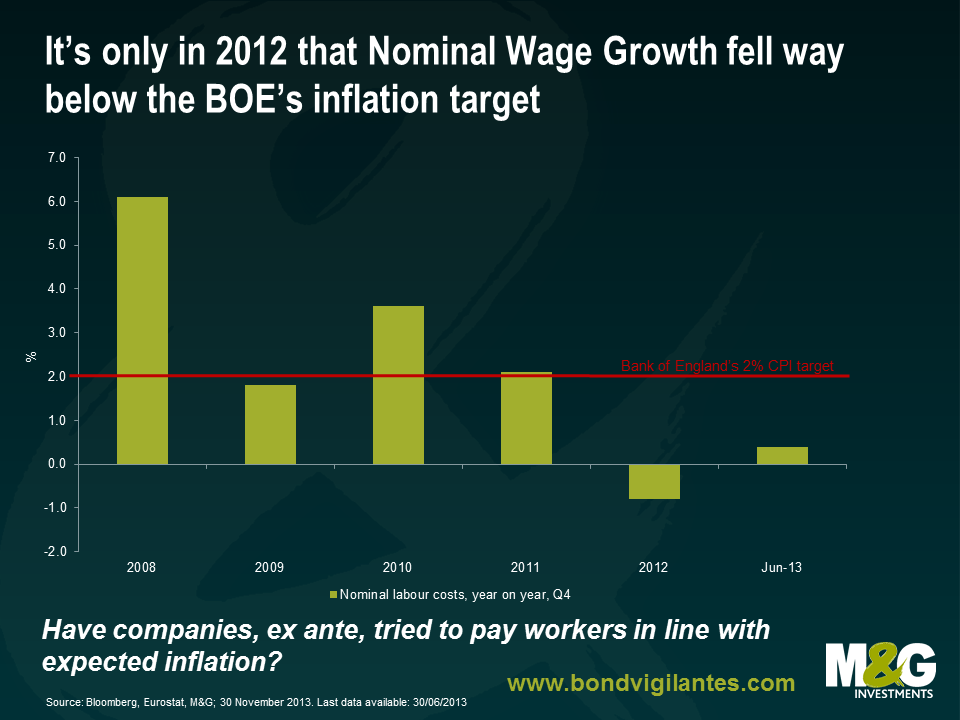
And yet over those same years, Labour Productivity per Hour Worked (again Eurostat) was awful. -1.2% in 2008, -2.3% in 2009, +1.1% in 2010, and +0.7% in 2011. In other words companies appear to have, ex ante, attempted to compensate their workers for expected inflation, assuming that the Bank of England hit its inflation target, and have overcompensated them, ex post, for improvements in productivity.
So has the problem for earnings been the unexpected inflation overshoot (since the credit crisis started CPI has been above the Bank’s 2% target in all but 6 months, in 2009), not the wage setting behaviour of companies? Had inflation come in at, or above target, workers would have been better off in real terms until 2012, and certainly better off than you might expect given the historically strong relationship between wage growth and productivity. I’m not sure I’m blaming the Bank of England here either – to achieve the 2% inflation target, rates would have had to have been inappropriately high for the domestic demand conditions and the distressed balance sheet of the UK public and private sectors. And productivity is weak in part because employment has been unexpectedly strong relative to the weakness of the economy. So a low inflation, high productivity UK economy sounds nice – but in the circumstances would likely have only have been possible with a much deeper recession and higher unemployment rate.
It’s late this year. Sorry. Here’s the 7th annual Christmas Quiz. 20 questions, and the closing date for entries is midnight on Monday, 23 of December 2013. Please email your answers to us at bondvigilantes@mandg.co.uk.
The winner will get to choose a charity to which we will donate £200. He or she will also get a copy of Morrissey’s autobiography, as will 5 runners up. It’s laugh out loud, you’ll love it. Good luck! Conditions of entry are somewhere down near the bottom.
1. “The band the Beatles could have been”. Who?
2. Which European Champions League winning football team take their colours from those of the Greek flag?
3. Which massive 1980s pop band had 3 of its 5 members with the same surname without any of them being related?
4. Who texted “Noli timere” this year?
5. If you substitute soda water for gin in an Americano, what would you end up with?
6. Once 21 million of these have been made, production will stop. What?
7. What does it say under the English instructions?

8. Who hit 11 holes-in-one in his first ever round of golf, and then declared his retirement from the sport?
9. Graced fair wound (anag.).
10. Which band did some reverse QE in August 1994 and took exactly £1 million out of circulation?
11. What’s been the top selling vehicle range in the US for 28 consecutive years?
12. Who said that letting inflation rise could be a “wise and humane policy” if it increased output?
13. Who wrote this note?

14. Which music video? A man in a trenchcoat, hat and dark glasses lurks in a run down, graffiti covered alley. Later a man in pink shirt, bow tie and leather trousers walks down the street, lighting up the pavement as he goes. There’s also a stray cat, and a tiger in it.
15. Which music video? A middle aged man, played by a famous actor, slumps in a hotel lobby chair wearing a suit and tie. He hears music and dances around the hotel (escalators, baggage trollies) and ends up flying through the air in the atrium.
16. Which music video? A UK comedian chauffeurs a woman in a cowboy hat around as she sings and drinks champagne. There’s a cartoon sequence in it too.
17. What is the US government’s net P&L (to the nearest $1 billion) on the positions it took in GM, AIG and Citibank during the financial crisis?
18. Which climb?

19. What is the biggest corporate bond deal of all time?
20. If you take the first letter of each stanza in its national anthem, you get the name of the founder of its royal house. Which country?
This competition has now closed.
The M&G YouGov Inflation Expectations Survey for November shows that consumers in all countries surveyed expect inflation to rise from current levels in both one and five years’ time. In the UK, short-term inflation expectations fell over the quarter to 2.8%, following recent downward pressure on UK CPI. It may also suggest that the shock from recent increases in utility bills may be fading. Over five years, however, inflation is once again expected to rise to 3.0%, suggesting expectations for future inflation remain well anchored above the Bank of England’s (BoE) CPI target of 2.0%. We did not see the same spike in inflation expectations as in other recent inflation expectations surveys such as the Bank of England’s own survey, possibly as ours is more recent and was conducted between November 22-25.
In Europe, all countries surveyed with the exception of Switzerland, expect inflation to be equal to or higher than the European Central Bank’s (ECB) CPI target of 2.0% on both a one- and five-year ahead basis. All European Monetary Union (EMU) countries expect inflation to be higher in both one and five years than it is currently, while only two countries – Spain and Switzerland – anticipate it being less than 3.0% in 5 years’ time.
Comparing the results with those from earlier surveys reveals a number of noteworthy observations. Inflation expectations for one year ahead have fallen in all surveyed EMU countries since the start of 2013. This is unsurprising given the weak macroeconomic environment and the fact that commodity prices have declined by roughly 5.6% in the past three months. Consumers have also benefitted from a stronger euro, which has gained around 6.6% over the past year on a real effective exchange rate (REER) basis. Notably, short-term inflation expectations in France, Spain and Italy are now running well above their current inflation rates.
Survey respondents in Hong Kong show no signs of moderating their inflation expectations, which remain at a high level of 5.0% and 5.5% over one and five years, respectively. In Singapore, inflation expectations over one year are double current inflation (2%) whilst the five-year reading remains stable at 5.0%, as it has done throughout the course of 2013.
The findings and data from our November survey, which polled over 8,500 consumers internationally, is available in our latest report here.
With inflation numbers in the UK moving back towards target and deflationary concerns prevalent in Europe, it is worth asking ourselves whether stubbornly high prices in the UK are a thing of the past. Whilst the possibilities of sterling’s strength continuing into 2014 and of political involvement in the on-going cost of living debate could both put meaningful downside pressure on UK inflation in the short term, I continue to see a greater risk of higher inflation in the longer run.
The UK has been somewhat unique amongst developed economies, in that it has experienced a period of remarkably ‘sticky’ inflation despite being embroiled in the deepest recession in living memory. Against an economic backdrop that one might expect to be more often associated with deflation, the Consumer Prices Index (CPI) has remained stubbornly above the Bank of England’s 2% target.
One of the factors behind this apparent inconsistency has been the steady increase in the costs of several key items of household expenditure, together with the recent spike in energy prices which I believe is a trend that is set to continue for many years.
Rising food prices have been another source of inflationary pressure. Although price rises have eased in recent months following this summer’s better crops, I think they will inevitably remain on an upward trend as the global population continues to expand and as global food demands change.
Sterling weakness has also contributed to higher consumer prices. Although sterling has performed strongly in recent months, it should be remembered that the currency has actually lost around 20% against both the euro and the US dollar since 2007. This has meant that the prices of many imported goods, to which the UK consumer remains heavily addicted, have risen quite significantly.
Despite being persistently above target, weak consumer demand has at least helped to keep UK inflation relatively contained in recent years. However, given the surprising strength of the UK’s recovery, I believe we could be about to face a demand shock, to add to the existing pressures coming from higher energy and food costs.
The UK’s economic revival has been more robust than many had anticipated earlier in the year. Third-quarter gross domestic product (GDP) grew at the fastest rate for three years, while October’s purchasing managers’ indices (PMIs) signalled record rates of growth and job creation. Importantly, the all-sector PMI indicated solid growth not just in services – an area where the UK tends to perform well – but also in manufacturing and construction. At the same time, the recent surge in UK house prices is likely to have a further positive impact on consumer confidence, turning this into what I believe will be a sustainable recovery.
Central banks around the world have printed cash to the tune of US$10 trillion since 2007 in a bid to stimulate their ailing economies. This is an unprecedented monetary experiment of which no-one truly understands the long-term consequences. There has been little inflationary impact so far because the money has essentially been hoarded by the banks instead of being lent out to businesses. However, I believe there could be a significant inflationary impact when banks do begin to increase their lending activities. At this point, the transmission mechanism will be on the road to repair, and a rising money velocity will be added to the increased money supply we have borne witness to over the last 5 years. Unless the supply of money is reduced at this point, nominal output will inevitably rise.
Furthermore, I am of the view that new Bank of England governor Mark Carney is more focused than his predecessor was on getting banks to lend. His enthusiasm for schemes such as Funding for Lending (FFL), which provides cheap government loans for banks to lend to businesses, is specifically designed and targeted to fix the transmission mechanism, by encouraging banks to lend and businesses to borrow. The same is true of ‘forward guidance’, whereby the Bank commits to keep interest rates low until certain economic conditions are met.
Perhaps most importantly, I continue to believe the Bank is now primarily motivated by securing growth in the real economy and that policymakers might be prepared to tolerate a period of higher inflation: this is the key tenet to our writings on Central Bank Regime Change in the UK.
With real GDP growth of close to 3% and with inflation above 2% at the moment in the UK, a simple Taylor Rule is going to tell you that rates at 0.5% are too accommodative. But it appears that policymakers are, as we suggest above, happy to risk some temporary overheating to guarantee or sustain this recovery. We believe that this is a factor we are going to have to watch in the coming years, as the market comes to realise that it is much harder to remove easy money policies and tighten interest rates than it was to implement them and cut them.
We witnessed a clear demonstration of this with the infamous non-taper event in September: as the data improved, Bernanke had to consider reducing the rate of monthly bond purchases. However, the combination of improved data and a potential reduction in the rate of purchases saw yields rise; ultimately higher rates saw policymakers state their concerns about what these were doing to the housing market recovery, and so we got the ‘non-taper’. I believe that there are important lessons to be learned from this example, and that policymakers are going to continue to lag the economic recovery to a significant extent.
Despite these risks, index-linked gilts continue to price in only modest levels of UK inflation. UK breakeven rates indicate that the market expects the Retail Prices Index (RPI) – the measure referenced by linkers – to average just 2.7% over the next five years. However, RPI has averaged around 3.7% over the past three years and tends to be somewhat higher than the Consumer Prices Index (CPI). At these levels, I continue to think index-linked gilts appear relatively cheap to conventionals.
Furthermore, this wedge between RPI and CPI could well increase in the coming months due to the inclusion of various housing costs, such as mortgage interest payments, within the calculation of RPI. The Bank of England estimates the long-run wedge to be around 1.3 percentage points, while the Office for Budget Responsibility’s estimates between 1.3 to 1.5 percentage points . If we subtract either of these estimates from the 5-year breakeven rate (2.7%), then index-linked gilts appear to be pricing in very low levels of CPI.
Current inflation levels may seem benign. However, potential demand-side shocks coupled with a build-up in growth momentum and the difficulty of removing the huge wall of money created by QE will pose material risks to inflation in the medium term. Markets have become short-sightedly focused on the near term picture as commodity prices have weakened and inflation expectations have been tamed by the lack of growth. This has created an attractive opportunity for investors willing to take a slightly longer-term view.
A reminder to our readers that the Q4 M&G YouGov Inflation Expectations Survey for the UK, European and Asian economies is due out later this week . The report will be available on the bond vigilantes blog.
With many expecting a ‘great rotation’ out of fixed interest assets in 2013, bond investors will, in the main, have experienced a better year than some had predicted 12 months ago. It might not always have felt like it at the time – indeed, over the summer when markets were sent into a spin by the prospect of the US Federal Reserve (the Fed) cutting its supply of liquidity earlier than expected, it almost certainly did not. But riskier assets, notably high yield corporate bonds, have continued to perform strongly, while investment grade corporate bonds are on track to deliver another year of positive returns, in spite of the volatility.
Meanwhile, the macroeconomic backdrop has generally improved over the past year, with the economic recovery gaining significant momentum in the US and, more recently, the UK. However, the picture in Europe remains mixed, while our concerns over the emerging markets are mounting. However, despite their disparate prospects, all countries – and all bond markets – are united by at least one common dependency: the Fed.
So what does 2014 have in store for global bond markets? In our latest Panoramic outlook, Jim outlines his macroeconomic and market forecasts for the year ahead. And for those of you who have been wondering, the annual M&G Bond Vigilantes Christmas quiz will be posted later this week.
Enjoy!


Sign up to the Bond Vigilantes mailing list to ensure you never miss a great article from our expert Bloggers. We will email all new articles to your inbox, meaning you can stay on top of the world of Bonds.
I confirm that I would like to receive information about Bond Vigilantes and products and services from M&G Securities Limited.
We will use the email address and personal data you have shared with us to send you this information. For existing customers, submitting your contact details and requesting to receive this information from us, will replace any earlier choices you have made in respect of marketing information.
You can unsubscribe from marketing at any time, at which point we will not send any further marketing information to you, by selecting the unsubscribe link in all communications.


