
Rolldown
A dispatch from the number crunchers – Yield curve rolldown
By Matthew Russell
15 April 2026

“Once upon a time, Western opinion leaders found themselves both impressed and frightened by the extraordinary growth rates achieved by a set of Eastern economies. Although those economies were still substantially poorer and smaller than those of the West, the speed with which they had transformed themselves from peasant societies into industrial powerhouses, their continuing ability to achieve growth rates several times higher than the advanced nations, and their increasing ability to challenge or even surpass American and European technology in certain areas seemed to call into question the dominance not only of Western power but of Western ideology. The leaders of those nations did not share our faith in free markets of unlimited civil liberties. They asserted with increasing self-confidence that their system was superior: societies that accepted strong, even authoritarian governments and were willing to limit individual liberties in the interest of the common good, take charge of their economies, and sacrifice short-run consumer interests for the sake of long-run growth would eventually outperform the increasingly chaotic societies of the West. And a growing minority of Western intellectuals agreed.
The gap between Western and Eastern economic performance eventually became a political issue. The Democrats recaptured the White House under the leadership of a young, energetic new president who pledged to “get the country moving again” – a pledge that, to him and his closest advisers, meant accelerating America’s economic growth to meet the Eastern challenge.”
The passage is the opening to the highly readable and hugely influential 1994 paper The Myth of Asia’s Miracle. The period referenced is the early 1960s, the dynamic president was John F. Kennedy (read Bill Clinton), and the rapidly growing Eastern economies were the Soviet Union and its satellite nations (read East Asia). Author Paul Krugman took on the prevalent East Asian euphoria by drawing disturbing parallels between the unsustainable way that the Asian Tigers were managing to generate supersonic growth, and how the recently obsolete Soviet Union had also once achieved seemingly miraculous growth rates. Krugman’s paper gained widespread attention at the time (even more so post the 1997 Asian crisis), and succeeded in refocusing attention on the concept of productivity. It mattered not what the growth rate was, but how it was achieved.
To explain this and briefly summarise, consider what actually drives economic growth. Growth accounting shows that GDP per capita growth comes from two main sources; inputs and efficiency. The ‘inputs’ can be split into labour (e.g. growth in employment) and capital (e.g. the accumulation of physical capital stock such as machines and buildings). But long term, sustained per capita economic growth tends to come not from increases in the ‘inputs’, but from increases in efficiency, of which the main driver is technological progress. Nobel Laureate Robert Solow showed in his seminal 1956 paper that technological progress had accounted for 80% of US per capita growth between 1909 and 1949, although more recent studies have suggested a still substantial figure of more like 45-55% thereafter.
Krugman pointed to previous research showing that the Soviet Union’s rapid growth had not been due to efficiency gains. Indeed, the USSR was considerably less efficient than the US, and showed no signs of closing the gap. Soviet growth had been solely due to the ‘inputs’, and input-driven growth has diminishing returns (e.g. there is a finite number of workers you can educate). The USSR’s growth was largely ‘built on perspiration rather than inspiration’.
In a similar way, the Asian Tigers’ rapid growth was due to an ability to mobilise resources. There was no great improvement in efficiency, and no ‘miracle’ – it could be fully explained by the employed share of the population rocketing, education improving dramatically, and an enormous investment in physical capital (in Singapore, investment as a share of output jumped from 11% to more than 40% at its peak). But these were one time changes; they weren’t repeatable.
Fast forward to 21st century China.
There is a perception that China’s rocketing growth rate has always been reliant on heavy investment, but that’s not the case. Investment, or capital formation, has of course been an important driver, but the ‘pre 2008’ China did achieve rapid productivity gains thanks to the rise of the private sector and technological catch-up as the economy slowly began to open its borders.
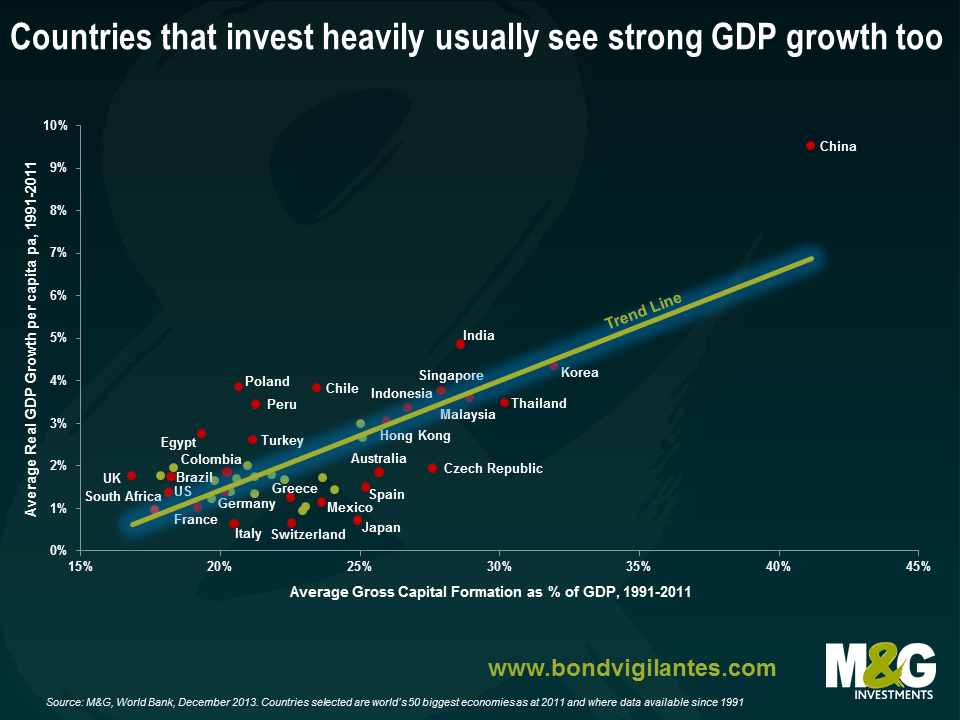
In the chart below, I’ve looked at how much the world’s biggest economies have invested as a percentage of their GDP, and compared this to the countries’ GDP per capita growth rates. Countries with higher investment rates tend to have higher GDP growth rates and vice versa, which is intuitive and supports the discussion above. Since the 1990s, most (but not all) emerging/developing countries have been positioned towards the top right hand side with higher investment and higher growth rates, and the more advanced economies have typically been towards the bottom left with lower investment and lower growth rates. In one extreme you have China, where investment has averaged over 40% of GDP, and the GDP per capita growth has averaged a phenomenal 9.5%. The fact that China’s growth rate is well above the trend line in the chart is indicative of the productivity gains that China has achieved over the period as a whole on average. The country with the weakest investment rate is the UK.
‘Post 2008’ China looks a different animal. Productivity and efficiency seem to be plummeting, where GDP growth is becoming dangerously reliant on the ‘inputs’, namely soaring investment. We’ve all heard about how China’s leaders desire a more sustainable growth model, featuring a rebalancing of China’s economy away from investment and export dependence and towards one that is more reliant on domestic demand and consumer spending (e.g. see the 12th 5 year plan covering 2011-2015 or the Third Plenum). In practice, what we’ve instead consistently seen is an inability or unwillingness to meaningfully reform, where any dip in economic growth has been met with yet another wave of state-sponsored overinvestment. (Jim recently blogged about economist Michael Pettis’ expectation that China long term growth could fall to 3-4%, a view with which I have a lot of sympathy. Please see also If China’s economy rebalances and growth slows, as it really must, then who’s screwed? for an additional analysis of the implications of China’s economic slowdown).
It was widely reported earlier this week that China’s 2013 GDP growth rate fell to a 13 year low of 7.7%, a slowdown that seems to have continued into 2014 with the release of weak PMI manufacturing reading yesterday. But much more alarming is how the makeup of China’s growth has changed: last year investment leapt from 48% of China’s GDP to over 54%, the biggest surge in the ratio since 1993.
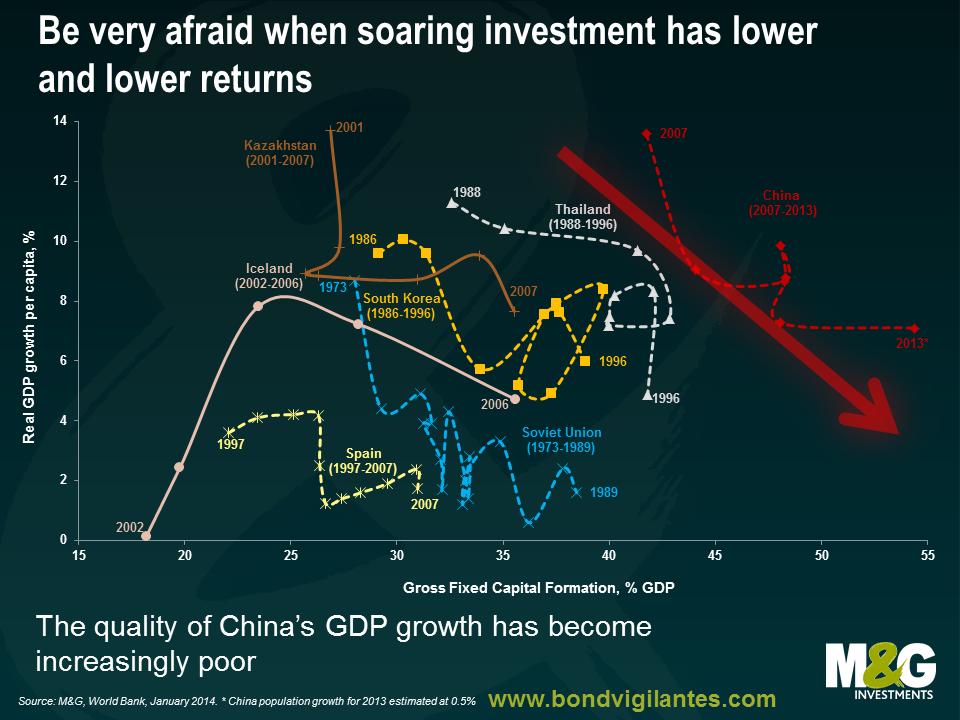
The chart below puts China’s problems into perspective. As already demonstrated, there is a strong correlation between different countries’ investment rates and GDP growth rate. There also tends to be a reasonable correlation over time between an individual country’s investment rate and its GDP growth rate (Japan’s experience from 1971-2011 is a good example, as shown previously on this blog). Over time, therefore, a country should be broadly travelling between the bottom left and top right of the chart, with the precise location determined by the country’s economic model, its stage of development and location in the business cycle.
It should be a concern if a country experiences a surge in its investment rate over a number of years, but has little or no accompanying improvement in its GDP growth rate, i.e. the historical time series would appear as a horizontal line in the chart below. This suggests that the investment surge is not productive, and if accompanied by a credit bubble (as is often the case), then the banking sector is at risk (e.g. Ireland and Croatia followed this pattern pre 2008, Indonesia pre 1997).
But it’s more concerning still if there is an investment surge accompanied by a GDP growth rate that is falling. This is where China finds itself, as shown by the red arrow.
Part of China’s growth rate decline is likely to be explained by declining labour productivity – the Conference Board, a think tank, has estimated that labour productivity growth slowed from 8.8% in 2011 to 7.4% in 2012 and 7.1% in 2013. Maybe this is due to rural-urban migration slowing to a trickle, meaning fewer workers are shifting from low productivity agriculture to higher productivity manufacturing, i.e. China is approaching or has arrived at the Lewis Turning Point (see more on this under China – much weaker long term growth prospects from page 4 of our July 2012 Panoramic).
However the most likely explanation for China’s surging investment being coupled with a weaker growth rate is that China is experiencing a major decline in capital efficiency. Countries that have made the rare move from the top left of the chart towards the bottom right include the Soviet Union (1973-1989), Spain (1997-2007), South Korea (1986-1996), Thailand (1988-1996) and Iceland (2004-2006). Needless to say, these investment bubbles didn’t end well. In the face of a labour productivity slowdown, China is trying to hit unsustainably high GDP growth rates by generating bigger and bigger credit and investment bubbles. And as the IMF succinctly put it in its Global Financial Stability Report from October 2013, ‘containing the risks to China’s financial system is as important as it is challenging’. China’s economy is becoming progressively unhinged, and it’s hard to see how it won’t end badly.
Having seen one of my favourite economists, Professor Michael Pettis, present twice in the past couple of months, I thought I’d try to distil his important messages about the future of the Chinese economy. For those with more time, he also writes a blog which you can find here. The recent presentations aside, I first saw Professor Pettis at a breakout session during the World Bank-IMF meeting in Tokyo in 2012. I was in the crowd in a packed room when Pettis said that Chinese GDP growth would likely fall to an average of 4% for the next decade. Across the audience there were audible titters and even people making the “he’s crazy” thing by swirling their fingers next to their heads. Little more than a year on, and the China slowdown view is nearer to the consensus – although you’d still find it difficult to find an official sub-5% China GDP forecast over any timeframe. Pettis maintains that 3-4% average growth is China’s likely future; the IMF’s World Economic Outlook has revised down its estimate of Chinese potential growth, but only from 8.9% to 8.0%. This morning the 2013 Chinese GDP number was released, at 7.7%, the 4th year in a row now of lower annual growth rates (and even then sceptics suggest that electricity consumption data and freight analysis show that the GDP numbers are overstated in the official statistics).
Professor Pettis’s starting point is that any investment led growth model eventually comes to an end as the quick wins from early infrastructure spending and urbanisation/industrialisation fade away and profitable investment opportunities become harder to find. And this investment has to be financed somehow – and it is the household that pays. For Brazil, the first example of an “economic miracle”, the investment was financed through high income taxes. In the “East Asian” model however (and this was true in Japan’s growth phase post WW2 as well as in China today) the burden on households is less explicit than taxation. The three hidden methods of boosting investment growth at the expense of consumption growth are:
When the supply of profitable investment starts to run out, debt starts to rise more quickly than the ability to service that debt. This leads to a Japan style debt crisis or stagnation. Some estimate that 30% of new loans issued are simply to rollover debt that would otherwise be in default, and that non-performing loans are seriously underestimated in the official data (under 1% according to the China Banking Regulatory Commision). But what about reform, as promised by the Third Plenum? President Xi Jinping appears to recognise the problems that the economy faces, and accepts the need for rebalancing towards consumption. But he has also publically recognised the vested interests in China. The interests of the political elite are aligned with infrastructure projects and the State Owned Enterprises, and this will make reform exceptionally difficult. Studies of “successful” economic development have suggested that nations that democratise quickly and fully or nations that centralise aggressively do well economically over the long term. Examples of those that do neither are Argentina and Russia. It remains unclear whether China will follow a “successful” path, because of its vested interests. As a result growth of 7-8% per year might continue to be the debt-fuelled norm – but the hangover will be much bigger (disorderly negative growth rather than 3-4% in an orderly rotation away from investment towards consumption).
What would real reform look like, in Professor Pettis’s view?
You can read FT Alphaville’s Third Plenum cheat sheet here. You would have to say that progress towards what Michael Pettis thinks is necessary looks pretty slow – although it does appear that there has been some upwards movement in Chinese money market rates more recently, with the average 3 month money market rate (SHIBOR) moving up from below 5% in Q3 2013 to over 5.5% now.
2013 was another decent year for returns in the high yield market. The US market returned 7.4%, with Europe a little way ahead at 10.3%. Bonds saw solid income returns, low default rates and a small capital gain as a tightening in credit spreads was enough to overcome weakness in the government bond markets. Once again this illustrated how high yield can be one of the few fixed income asset classes that can generate positive returns within a rising interest rate environment.
However, the dead hand of mathematics weighs heavily upon the prospects for the market in 2014. We still believe it will be a positive year for total returns, but expectations are for returns to be in the mid-single digits.
How then can we seek to potentially enhance these returns and reduce volatility in High Yield this year ? Here are five strategies that could help:
Benjamin Franklin said that death and taxes were the only inevitabilities in life. I’d like to add the discussion of the January effect to his list. Every year I receive at least one piece of commentary telling me that January is always a good month for risk assets (we’re far from innocent ourselves – see here).
Basing investment decisions purely on seasonal anomalies isn’t a particularly reliable investment process and the sensible investor should take other, more robust information into account when making changes to their portfolio.
The improving economic outlook for Europe and the general lack of pessimism should help the European credit market rally this month. So too should the fact that about €64bn worth of investment grade bonds are set to have matured by the end of the month. I think it rather unlikely that we’ll see enough supply to offset the bonds that are maturing. J.P. Morgan recently publishing a research piece pointing out that gross European investment grade issuance has only ever been higher than €64bn a month on four occasions in the past, and all were prior to 2008.
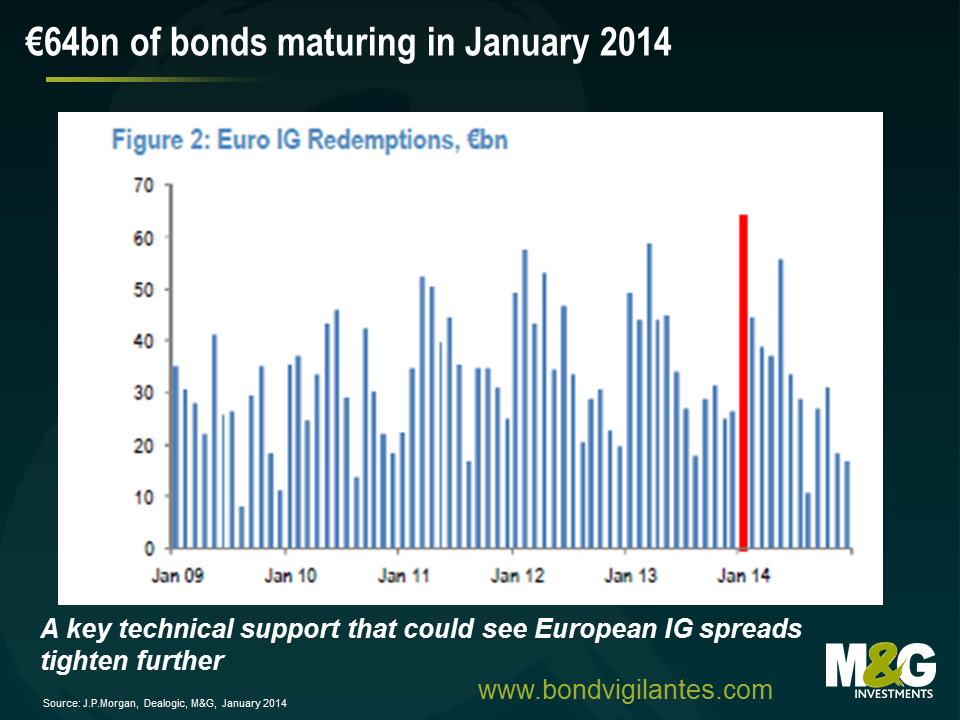
J.P. Morgan also point out that January has been on average the month when most issuance takes place throughout the year. The primary market has been true to form since 2014 began but it will need to maintain the pace of the roughly €16bn that was issued in the first week of the year to give investors with maturing bonds somewhere to put their cash.
If net issuance turns out to be negative in January it will be a key technical support that could see Euro investment grade spreads continue to tighten further. It will also give us all another nice data point to talk about come next January.
Many of us have become accustomed to a world of ultra-low interest rates and quantitative easing (QE). Taking into account inflation, real short-term interest rates are negative in most of the developed world. Of course, these historically low interest rates were a central bank response –co-ordinated on some occasions – to the Great Financial Crisis of 2008. Whilst we are still waiting for the official data, it appears increasingly likely that 2013 marked the start of a synchronised recovery in the advanced economies. So is it now time for the Bank of England to consider hiking the base rate? Perhaps good – and not awesome – economic growth is more appropriate to avoid a bust down the line.
Economic theory and real world experience tells us that interest rates that are kept too low for too long will distort investment decisions and lead to excessive risk-taking. They may also result in the formation of asset price bubbles that ultimately collapse. With parts of the UK housing market (including London and the south-east) posting double-digit returns in 2013, the FTSE 100 within arm’s reach of an all-time high last seen during the tech bubble (and up over 60% since 2009), and UK non-financial corporate bond spreads 45 basis points away from 2007 lows; it is clear that ultra-low interest rates have had a great effect on both financial markets and the real economy.
At the risk of being called a party pooper, here are 5 reasons why I think we could see an interest rate hike before year end (the market is pricing in around February/March 2015), and certainly before the third quarter of 2016 (the time when the BoE think the unemployment rate will fall to 7%).
Asset prices bubbles are forming
There has been a significant run-up in UK financial assets over the course of the past five years, particularly since QE became a feature of the financial landscape. Investors in equity and bond markets alike have been enjoying the fruits of QE. Those that own financial assets have seen their net wealth increase substantially from the post-crisis lows. Consensus forecasts for 2014 suggests that most market forecasters expect another robust year for risk assets, fuelled by easy money and the search for positive real returns.
Of course, the greatest financial asset that the average UK household own is their own house. In 2011, it was estimated that around 15 million households are owner-occupied (a rate of around 65% of total households). Thus it is unsurprising that newspaper readers are usually hit with a headline about rising house prices on a daily basis. House prices, on a number of measures, have begun to accelerate again with low interest rates and tight housing supply a key contributor to the price increase. Low interest rates have given UK consumers the incentive to accumulate high levels of household debt compared to their incomes. The average house price is now 5.4 times earnings, the highest level since July 2010 and well above the long-run average of 4.1.
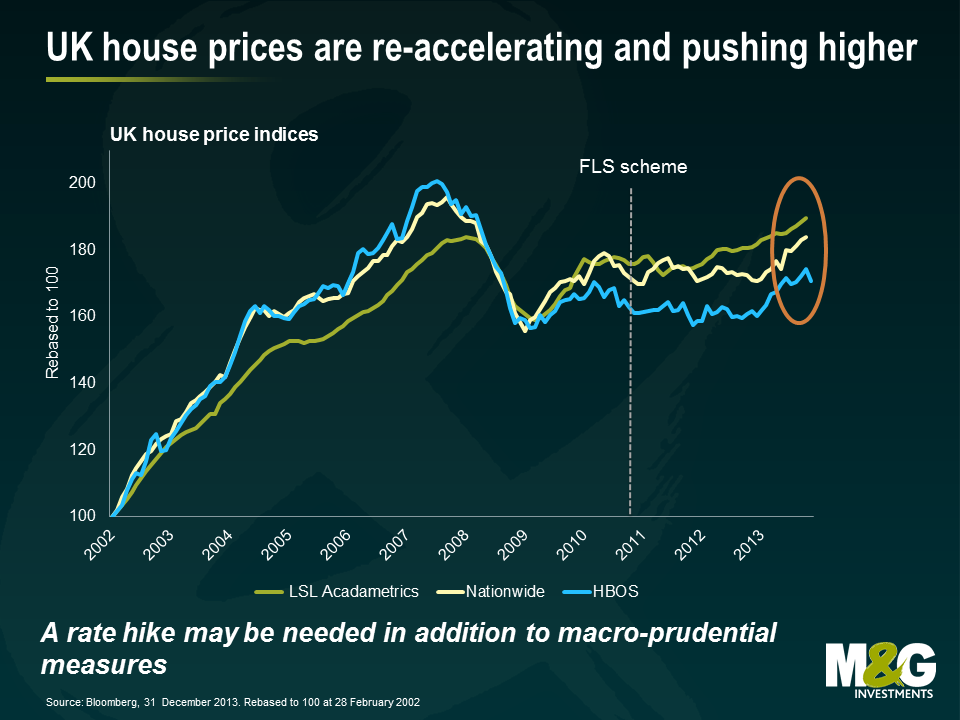
The Help-To-Buy scheme is contributing to the run-up in this highly leveraged and interest-rate sensitive sector (a topic I covered back in July here). By hiking the base rate this year, the BoE would hopefully achieve a reduction in speculation and debt accumulation in the housing sector. This would not be a popular action to take – it never is – but we should all be wary about the damage a rampant housing market can have on an economy. BoE Governor Mark Carney – as head of the Financial Policy Committee – has already moved to stop the Funding for Lending Scheme and mentioned that placing restrictions on the terms of mortgage credit may be a tool that can be used to reign in house prices.
Whether macro-prudential policy tools will work or not remains open to debate. Ultimately, central banks are trying to focus in on one element of the economy by raising interest rates or restricting credit. We do have a real-life macroeconomic example currently taking place though. On October 1, the Reserve Bank of New Zealand imposed a limit on how much banks could devote to low-deposit loans and required major banks to hold more capital to back loans. It’s very early days but for the month of November, the Real Estate Institute of New Zealand reported a 1.2% increase in New Zealand house prices and 9.6% over the year. The RBNZ and BoE might find that trying to slow the housing market using macro-prudential measures is a bit like trying to stop a car by opening the doors and hoping that wind-resistance does the rest. You really need to put your foot on the brake.
The longer the boom lasts, the greater the pain when it inevitably ends.
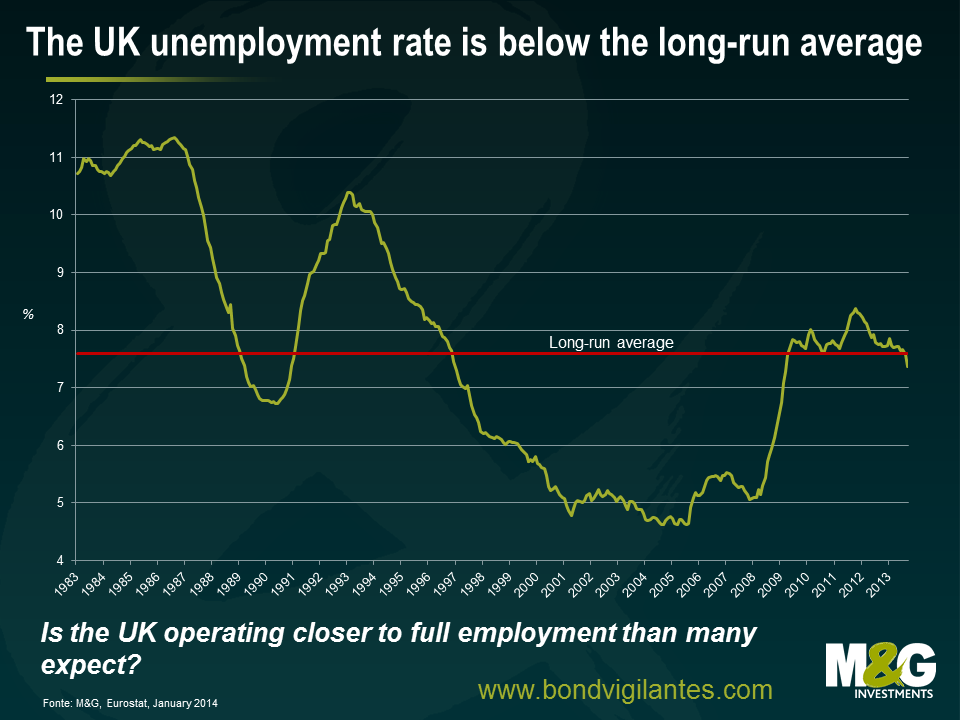
Unemployment is falling quickly towards 7%
The unemployment rate has fallen from 7.9 to 7.4% over the past nine months and is a key tenet of the BoE’s forward guidance. The fast decline has seen some speculation amongst economists that the BoE may lower the unemployment threshold from 7.0 to 6.5%. Of course, the 7.0% threshold that it has set it is not a trigger to hike interest rates, rather it is a point at which the BoE would consider hiking rates. However, the labour market has improved much quicker than the BoE has been expecting with the unemployment rate now sitting at the lowest rate since March 2009. We are still well above the average unemployment rate seen during the period between 2000 and 2008, but I would argue that this was an abnormal period for the UK economy. It was a NICE period – non-inflationary, constantly expanding – and is unlikely to be repeated. Arguably the UK’s natural rate of unemployment is now a percentage point or two higher than that of the noughties, suggesting less spare capacity in the UK economy than many expect. It may not be long before we start to see wage demands start to pick up, leading to rising inflationary pressures. Higher wage growth in 2014 would bode well for consumption and household net wealth given the increase in house prices and investment portfolios.
As it is generally accepted that monetary policy operates with a lag, (the BoE estimate a lag time of around two years), and the unemployment rate itself is a lagging indicator of economic activity. If the BoE waits until the unemployment rate hits 7%, or for confirmation that economic growth is strong, then it may be too late. A slight tap on the breaks by hiking the base rate may be appropriate.
Inflation risks should not be forgotten
Ben wrote an excellent piece on the UK’s inflation outlook last month. To quote:
Current inflation levels may seem benign. However, potential demand-side shocks coupled with a build-up in growth momentum and the difficulty of removing the huge wall of money created by QE will pose material risks to inflation in the medium term. Markets have become short-sightedly focused on the near term picture as commodity prices have weakened and inflation expectations have been tamed by the lack of growth.
In addition, central banks have a nasty habit of keeping monetary policy too loose for too long. It even has a name – “The [insert FOMC Chairperson Name] Put”. The easy-money policies of the FOMC in the 1970s are seen as a key contributor to the runaway inflation seen during the period. Eventually, the FOMC reversed its own policies, hiking rates to 19% in 1981.
Of course, what central bankers really fear is that ultra-easy monetary policy and the great experiment of QE will lead to an increase in inflation. A return of inflation will only be tamed by hiking rates. Whilst the inflation rate has been moderating in the UK and is close to the Bank of England’s target at 2.1%, it follows almost 5 years of above target inflation. Whist it is not a clear and present danger, the experience of the 1970s suggests that we cannot ignore the threat that inflation poses to the UK economy, especially as rising inflationary expectations are often difficult to contain.
The Taylor rule suggests interest rates are way below neutral
The Taylor rule provides a rough benchmark of the normal reaction to economic conditions as it relates interest rates to deviations of inflation from target and the output gap. According to the Taylor rule for the UK, a base rate of 0.5% is around 2.0% below where it should be given current rates of growth and inflation.
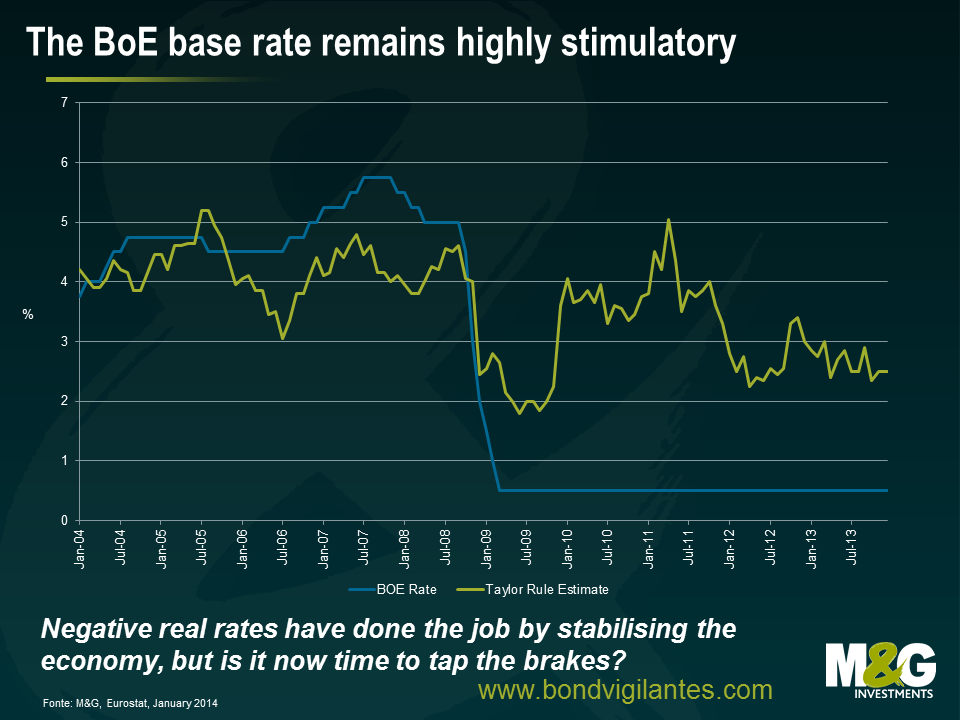
Negative real interest rates have done the job by stabilising the economy, but is it now time to tap the brakes? With the UK economy growing at an annualised rate of more than 3% in the second and third quarters of 2013 (above the long-term average of 2%), the UK may be operating much closer to full employment than many currently estimate. Forward looking survey indicators and economic data suggest the UK economy is growing strongly, with business confidence at a 20 year high and the UK Services PMI for December suggesting a strong broad-based upturn. Of course, the BoE would like the other components of GDP like exports and investment to contribute more to economic growth. A rising currency wouldn’t help this. But sometimes it is difficult to have your cake and eat it too, especially if you are a central banker.
The risk of Euro area breakup appears to have fallen
Now it’s time for the “Draghi Put”. Draghi’s famous “whatever it takes” speech is probably the most important speech ever given by a central banker. The speech has had a fantastic effect on assets from government bonds to European equity markets and everything in between. More importantly, as I wrote here back in July 2013, despite the problems that Europe faces – the concerning outlook, the record levels of unemployment and debt, the proposed tax on savers in Cyprus – no country has left the EMU. The EMU has in fact added new members (Slovakia in 2009, Estonia in 2011, Latvia in 2014). European countries remain open for trade, have continued to enforce EU policies and have not resorted to protectionist policies. EU banking regulation has become stronger, the financial system has stabilised, and new bank capital requirements are in place.
This bodes well for the UK, as stabilisation in the Eurozone suggests stronger export demand, increased confidence, and higher investment in the UK from European firms. Perversely, an interest rate hike might actually improve confidence in the UK economy, signalling that the central bank is confident that economic growth is self-sustaining.
The BoE must walk the tightrope between raising rates slightly now to avoid higher inflation and financial instability or risk having to do a lot more monetary policy “heavy-lifting” down the line. A base rate at 0.5% is way below a neutral level and the BoE has a long way to go before getting anywhere near this level. It could act this year and gradually start raising interest rates to lessen the continued build-up of financial imbalances. The difficult action in the short-run to raise the base rate will help to support “healthy” economic growth in the long-run.
Emerging market (EM) fixed income posted its third negative performance year since 1998, driven by rising US Treasury yields, fears of tapering, and concerns around declining capital inflows from developed markets into emerging markets. A number of EM countries were also hindered by country-specific drivers such as slowing growth, decreasing productivity, twin deficits, and exposure to a slowing Chinese economy. EM fixed income still saw inflows for 2013 of $9.7bn, although this was way behind the $97.5bn inflows of 2012, and the asset class has seen outflows of around $40bn since May (source EPFR, JP Morgan).
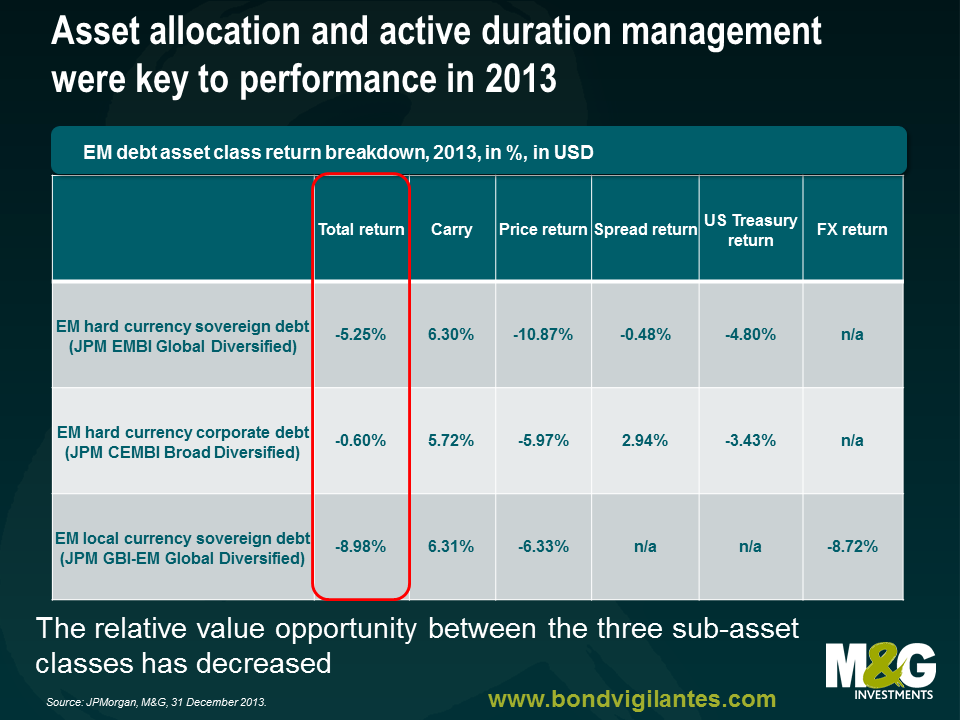
Within the asset class, EM corporate bonds outperformed EM sovereign debt, with the former returning -0.6% and the latter -5.3% in 2013. This sub-asset class benefited from its shorter duration and tangential spill-over (or higher correlations?) from the stronger performance in global investment grade and high yield credit. EM corporate bond spreads, measured by the JP Morgan Corporate EMBI index, are now flat to hard currency sovereign debt which translates into a narrowing of 66 bps since the beginning of 2013.
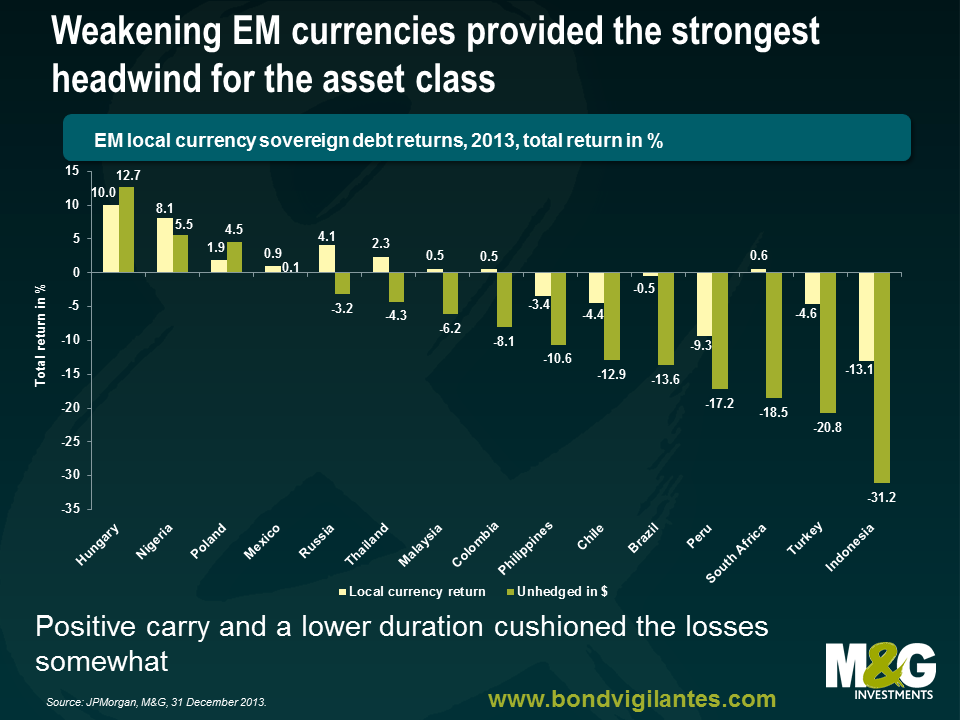
Therefore, the asset allocation between EM sovereigns in both hard and local currency and EM corporates was one of the key calls for performance in 2013. Sovereign bonds underperformed over the year, with hard currency debt delivering a negative return of -5.3%, also due to the fact that it has the longest duration of all three sub-asset classes. However, local currency debt faced a particularly challenging year, delivering a negative total return of -9.0% which can be mostly attributed to the foreign exchange component of the bond, while the carry, i.e. the additional return due to higher local interest rates, compensated for the back-up in yields.
It is worth though having a closer look at the underlying dynamics as it helps to further understand the drivers of performance in 2013 and how 2014 will be different.
1) Most of the negative return of EM hard currency sovereign debt was driven by rising US Treasury yields and less by the perceived deterioration in EM credit profiles and widening of EM spreads.
The negative impact of widening credit spreads was modest, contributing -0.5% to the total return of hard currency sovereign debt as the chart above shows. To put this into perspective, spreads widened by 50 bps in 2013, while 10 year US Treasury yields backed up by 116 bps. Hence, duration management was key in 2013. With tapering priced in and the US Treasury forward curve pricing 10 year US Treasury yields at around 3.5% by year end, an additional backup in US rates should be less pronounced in 2014 than it was in 2013. The risk to this outlook is for stronger than expected data and/or worsening of inflation expectations, which is not priced in at the moment. That is, a bear flattening of the US curve through pushing forward the anticipated hikes in the Fed Funds rate (currently priced for 2015 and beyond) is a risk to be monitored carefully.
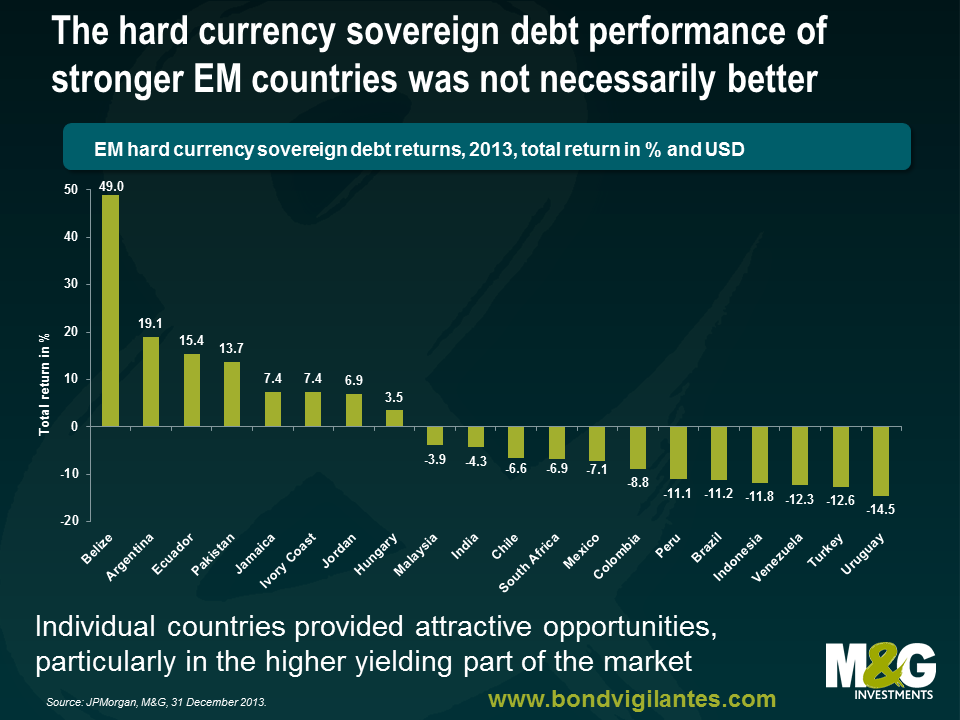
2) The performance of hard currency sovereign debt was not necessarily better for countries that are perceived to be more resilient, i.e. have lower debt levels, stronger liquidity, fiscal and current account position, sustainable growth as well as reform momentum, than for those that are perceived to be more vulnerable.
Let’s take Mexico, one of the stronger emerging market economies, and South Africa, an increasingly vulnerable emerging market country, as an example. Mexican government debt denominated in hard currency returned -7.1%, while the total return for South Africa’s government bonds stood at -6.9%. One explanation is that the channel of adjustment in the current account deficit countries is weaker currencies and/or higher interest rates which may not be such a negative factor for sovereign debt spreads. Countries that allow for a free floating currency minimise net international reserve losses, which is supportive for the performance of hard versus local currency debt. In fact, the major performance difference between these two countries was precisely on their local currency debt (see below), where Mexico justifiably outperformed South Africa.
3) Another characteristic of 2013 was the outperformance of those bonds associated with higher credit risk, such as high yielders and frontier markets.
The JPMorgan Next Generation Markets Index (NEXGEM), an index for frontier market sovereign bonds rated BB+ and lower, returned +5.1% in 2013. This may seem counterintuitive given the recent change of sentiment towards EM assets, but it is refreshing that the market differentiated between the various emerging market issuers and rewarded the stable or improving credit profile of the weaker issuers with positive returns and re-priced deteriorating stories into negative returns. Argentina, for example, returned +19.1% on the delayed court decision regarding the holdouts, as well as on expectations for better economic policies with a new government in 2015. Venezuela, on the other hand, returned -12.3% on continued growing macroeconomic and political imbalances. In addition, Eichenberg and Gupta find that countries which allowed for large increases in their current account deficits and for a sharp appreciation of their currencies, saw indeed a stronger valuation correction, but also suggest that bigger and more liquid emerging markets experienced, generally speaking, more pressure on currency and debt valuations. Identifying the critical bottom-up, idiosyncratic factors was hence key in 2013 and will remain so in 2014, given the large rally we have seen in most of these frontier market bonds and, therefore, less favourable valuations.
4) Local currency debt was the key underperformer.
The bulk of the losses in emerging market debt issued in local currency was due to currency depreciation, which was one of the key transmission mechanisms in 2013 to potential lower capital flows into emerging markets. As such, various currencies will continue their move to fair value or undervaluation, if warranted, through 2014 as well. An eventual narrowing of current account deficits in countries that require an adjustment but do not face major structural rigidities, such as Brazil, India or Indonesia, should slow the depreciation pressure and, thus, performance in 2014 should not be as negative. That is, the balance of risks and market focus should then be centred on the capital account.
5) Positive carry and a lower duration have provided an anchor of support for local currency debt returns.
Local currency yields rose by 135 bps in 2013 to 6.85%, driven by currency weakness (South Africa), monetary policy tightening (Brazil, Indonesia), fiscal deterioration and inflation risk (Brazil), political and external account concerns (Turkey), as well as a higher floor from US yields. The carry, however, and a lower average duration on local currency debt, for which a comparable index has a duration of 4.6 years, allowed for the total return in local currency terms to be flat in 2013 and provide a better cushion for 2014.
6) Political risks were pretty muted in 2013 (with a few exceptions), but are likely to increase significantly in 2014.
Though countries like Turkey and Ukraine as well as the Middle East faced serious political crises, politics did not play a major role for the asset class in 2013. However, 2014 will be a year in which the return impact from idiosyncratic political events in emerging markets could increase substantially. Twelve of the major emerging market countries will have presidential and/or parliamentary elections, including all the ‘fragile 5’ countries, i.e. Brazil, India, Indonesia, South Africa and Turkey – and we will comment in more detail on this in a forthcoming blog closer to the election dates. The prospect of these elections could potentially reduce the net capital flows into these economies on a temporary basis, such as through local capital flight, delayed foreign direct investment (FDI) and/or portfolio flows as well as increased demand for foreign exchange (FX) or credit default swap (CDS) hedging etc., pending the outcome of the elections and subsequent prospects for future economic policy and support for reforms.
In summary, the asset allocation between EM sovereigns in both hard and local currency and EM corporates should be less important in 2014 than it was in 2013, given that the forward yield curve implied levels for US interest rates is already pricing 10 year yields in the mid 3% range. Furthermore, the relative value opportunity between these three asset classes has decreased after the underperformance of sovereign debt in 2013 and the narrowing of EM corporate bond spreads on the back of the rally in global credit in both the investment grade and high yield space. In addition, valuations for local currency debt look better, also on the basis of the exchange rate adjustments seen in 2013 and higher yields. In other words, we expect the difference on performance, on aggregate, to be more muted at the top down level.
On the other hand, idiosyncratic EM events, including political events, will become more relevant, which makes bottom up security selection and timing, i.e. the repositioning through bouts of volatility, even more critical in 2014 . Global macro factors and drivers of global risk appetite, such as economic growth and inflation, China’s rebalancing efforts, commodity prices as well as developments in the Eurozone, will remain equally important.
Thanks for all the entries to the 2013 quiz. The winner is Adam Weidner who gets to choose where we send a £200 charity donation, and a copy of Morrissey’s autobiography. We’ll be in touch, and tweet the charity name on @bondvigilantes. The five runners up who win a Moz book are Jonathan Moore, Mark Nelson, Adrian Coates, Joshua Giersch and Richard Milne. Have a great 2014.
1. “The band the Beatles could have been” was Wings, according to Alan Partridge. Here’s Band on the Run.
2. French Club Olympique de Marseille, winners of the Champions League in 1993, play in blue and white and took their colours from the Greek flag in honour of the ancient founders of the city of Marseille who came from Phocaea.
3. Duran Duran had three of their members with the surname Taylor (John, Roger, Andy). They were not related.
4. Noli timere – “do not be afraid” – was the final thing said (actually texted to his wife) by poet Seamus Heaney, who died this year.
5. If you swap the soda water for gin in an Americano, you end up with a Negroni.
6. Once 21 million bitcoins have been made, production automatically stops. We’re about halfway towards that total now.
7. “I am not in the office at the moment. Send any work to be translated”.
8. North Korea’s Kim Jong-il, according to his official biography, hit 11 holes in one at his first attempt at golf, and then retired from the sport.
9. Graced fair wound is an anagram of FORWARD GUIDANCE.
10. The KLF burnt a million quid on the Isle of Jura in 1994.
http://www.youtube.com/watch?v=o4uQtOQwLGE
11. The best-selling vehicle in the US in 2013, was, as usual, be the F-Series pickup.
12. Incoming Fed chief Janet Yellen said that letting inflation rise could be a “wise and humane policy”.
13. George W. Bush wrote that note asking for a bathroom break.
14. Music video number 1 was Michael Jackson’s Billie Jean.
15. Music video number 2 was Fatboy Slim’s Weapon of Choice.
16. Music video number 3 was Madonna’s Music.
17. I’m guessing there are many different estimates of the US government’s net P&L on the GM, AIG and Citibank positions that it took in the middle of the credit crisis. But by the power of Google I come up with a $10 billion loss on GM, a $22.7 billion profit on AIG, and a $15.5 billion profit on Citibank, making a net profit of $28.2 billion. But we accepted anything near that or with a sensible explanation, especially if you provided a spreadsheet and NPVed some cashflows.
18. This is the marker at the top of Mont Ventoux in Provence. Are you bored yet with my tales about my awesome cycle up the tough route this year – ruined for me only by the news that someone else did the same climb on a Boris Bike recently?
19. Verizon issued $49 billion of corporate bonds this year, the biggest deal ever.
20. The national anthem of the Netherlands spells out the name of the founder of its royal house, Wilhemus, through the first letter of each stanza.


Sign up to the Bond Vigilantes mailing list to ensure you never miss a great article from our expert Bloggers. We will email all new articles to your inbox, meaning you can stay on top of the world of Bonds.
I confirm that I would like to receive information about Bond Vigilantes and products and services from M&G Securities Limited.
We will use the email address and personal data you have shared with us to send you this information. For existing customers, submitting your contact details and requesting to receive this information from us, will replace any earlier choices you have made in respect of marketing information.
You can unsubscribe from marketing at any time, at which point we will not send any further marketing information to you, by selecting the unsubscribe link in all communications.


