
Rolldown
A dispatch from the number crunchers – Yield curve rolldown
By Matthew Russell
15 April 2026

Seven years since the start of the financial crisis and it’s ever harder to dismiss the notion that Europe is turning Japanese.
Now this is far from a new comparison, and the suggestions made by many since 2008 that the developed world was on course to repeat Japan’s experience now appear wide of the mark (we’ve discussed our own view of the topic previously here and here). The substantial pick-up in growth in many developed economies, notably the US and UK, instead indicates that many are escaping their liquidity traps and finding their own paths, rather than blindly following Japan’s road to oblivion. Super-expansionary policy measures, it can be argued, have largely been successful.
Not so, though, in Europe, where Japan’s lesson doesn’t yet seem to have been taken on board. And here, the bond market is certainly taking the notion seriously. 10 year bund yields have collapsed from just shy of 2% at the turn of the year and the inflation market is pricing in a mere 1.4% inflation for the next 10 years; significantly below the ECB’s quantitative definition of price stability.
So just how reasonable is the comparison with Japan and what could fixed income investors expect if history repeats itself?
The prelude to the recent European experience wasn’t all that different to that of Japan in the late 1980s. Overly loose financial conditions resulted in a property boom, elevated stock markets and the usual fall from grace that typically follows. As is the case today in Europe, Japan was left with an over-sized and weakened banking system, and an over-indebted and aging population. Both Japan and Europe were either unable or unwilling to run countercyclical policies and found that the monetary transmission mechanism became impaired. Both also laboured under periods of strong currency appreciation – though the Japanese experience was the more extreme – and the constant reality of household and banking sector deleveraging. The failure to deal swiftly and decisively with its banking sector woes – unlike the example of the US – continues to limit lending to the wider Eurozone economy, much as was the case in Japan during the 1990s and beyond. And despite the fact that Japanese demographics may look much worse than Europe’s do today, back in the 1990s they were far more comparable to those in Europe currently.
Probably the most glaring difference in the two experiences is centred around the labour market response. Whereas Eurozone unemployment has risen substantially post crisis, the Japanese experience involved greater downward pressure on wages with relatively fewer job losses and a more significant downward impact on prices.
With such obvious similarities between the two positions, and whilst acknowledging some notable differences, it’s surely worthwhile looking at the Japanese bond market response.
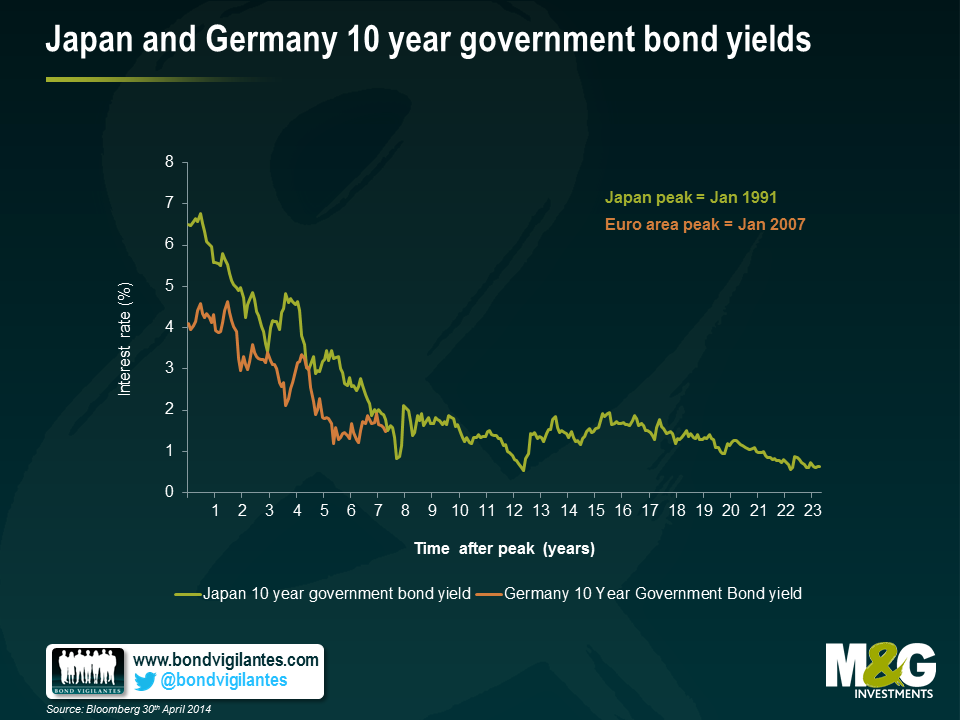
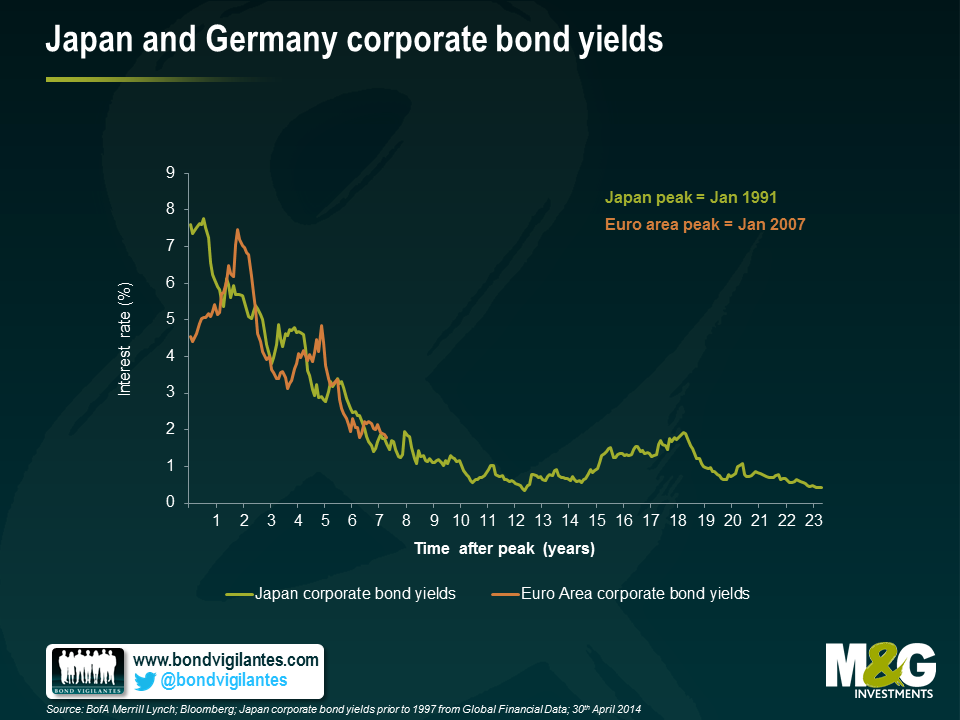
As you would expect from an economy mired in deflation, Japan’s experience over two decades has been characterised by extremely low bond yields (chart 1). Low government bond yields likely encouraged investors to chase yield and invest in corporate bonds, pushing spreads down (chart 2) and creating a virtuous circle that ensured low default rates and low bond yields – a situation that remains true some 23 years later.
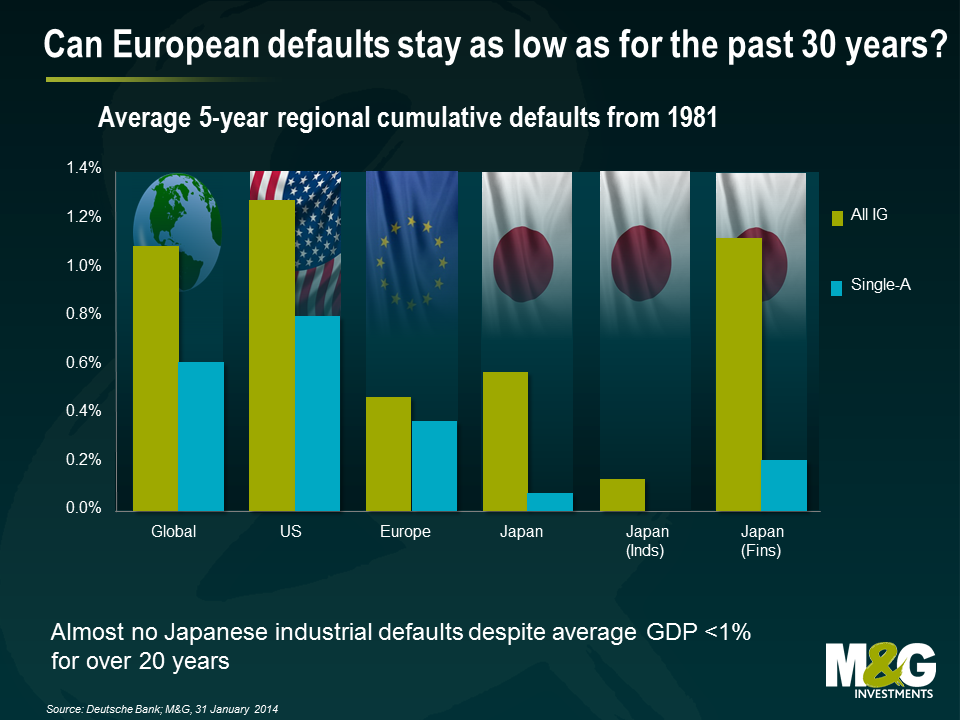
As an aside, Japanese default rates have remained exceptionally low, despite the country’s two decades of stagnation. Low interest rates, high levels of liquidity, and the refusal to allow any issuers to default or restructure created a country overrun by zombie banks and companies. This has resulted in lower productivity and so lower long-term growth potential – far from ideal, but not a bad thing in the short-to-medium term for a corporate bond investor. With this in mind, European credit spreads approaching historically tight levels, as seen today, can be easily justified.
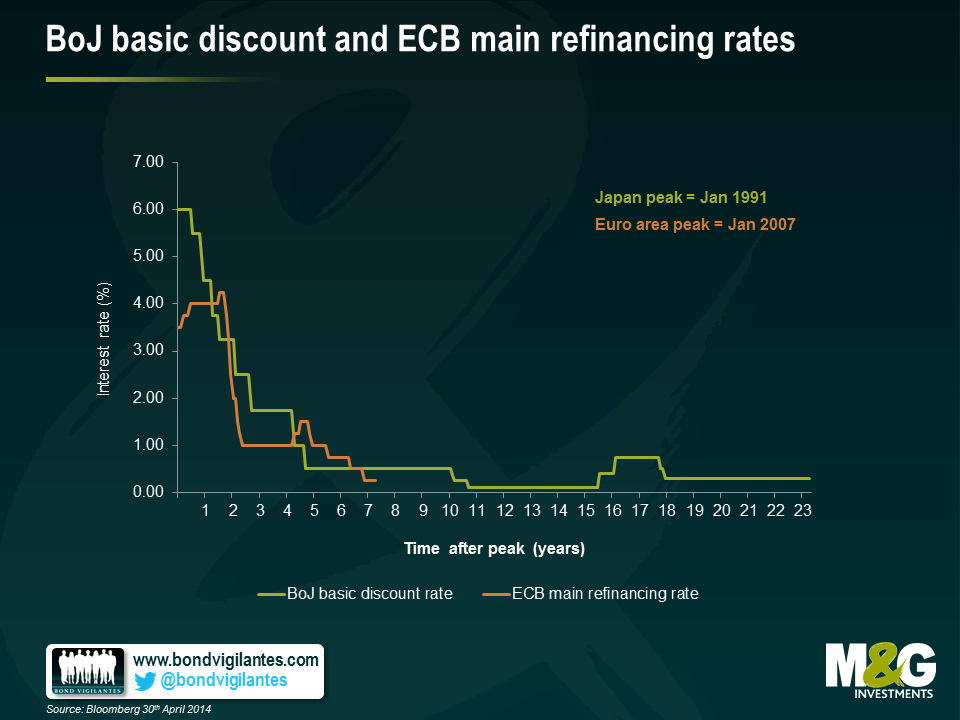
Europe currently finds itself in a similar position to that of Japan several years into its crisis. Outright deflation may seem some way off, although the risk of inflation expectations becoming unanchored clearly exists and has been much alluded to of late. Japan’s biggest mistake was likely the relative lack of action on the part of the BOJ. It will be interesting to see what, if any response, the ECB sees as appropriate on June 5th and in subsequent months.
Though it is probably too early to call for the ‘Japanification’ of Europe, a long-term policy of ECB supported liquidity, low bond yields and tight spreads doesn’t seem too farfetched. The ECB have said they are ready to act. They should be. The warning signs are there for all to see.
There has been a lot of comment recently on the slimming down at Barclays investment bank. This has generally been couched as a change in business plan, with less of a focus on fixed income, commodities and derivatives, to a less capital intensive more traditional model. One of the interesting things for us is that this is not an idiosyncratic event, but part of a trend.
Barclays, like RBS, UBS, and Credit Suisse, has decided to reverse its pre crisis ambition of being a dominant player in the global fixed income market. From a pure opportunity set this seems strange as the huge increase in volume of outstanding corporate and government debt is potentially an enormous business opportunity. So why the retreat?
Like any company that exits a business line, presumably it’s because Barclays believes it is or will be less profitable. Despite the expansion of fixed income markets, banks are less able to make money due to a change in their cost of capital. Regulators have effectively reduced the banks’ ability to make money, via constraints on leverage ratios, which are a good thing from a bondholder’s perspective but increases their effective costs and reduces profitability.
However, this banking trend also has a European flavour. The firms scaling back their ambitions are all non US banks. Why the difference across the Atlantic given both economic blocks have faced harsher regulation and more capital requirements? We think North American banks have a natural advantage versus their “alien” investment bank counterparts in three ways.
Firstly they operate in the largest capital market in the world. This gives them strong economies of scale compared to those whose ‘national champion’ home market advantage is in smaller markets.
Secondly, even when comparing the big US capital markets with the second largest Euro capital markets, the European players have a disadvantage. The euro is a single market, but banks are constrained nationally. They are all large relative to their domestic economy, which makes the home regulator understandably nervous, imposing higher capital, leverage and loss-absorbing debt requirements on the banks in their jurisdiction. This is less of an issue in the US, where the geographic regulated area and the currency coincide for a significantly greater percentage of their business. Therefore the US regulator can be more relaxed about having large banks.
Thirdly, globalisation is also resulting in more dominance from US non-bank corporations, whether that be through their innovation, or their own natural economies of scale in the US. This can be seen over the last year with Vodafone selling its wireless business to Verizon, Liberty Global buying Virgin Media, and the potential attempts by Pfizer to take control of Astra Zeneca. It is natural for US businesses to work with US banks, and the development of large corporations with large funding needs means there needs to be a large capital market. All these things point to a reinforcing increase in the relative size of the US capital markets. This is one of the factors that has been driving the increase in the relative sizes of the European and US investment grade bond markets, as illustrated in the chart below.

Barclays’ reduced ambition is part of a banking trend. We have seen these kind of moves before in the banking sector where bank management move together in the same direction. The lesson from these recent moves is that globalisation will not only change the face of the world economy, but will benefit those nations not only who are efficient and innovative, but have the largest efficient domestic markets, thus allowing economies of scale. Good news for the US listed companies, and a potential issue for the rest of the world.
On 29th April, Energy Future Holdings Corp (the energy business formerly known as TXU) filed for Chapt 11 bankruptcy, listing $49.7bn in debt liabilities. This came after several months of back and forth negotiations between various creditors and the owners of the business. As such the filing was widely expected and the market had been pricing this in.
One thing that was quite an eye-opener, however, was the huge range of recovery values on the various tranches of debt issued by the business. Part of this was due to the inherent complexity of the company’s capital structure. The company had 14 separate major bond issues, issued out of a range of different entities with differing claims on the company’s various assets as shown below:
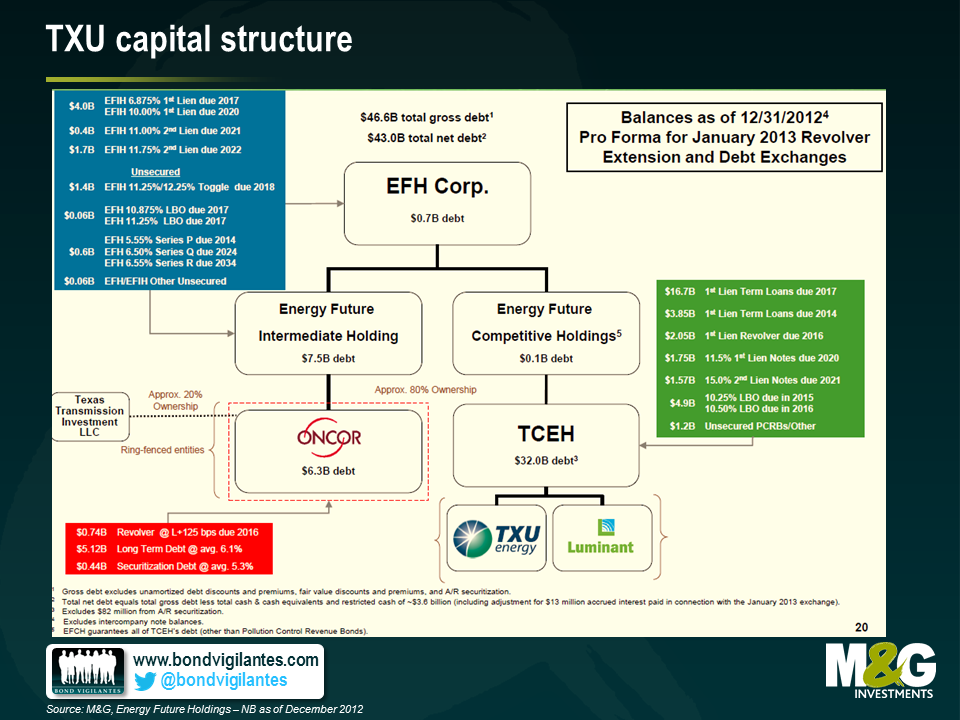
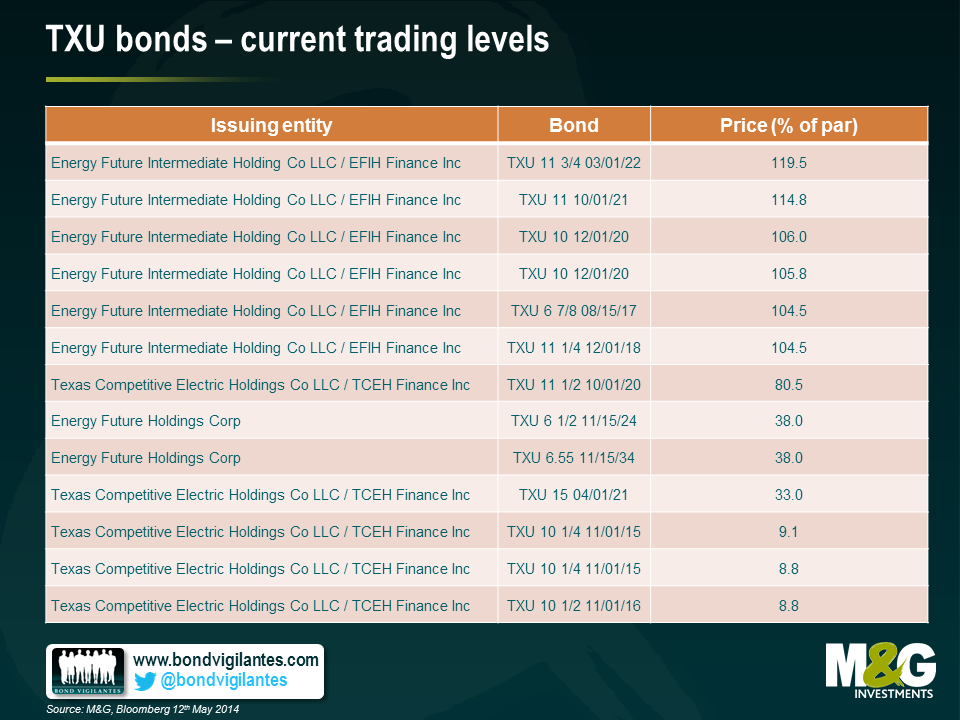
This great diversity of debt and different legal entities in the capital structure has meant similar differentiation in recovery values for the bonds. Below are some of the trading levels we currently see in the market for the more liquid bonds. At one end of the extreme, the TXU 11.75% 2022’s are currently trading at 119.5% of face value whilst the TXU 10.5% 2016’s languish at 8.8 cents in the dollar. The difference in price reflects the bonds’ relative position in the queue of claims for the company’s assets.
The difference of experience in terms of total returns from these bonds is also stark. Holders of the 11.75% 2022 bonds enjoyed a capital return of c 20% over the past two years (on top of the 11.75% coupon each year), whereas holders of the 10.25% 2015 bonds have been hit with a capital loss of c.70%.
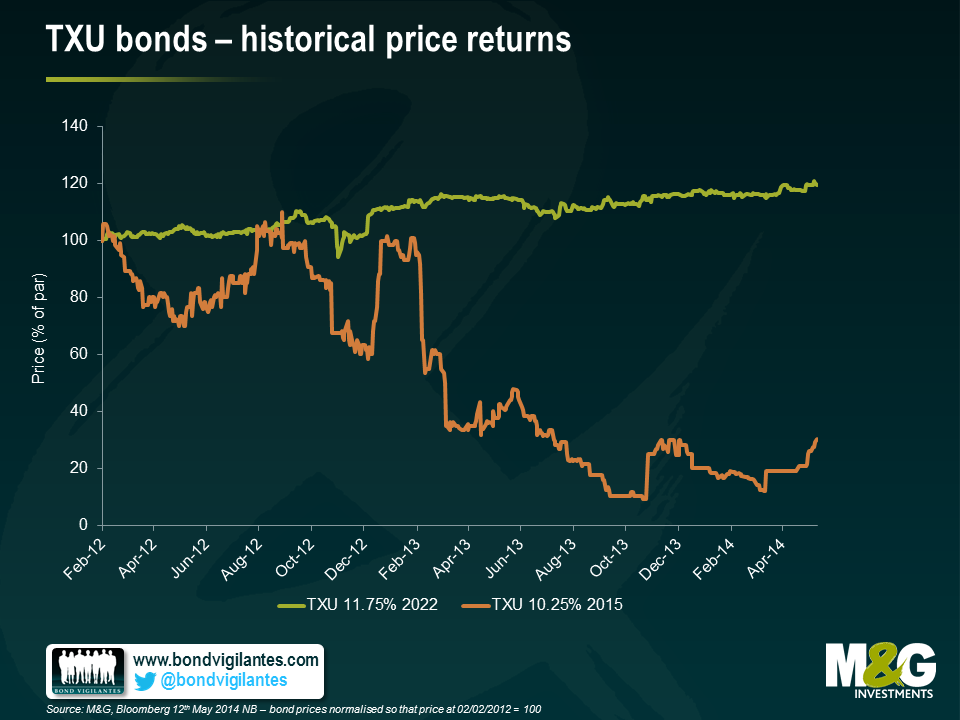
What we think this illustrates very well is that seniority and position in a capital structure has a major impact when determining potential downside for high yield investors. Indeed this factor can often be more important in the event of a default than the quality and credit worthiness of the underlying borrower. Additionally, and somewhat counter-intuitively, it also shows that bondholders can still experience positive returns even if the business they have lent to goes bankrupt.
Whilst the TXU bankruptcy is one of the echoes of the last LBO frenzy of 2006 and 2007, we believe that where you invest in the capital structure will also be important going forward. When default rates do eventually rise from their currently low levels, investing in bonds that rank senior in a capital structure will be one way to limit the potential downside of a high yield portfolio.
A few of the M&G bond team recently visited New York and Chicago on a research trip. We put together a short video to share some of our thoughts regarding US credit markets. A particular focus is the U.S. high yield market where we highlight some sector themes. We also consider the potential impact on U.S. credit spreads when the Fed starts to raise interest rates.
As is usually the case on 1 May, there was a plethora of articles and commentary on the “sell in May and go away” effect. If you are unfamiliar with this highly sophisticated trading strategy, it involves closing out any equity exposure you may have on 30 April and re-investing on 1 November. Historically, U.S. equities have underperformed in the six-month period commencing May and ending in October, compared to the six-month period from November to April. No one knows why this seasonal pattern exists, but some theories include lower trading volumes in the summer holiday months and increased investment flows when investors come back from holidays.
With this in mind, we thought it might be interesting to see if the same effect exists in European fixed income markets. In order to identify the sell in May effect, we generated total returns on a monthly basis for a portfolio of European government, investment grade and high yield bonds. We then generated a total return for a portfolio that was invested between the months of November and April and compared this with a portfolio that was invested between the months of May and October. In order to generate the maximum number of observations possible, we went back to the inception of the respective Merrill Lynch Bank of America indices. The results are below.
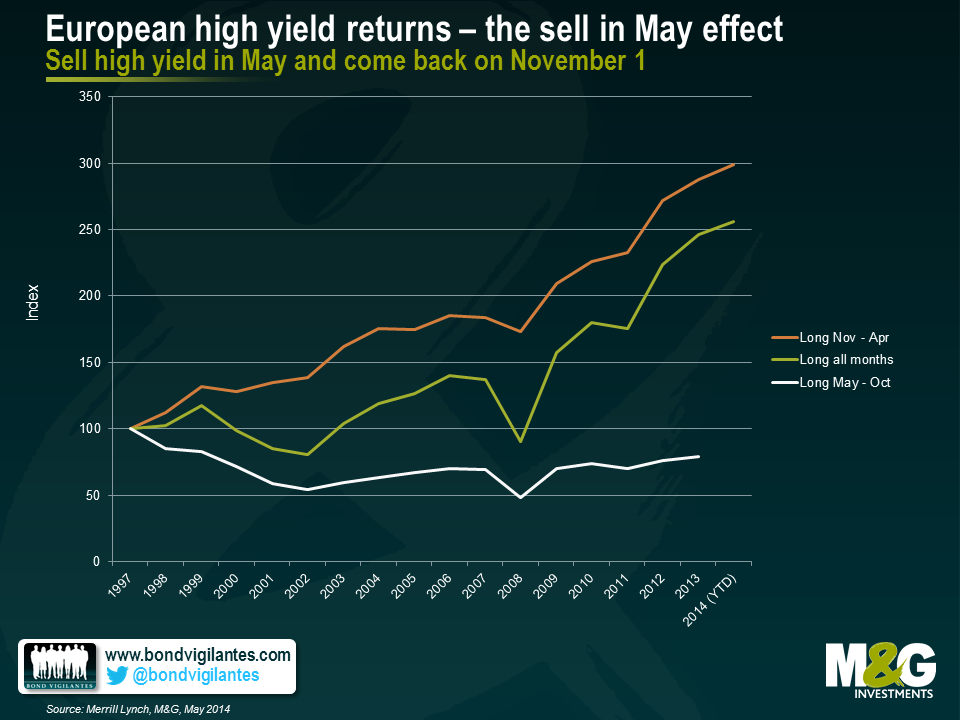
There appears to be a seasonal effect in European high yield markets. This is the fixed income asset class that is most correlated to equity markets, and the analysis shows that a superior return was generated by only being invested between the months of November and April (199% total return). In fact, this strategy substantially outperformed a strategy of being invested over the whole period (1997 – April 2014). If an investor chose to only invest between the months of May and October, they would have suffered a 21% loss over the past 16 years.
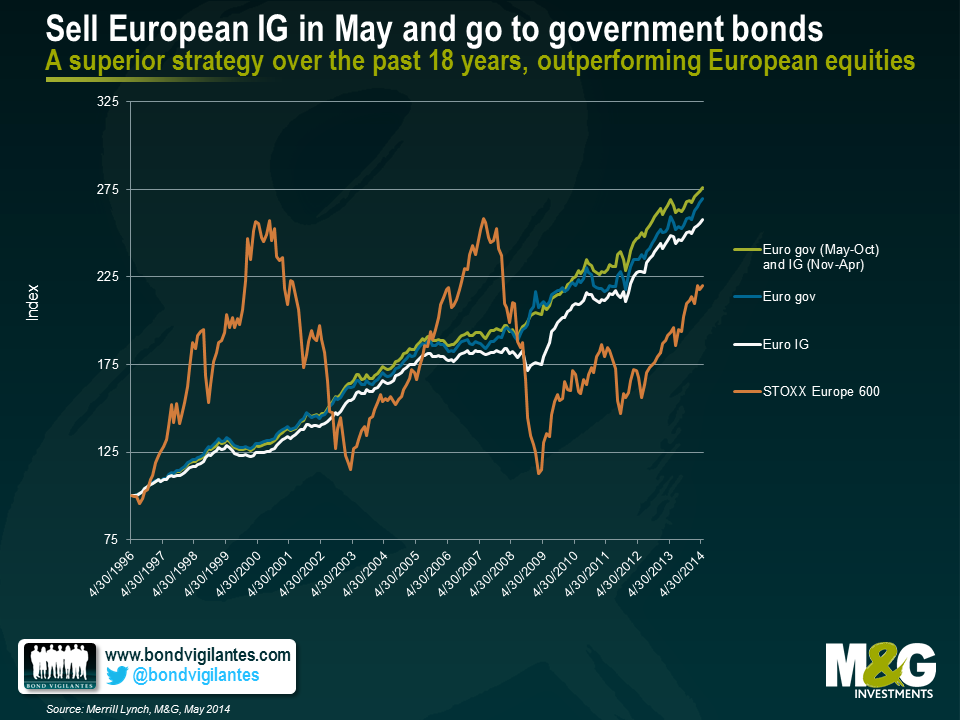
The natural extension of this analysis is to gauge how a trading strategy that was fully invested in European government bonds between the months of May and October and fully invested in European investment grade between November and April would have performed over the past 18 years. We can then assess how this strategy would have performed relative to portfolios that were fully invested in European government bonds, European investment grade corporate bonds and European equities only. The results show that a strategy of selling investment grade assets in May and buying government bonds has produced superior returns equal to 5.9% per annum, outperforming European equities by 56% in total or 2.5% p.a.
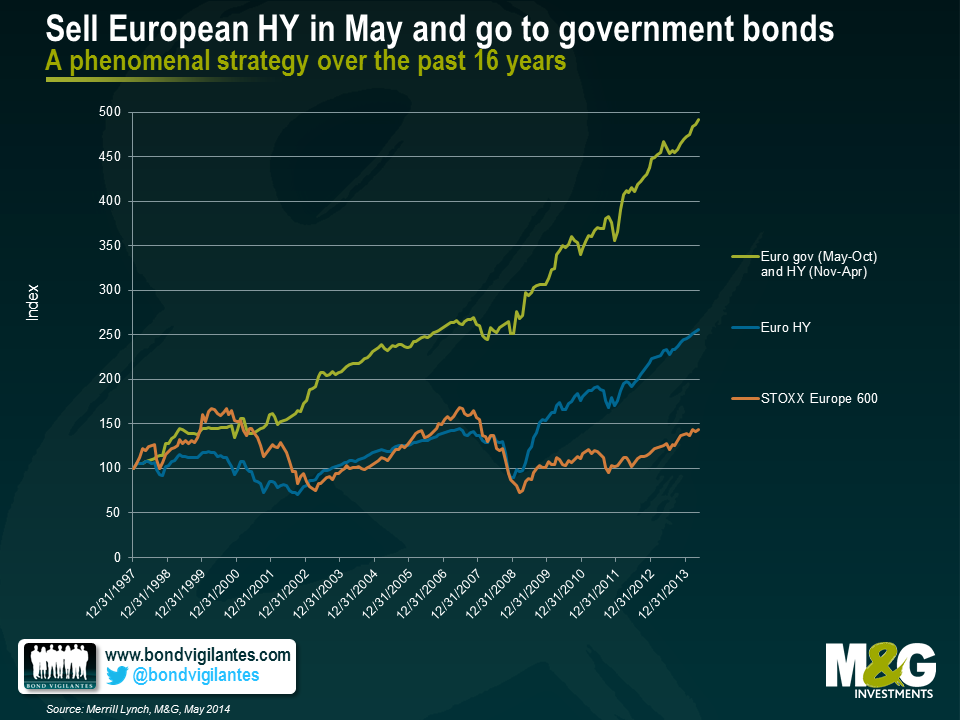
The above chart shows the same analysis, this time looking at how the strategy would have performed in total return terms but we have replaced European investment grade exposure with European high yield. Following this strategy would have generated an annualised return of around 10.5% or 391% over 16 and a bit years. This is far superior to the returns on offer in the European high yield and European equity markets over the same time period, which were 155% and 43% respectively.
Our analysis shows that there is a strong seasonal effect evident in European high yield markets, where returns are more volatile and there can be large upside and downside contributions due to fluctuations in the capital value of high yield bonds. However, it should be acknowledged that the results have been biased by the fact that major risk-off events (like Lehman Brothers, the Asian financial crisis and the Russian financial crisis for example) have generally occurred between the months of May and October. Nonetheless, historical total returns suggest that there is a seasonal effect in European high yield markets that investors should probably be aware of. Ignoring transaction costs or tax implications which would eat into any total returns, a strategy of selling investment grade or high yield corporate bonds in May and buying government bonds until November would have produced superior returns relative to European government bonds, investment grade corporate bonds, high yield corporate bonds and European equities.
Whilst it is always dangerous to base a trading strategy around a nursery rhyme, based on historical total returns there does appear to be a bit of sense in selling risk assets in May, retreating into government bonds which would likely benefit most in a risk-off event, and adding risk back into fixed income portfolios in November. But of course, another old saying still rings true – past performance is not a guide to future performance.


Sign up to the Bond Vigilantes mailing list to ensure you never miss a great article from our expert Bloggers. We will email all new articles to your inbox, meaning you can stay on top of the world of Bonds.
I confirm that I would like to receive information about Bond Vigilantes and products and services from M&G Securities Limited.
We will use the email address and personal data you have shared with us to send you this information. For existing customers, submitting your contact details and requesting to receive this information from us, will replace any earlier choices you have made in respect of marketing information.
You can unsubscribe from marketing at any time, at which point we will not send any further marketing information to you, by selecting the unsubscribe link in all communications.


