
Rolldown
A dispatch from the number crunchers – Yield curve rolldown
By Matthew Russell
15 April 2026

After yesterday’s poor U.S. GDP number and despite Mark Carney’s seemingly dovish testimony before the Treasury Select Committee, the Bank of England is increasingly looking like it will be the first of the major central banks to hike rates. At this stage, the BoE can retain its dovish stance because inflation is not an issue. However, in an environment of falling unemployment, early signs of a pick-up in wage inflation, rising house prices and stronger economic growth, consumers and markets may increasingly begin to focus on inflation. In anticipation, we think now is a good time to compare the inflation forecasting performance of markets and consumers.
In the graphs below we have compared UK RPI bond breakevens (a measure of market inflation expectations) with the Bank of England’s Gfk NOP Inflation Attitudes Survey (i.e. a UK household survey with over 1900 respondents consisting of nine questions on expectations for interest rates and inflation). An important point to note is that the analysis compares realised inflation (% yoy) with what survey expectations and breakeven rates indicated 2 years before.
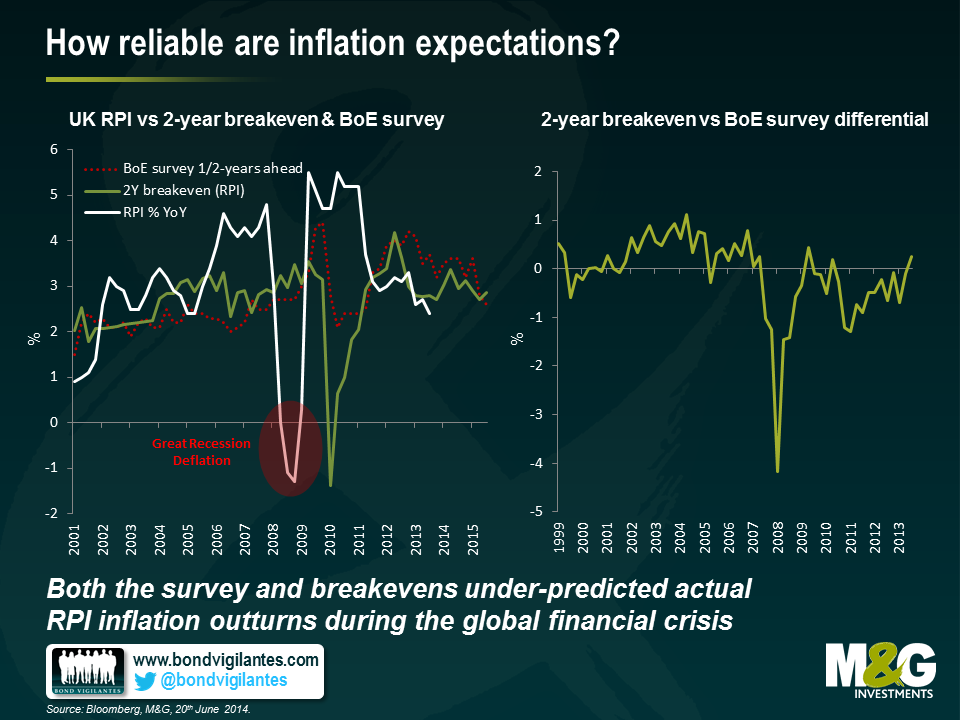
The comparison presents a number of interesting results:
Unexpected deflation: Both the survey and breakevens underestimated actual RPI inflation outcomes between 2006-2008 (in other words, nobody anticipated the inflationary shock coming from higher commodity/energy prices). In 2008, UK RPI was rising at an annual rate of 5.2% as high oil prices were feeding through into higher energy bills. Market and consumer inflation expectations largely ignored the higher inflation numbers, a sign the central bank inflation targeting credibility remained strong.
UK RPI turned negative in 2009 as the world plunged into recession and the BOE cut interest rates. The market eventually began to price in deflation but only after RPI turned negative. For example, in November 2008 the 2 year breakeven was -1.4%, the actual RPI print in November 2010 was 4.7%. Owing 2 year gilt linkers relative to conventional 2 year gilts directly after the financial crisis was a great trade.
Deflation (and recessions) appear particularly hard to forecast, for consumers and markets alike. This is because consumers and markets tend to anchor their future expectations off current inflation (and growth) readings.
Post-crisis unanchoring: Consumer inflation expectations generally underestimated realised inflation up until the global financial crisis, and has overestimated it since then, a possible sign that the crisis-recession years may have affected consumer views on the BoE’s commitment to fight inflation. Between 2000 and 2009, 2 year-ahead expected inflation averaged 2.5%. Since 2009, it has averaged 3.4%, almost one percentage point higher; suggesting a lower level of confidence that price stability will be achieved and also reflecting the higher RPI prints post 2009.
Surprisingly similar forecasts: Breakeven and survey rates differed only slightly over the sample period, with the largest gap (400bps) opening up in October 2008 after the Lehman crash. This was probably caused by the forced unwind of leveraged long inflation trades combined with a huge flight to quality bid for nominal government bonds, which distorted the market implied inflation rate. The average differential through the period (excluding years 08-09) is just 8bps. Nevertheless, breakevens seem to track RPI better since consumer surveys are usually carried out on a quarterly basis whilst the former are traded and re-valued with higher frequency. This makes them better at capturing quick moves and turning points in inflation.
Future expectations: Over the next 2 years, both consumers and markets expect RPI to rise above the current level of 2.6%. With a 2.7% implied breakeven, 2-year gilt linkers look relatively inexpensive today.
Of course, breakevens are far from being a perfect measure of inflation, as they embed inflation and liquidity risks premia, but they do appear to be better predictors of future inflation relative to consumer surveys. That does not mean survey-based data does not provide us with useful information, and for this purpose we launched the M&G YouGov Inflation Expectations Survey last year (available here). Consumer inflation expectations affect a number of economic variables, including consumer confidence, retail spending, and unit labour costs. However, during inflection points, such as the one we may be going through at present and in a world of approaching shifts in monetary policy, the timeliness of breakevens could represent an advantage that makes it worthwhile to follow them carefully.
Things are looking pretty good for the global economy right now. The U.S. Federal Reserve is slowly reducing quantitative easing, China is continuing to grow at a relatively rapid pace, the Bank of England is talking about rate hikes, and the central banks of Japan and Europe continue to stimulate their respective economies with unconventional and super-easy monetary policy. The International Monetary Fund expects growth in the developed economies to pick-up from a 0.5% low in 2012 to almost 2.5% by 2015, while emerging market economies are expected to grow by 5.5%.
Of course, it is notoriously difficult to forecast economic growth given the complexity of the underlying economy. There are simply too many moving parts to predict accurately. This is why central banking is sometimes described as similar to “driving a car by looking in the rear-view mirror
With this in mind, it is prudent to prepare for a range of possible outcomes when it comes to economic growth. Given the consensus seems pretty optimistic at the moment, we thought it might be interesting to focus on some of the possible downside risks to global economic growth and highlight three catalysts that could cause a recession in the next couple of years. To be clear, there are an infinite range of unforeseen events that could possibly occur, but the below three seem plausibly the most likely to occur in the foreseeable future.
Risk 1: Asset price correction
There is no question that ultra-easy monetary policy has stimulated asset prices to some degree. A combination of low interest rates and quantitative easing programmes has resulted in fantastic returns for investors in various markets ranging from bonds, to equities, to housing. Investors have been encouraged by central banks to put their cash and savings to work in order to generate a positive real return and have invested in a range of assets, resulting in higher prices. The question is whether prices have risen by too much.
This process is likely to continue until there is some event that means returns on assets will be lower in the future. Another possibility is that a central bank may be forced to restrict the supply of credit because of fears that the economy, or even a market, is overheating. An example of this is the news that the Bank of England is considering macro-prudential measures in response to the large price increases in the UK property market.
In addition, there is a surprising lack of volatility in investment markets at the moment, indicating that the markets aren’t particularly concerned about the current economic outlook. Using the Chicago Board Options Exchange OEX Volatility Index, also known as the old VIX (a barometer of U.S. equity market volatility) as an example shows that markets may have become too complacent. Two days ago, the index fell to 8.86 which is the lowest value for this index since calculations started in 1986. Previous low values occurred in late 1993 (a few months before the famous bond market sell-off of 1994) and mid-2007 (we all remember what happened in 2008). The lack of volatility has been something that several central banks have pointed out, including the U.S. Federal Reserve and the Bank of England. The problem is, it is the central banks that have contributed most to the current benign environment with their forward guidance experiment, which has made investors relaxed about future monetary policy action.
If these events were to occur, we could see a re-pricing of assets. Banks suffer as loans have been given based on collateral that has been valued at overinflated prices. A large impact in currency markets is likely, as investors become risk averse and start to redeem assets. These events could spill over to the real economy and could therefore result in a recession.
Risk 2: Resource price shock
It appears that the global economy may be entering a renewed phase of increased volatility in real food and fuel prices. This reflects a number of factors, including climate change, increasing biofuel production, geopolitical events, and changing food demand patterns in countries like China and India. There may also be some impact from leveraged trading in commodities. There are plenty of reasons to believe that global food price shocks are likely to become more rather than less common in the future.
As we saw in 2008, these shocks can be destabilising, both economically and politically. In fact, you could argue that the Great Financial Crisis was caused by the spike in commodity prices in 2007-08, and the impact on the global economy was so severe because high levels of leverage made the global economy exceptionally vulnerable to external shocks. Indeed, each of the last five major downturns in global economic activity has been immediately preceded by a major spike in oil prices (as the FT has previously pointed out here). Commodity price spikes impact both developed and developing countries alike, with low-income earners suffering more as they spend a greater proportion of their income on food and fuel. There is also a large impact on inflation as prices rise.
A resource price shock raises a number of questions. How should monetary and fiscal policy respond? Will central banks focus on core inflation measures and ignore higher fuel and food prices? Will consumers tighten their belts, thereby causing economic growth to fall? Will workers demand higher wages to compensate for rising inflation?
Risk 3: Protectionism
After decades of increased trade liberalisation, since the financial crisis the majority of trade measures have been restrictive. The World Trade Organisation recently reported that G-20 members put in place 122 new trade restrictions from mid-November 2013 to mid-May 2014. 1,185 trade restrictions have been implemented since October 2008 which covers around 4.1% of world merchandise imports. Some macro prudential measures could even be considered a form of protectionism (for example, Brazil’s financial transactions tax (IOF) which was designed to limit capital inflows and weaken the Brazilian currency).
If this trend is not reversed, trade protectionism – and currency wars – could begin to hamper economic growth. Small, open economies like Hong Kong and Singapore would be greatly impacted. Developing nations would also be affected due to their reliance on exports as a driver of economic growth.
Many economists blame trade protectionism for deepening, spreading and lengthening the great Depression of the 1930s. Should the global economy stagnate, political leaders may face growing pressure to implement protectionist measures in order to protect industries and jobs. Policymakers will need to be careful to not repeat the mistakes of the past.
Economic forecasting is a tricky business. It is important that investors are aware of these risks that may or may not eventuate, and plan accordingly. The outlook may not be as rosy as the consensus thinks it is.
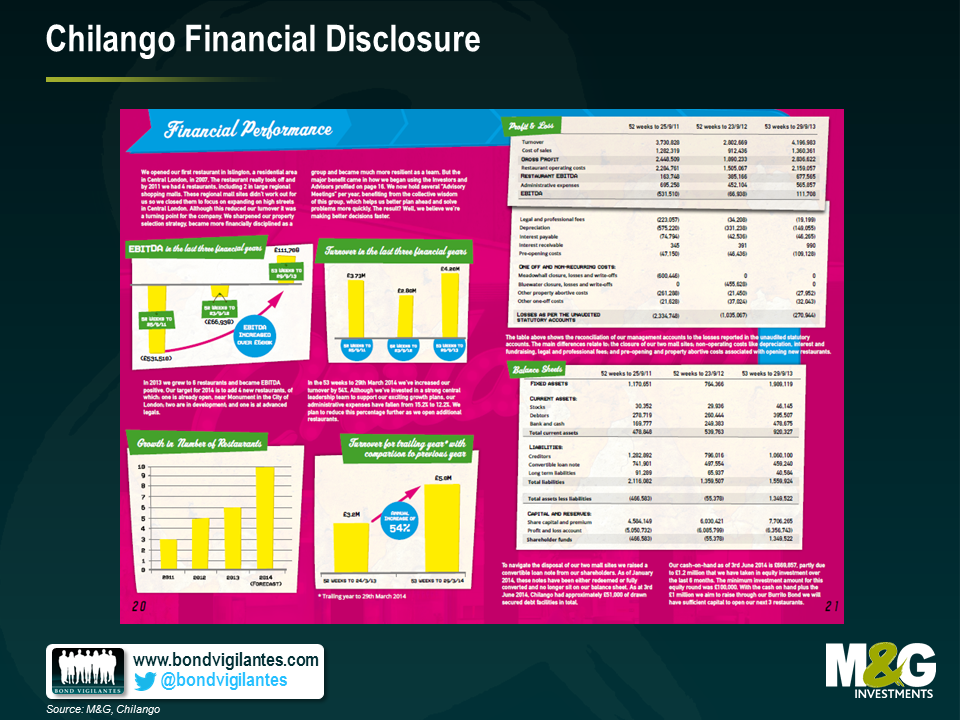
One of our local burrito vendors has been advertising a new 8% bond to its customer base. The company, Chilango, wants to raise up to £3m to fund expansion of its chain in central London. This will be done via a crowd sourced retail offering that’s already drawn some interesting coverage in the financial press. Having performed some extensive due diligence on the company’s products as a team, we can safely say they make a pretty good burrito. However, when we compare the bond to the traditional institutional high yield market, we have some concerns that investors should be aware of.
In contrast, the Chilango’s document is 33 pages long, with some fairly superficial financial disclosure. The photo below illustrates this comparative informational disadvantage and the relative lack of depth in financial information compared to a recent institutional high yield bond offering from Altice.

| 8% Bond, Callable at Par | |
| Years Outstanding | Total Return |
| 1 | 8% |
| 2 | 17% |
| 3 | 26% |
| 4 | 36% |
If the plan to open new branches goes well, the bond investor should be happy right? Wrong. If this happens, the company may well look like a less risky prospect and will be able to raise debt finance more cheaply. Let’s say a bank offers them a loan at 5%, they could then redeem the 8% bond early, diminishing the total return to bondholders (as per above), and save £90,000 a year on interest costs per year (assuming they issued £3m bonds). Again, call protection is a common feature of the institutional high yield market which protects investors in these situations.
| Bond | Price | Yield |
| Phones 4 U 10% 2019 | 90.5 | 12.7% |
| Towergate 10.5% 2019 | 98.5 | 10.9% |
| Matalan 8.875% 2020 | 101.5 | 8.5% |
| Average: | 10.7% |
By coincidence, the all in coupon of 10.7% is bang in line with the average of this (very limited) group of comparable bonds. However, I’d argue that the Chilango bonds should be significantly cheaper than the bonds above due to higher leverage, no liquidity, no call protection and the lack of disclosure. What should this differential be? Again, there is no scientific answer, but our starting point would probably be in the 15-20% range, and only then with some more certainty around the potential maturity of the bond and the ability to share in the future success of the company.
So, much as though we would all enjoy the tasty weekly coupons, our view is that like many of the so-called “retail” or “mini” bond offerings, the Chilango burrito bonds stack up poorly against some of the current opportunities in the institutional high yield market.
M&G has no financial interest in seeing this issue succeed or fail, either directly or indirectly.
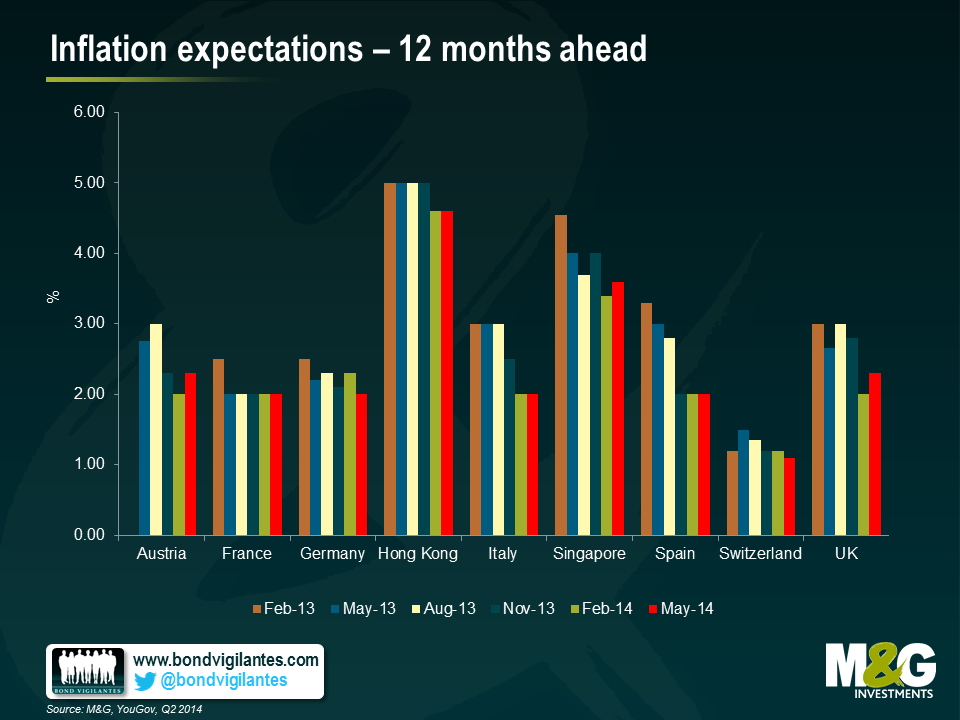
Today we are launching the next wave of the M&G YouGov Inflation Expectations Survey which aims to assess consumer expectations of inflation over the short and medium term.
With interest rates at multi century lows, central banks continue to inject large amounts of monetary stimulus into the global economy. Recent inflation rates in the US, UK and Germany have proved central to the current market focus, as actions from policymakers have become increasingly sensitive to inflation trends. This is true for the Fed and the BoE, as markets assess their possible exit strategies/timing, but especially for the ECB, whose last round of action is perceived to have been largely motivated by disinflationary pressures in the Euro area. In that context, market focus on inflation expectations has increased.
The results of the May 2014 M&G YouGov Inflation Expectations Survey suggest that both short and medium-term inflation expectations remain well anchored across most European countries.
Short-term expectations have risen from 2% to 2.3% in the UK as the country showed further signs of economic growth and reaccelerating wage pressure. On the other hand, inflation expectations for German consumers moderated in the last quarter as the downward trend in German HICP (1.1% YoY in April) may have added to the expectation that German inflation will remain subdued over the next year.
The general downward trend in short-term inflation expectations seems to have largely receded in all EMU countries and the UK. This may be somewhat surprising with much of Europe still experiencing low and falling inflation.
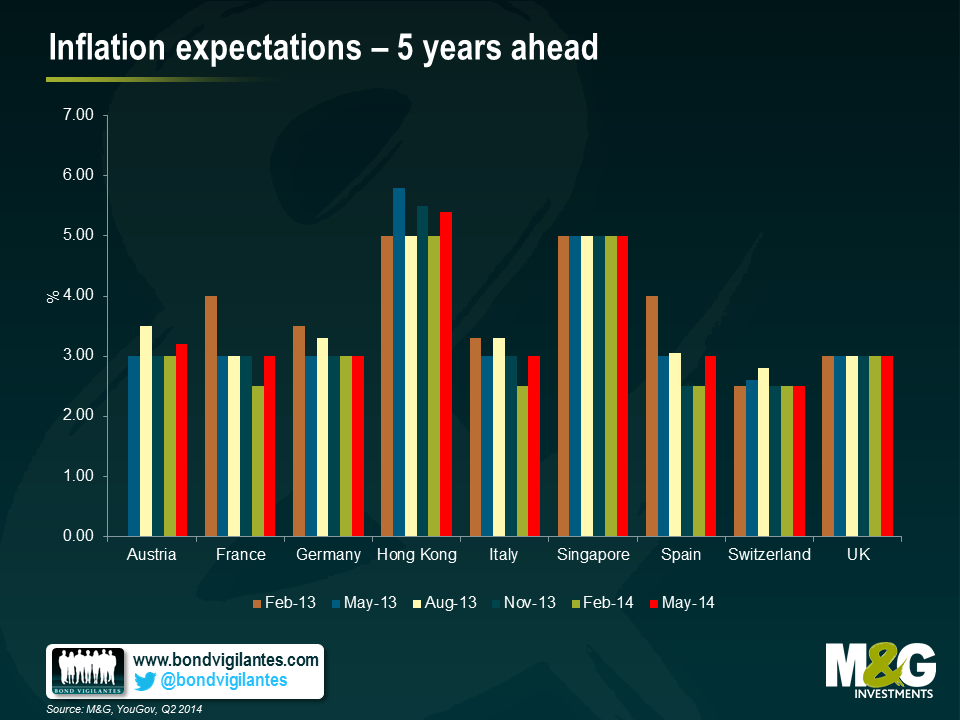
Over the medium term, inflation expectations remain above central bank targets in all countries surveyed, suggesting that consumers may lack confidence in policymakers’ effectiveness in achieving price stability. Over 5 years, UK inflation is expected to remain well anchored at a remarkably stable 3%. Despite recent low inflation rates across Europe, the majority of consumers in France, Italy and Spain continue to view inflation as a concern, and long-term expectations in those countries has risen back to 3%.
Whether or not you believe that the ECB moves to full government bond purchase quantitative easing this week (and the market overwhelmingly says that it’s only a remote possibility) the fact that German bund yields at the 2 year maturity remain positive is a bit surprising. The 2 year bund currently yields 0.05%, lower than the 0.2% it started the year at, but higher than you might have expected given that a) they have traded at negative yields in 2012 and 2013 and b) that the market’s most likely expected outcome for Thursday’s meeting is for a cut in the ECB’s deposit rate to a negative level.
The chart below shows that in the second half of 2012, and again in the middle of 2013, the 2 year bund yield was negative (i.e. you would expect a negative nominal total return if you bought the bond at the prevailing market price and held it to maturity), hitting a low of -0.1% in July 2012.
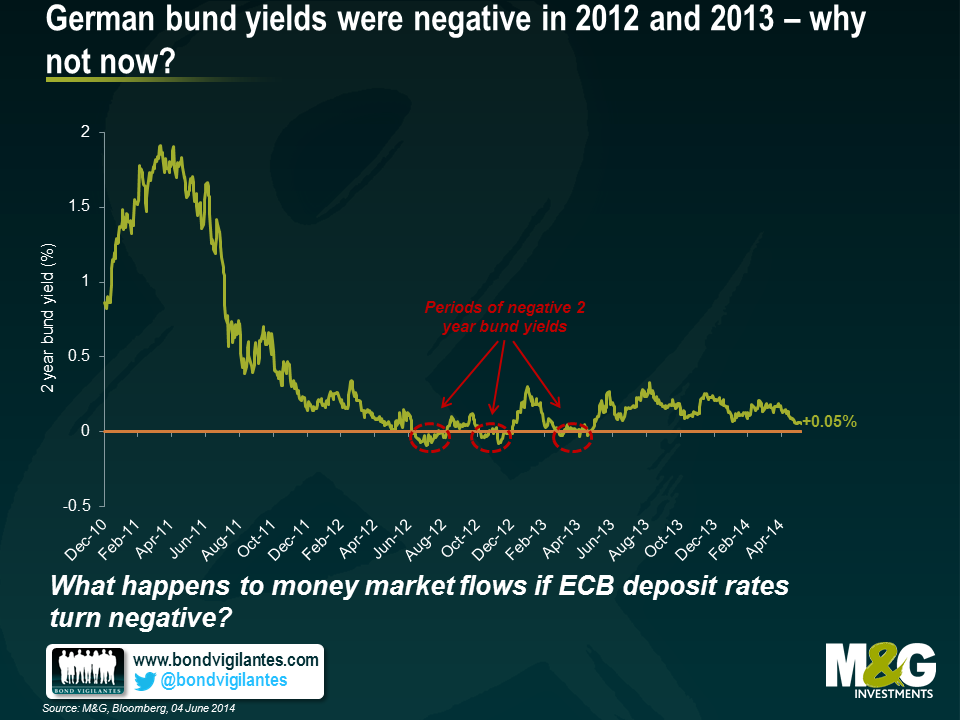
Obviously in 2012 in particular, the threat of a Eurozone breakup was at its height. Peripheral bond spreads had hit their widest levels (5 year Spanish CDS traded at over 600 bps in July 2012), and Target2 balances showed that in August 2012 German banks had taken Euro 750 billion of “safe haven” deposits from the rest of the euro area countries (mostly from Spain and Italy). So although the ECB refinancing rate was at 0.75% in July 2012 compared with 0.25% today, the demand for German government assets rather than peripheral government assets drove the prices of short dated bunds to levels which produced negative yields.
This time though, whilst the threat of a euro area breakup is much lower – Spanish CDS now trades at 80 bps versus the 600 bps in 2012 – the prospect of negative deposit rates from the ECB might produce different dynamics which might have implications for short dated government bonds. The market expects that the ECB will set a negative deposit rate, charging banks 0.1% to deposit money with it. Denmark successfully tried this in 2012 in an attempt to discourage speculators as money flowed into Denmark out of the euro area. Whilst the ECB refinancing rate is likely to remain positive, the cut in deposit rates might have significant implications for money market funds. David Owen of Jefferies says that there is Euro 843 billion sitting in money market funds in the euro area, equivalent to 8.5% of GDP. But what happens to this money if rates turn negative? In 2012, when the ECB cut its deposit rate to zero, several money market fund managers closed or restricted access to their money market funds (including JPM, BlackRock, Goldman Sachs – see FT article here). Many money market funds around the world guarantee, or at least imply, a constant or positive net asset value (NAV) – this is obviously not possible in a negative rate environment, so funds close, at least to new money. And if you are an investor why would you put cash into a money market fund, taking credit risk from the assets held by the vehicle, when you could own a “risk free” bund with a positive yield?
So whilst full blown QE may well be months off, if it ever happens, and whilst Draghi’s “whatever it takes” statement means that euro area breakup risk is normalising credit risk and banking system imbalances, the huge amount of money held in money market funds that either wants to find positive yields, or is forced to find positive yields by fund closures, makes it a puzzle as to why the 2 year bund yield is still above zero.


Sign up to the Bond Vigilantes mailing list to ensure you never miss a great article from our expert Bloggers. We will email all new articles to your inbox, meaning you can stay on top of the world of Bonds.
I confirm that I would like to receive information about Bond Vigilantes and products and services from M&G Securities Limited.
We will use the email address and personal data you have shared with us to send you this information. For existing customers, submitting your contact details and requesting to receive this information from us, will replace any earlier choices you have made in respect of marketing information.
You can unsubscribe from marketing at any time, at which point we will not send any further marketing information to you, by selecting the unsubscribe link in all communications.


