
Rolldown
A dispatch from the number crunchers – Yield curve rolldown
By Matthew Russell
15 April 2026

Say what you like about controversial whistleblowing website WikiLeaks and its embattled founder Julian Assange, but the organisation has lifted the lid on a number of rather glorious indiscretions alongside the more serious leak of military secrets that it has become notorious for.
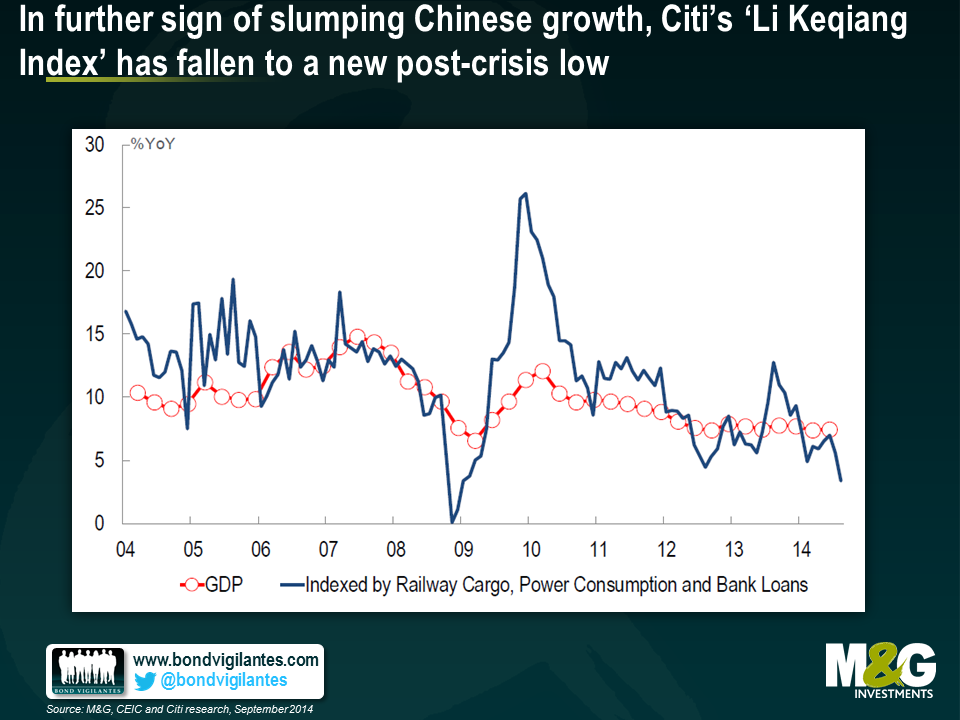
One such nugget to be revealed was how Li Keqiang – now Chinese premier, but at the time the lesser known head of Liaoning province’s communist party – admitted over dinner with the US ambassador to China in 2007 that the country’s GDP figures were “man-made” and therefore unreliable. Mr Li went on to say that instead, he focused on just three data points – electricity consumption, rail cargo volume and bank lending – when evaluating his province’s economic progress.
Citigroup have taken Mr Li at his word and have constructed an inspired ‘Li Keqiang Index’, using the three economic indicators mentioned above to give an insight into the country’s economic health under his premiership. And indeed, the index (see chart) does point to a significant slump that’s more pronounced than the decline in the official Chinese GDP numbers. This trend ties in with other data that investors have been focussing on, including the slump in commodity prices (although it’s important to remember that the price of an asset can fall not only due to a drop in demand, but also an increase in supply, and some big producers in iron and coal in particular have been ramping up supply).
Some might argue that the reliability of the data underlying the Li Keqiang Index may now also be compromised since his views on what does and doesn’t constitute reliable data first went public back in 2010. Regardless, the various data sources seem to be converging around the point we have been arguing for many years – namely, that China is on course for a fairly spectacular slowdown and that it’s hard to see how it won’t end badly, not least for the many countries that have become increasingly reliant on a strong Chinese economy and are now very vulnerable to Chinese economic weakness.
China’s investment/GDP ratio soars to a totally unsustainably 54.4%. Be afraid.
The Professor Michael Pettis China forecast: 3-4% real growth on average for the next decade. And that would be a good result
If China’s economy rebalances and growth slows, as it surely must, then who’s screwed?
Chinese housing market, not so magic – will the dragon run out of puff?
The ECB is finally joining the Quantitative Easing (QE) party. Un-sterilised asset purchases have been a major policy tool in most of the developed world over the past few years but next month (as the Fed ends theirs, incidentally) the ECB will make its first foray into QE proper by embarking on an asset backed security (ABS) purchase programme.
Through this programme, focused on “simple, transparent and real” asset backed securities, the ECB hopes to stimulate lending to the real economy and so help see off the ever looming prospect of deflation. A healthy ABS market should hopefully offer banks a long-term alternative to cheap central bank funding, backed as these instruments are by loans as varied as car loans, mortgages and credit card payments.
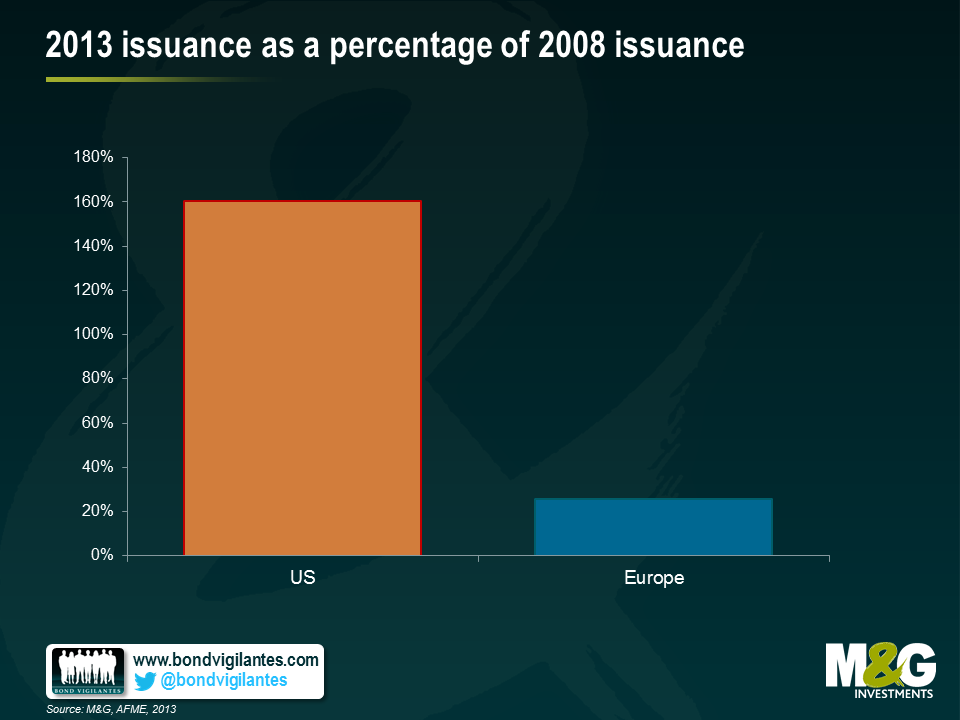
It’s pretty clear that the market in Europe is in need of invigoration, having been all but closed for business since the financial crisis. ABS issuance in Europe in 2013 totalled just €183 billion (according to data from the Association for Financial Markets in Europe) compared to €711bn back in 2008. The US market is by contrast in far ruder health, with 2013’s total of 1.5 trillion Euro’s worth of issuance, comfortably surpassing 2008 issuance of the Euro equivalent of 934bn.
But – and there is a but – there is a very substantial obstacle currently standing in the ECB’s way. This takes the form of a regulatory barrier – namely, the treatment of securitisation under the latest version of the Solvency II proposal. Under Solvency II, as it stands, insurance companies (a large pre-crisis investor base) have to hold twice as much capital to invest in a five year AAA-rated Dutch RMBS than if they hold a covered bond of the same rating and maturity, backed by similar assets. For peripheral eurozone issuers the situation is even starker – the capital charge on a five year A+ Spanish RMBS stands at approximately 20%, versus a charge of 7% for a similar covered bond. While this doesn’t apply for asset managers such as ourselves, it presents a very real disincentive for insurers, who must calculate that they can achieve a better return on capital elsewhere.
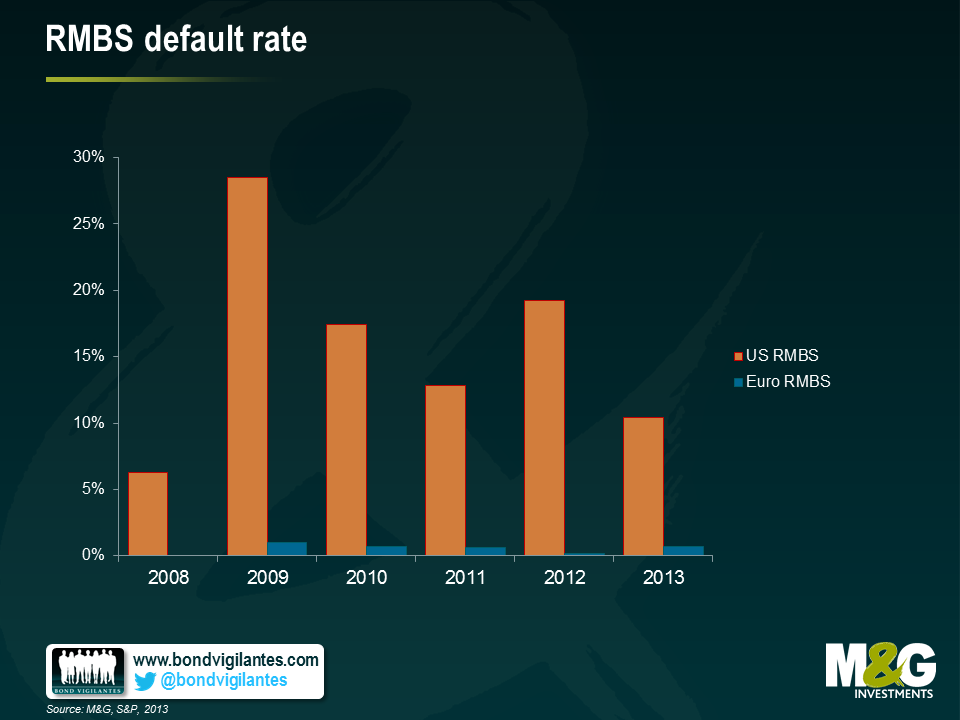
The idea behind these elevated capital charges is surely to protect balance sheets against the likelihood of default. But a quick look at default data makes for interesting reading. According to a Standard & Poor’s default study, default levels on European RMBS have reached a high of just 1% over the last six years. Yet in the US, where capital charges are more in line with those on corporate bonds, default levels on RMBS have been far higher – up to 28.5% in 2009, and still a little over 10% in 2013. Whilst there is some differentiation between regulatory classifications of ABS securities, in general, US capital charges are significantly lower than in Europe across all instruments.
This is a particularly pressing issue on two counts: not only does the ECB hope to kick off its ABS purchase programme in October, but the draft Solvency II legislation is due to be voted on at the end of September. Unless the European Commission moves swiftly to adapt the existing draft regulation, any attempts by the ECB to stimulate the market will likely be in vain. At a minimum, the ECB needs to at least equalise the capital treatment of instruments such as RMBS with that of other asset-backed products such as covered bonds.
After all, without demand from a wider client base than the ECB itself, there will be little incentive for issuers to supply these instruments. In this case, the market will continue to stagnate, and a valuable opportunity to invigorate lending to the real economy will likely be wasted.
The developed world is going through an unprecedented demographic change – “global greying”. This change is having a massive impact on asset prices and resources as populations around the world get older and live longer. It is also having an impact on the effectiveness of monetary policy. We would typically expect older populations to be less sensitive to interest rate changes as they are largely creditors. Younger populations will generally accumulate debt as they set themselves up in life and are therefore more interest rate sensitive. The impact of demographics implies that to generate the same impact on growth and inflation, interest rate changes will need to become larger in older societies relative to younger societies.
Turning to the impact of demographics on inflation, labour force growth may provide some insight into the potential path of future inflation or at least give us some guide as to the long-term structural impact of an aging population on inflation dynamics. The theory is that a large, young generation is less productive than a smaller, older generation. As the large, young generation enters into the economy after leaving school/university the fall in productivity causes costs to rise and therefore inflation increases. Additionally, the younger generation is consumption and debt hungry as they start a family and buy homes. Eventually, the investment in the younger generation comes good and there is a large increase in productivity due to technological change and innovation. As consumers become savers, inflationary pressures in the economy start to subside.
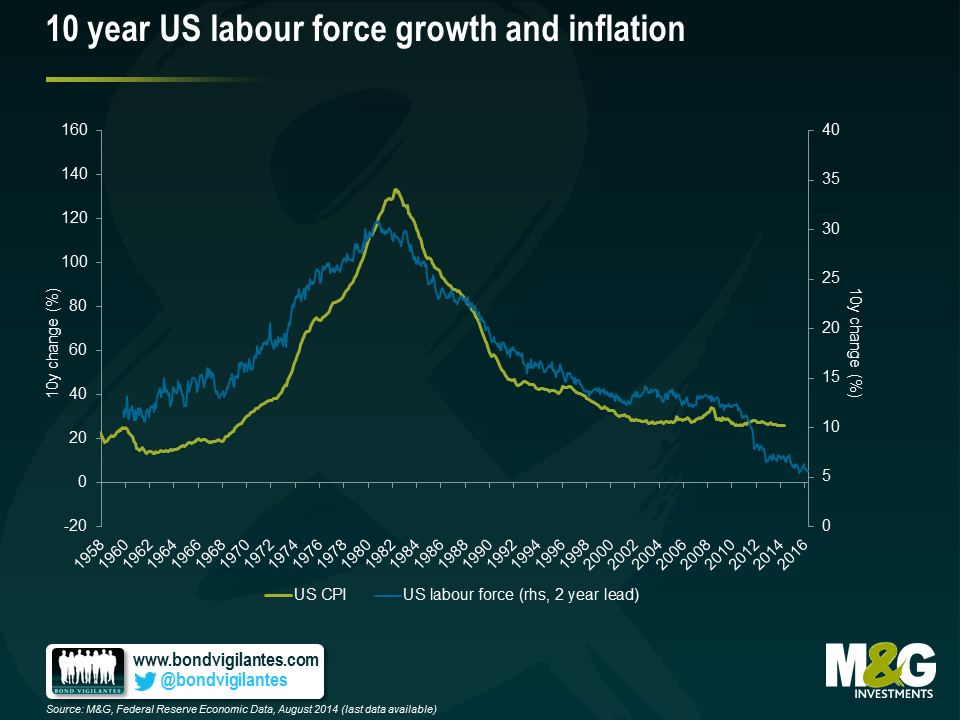
The long-term interplay between US labour force growth and inflation is shown below. Inflation lags labour force growth by around two years as it takes some time for the economy to begin to benefit from productivity gains. As US labour force growth rises and falls over time, inflation generally follows a similar trend.
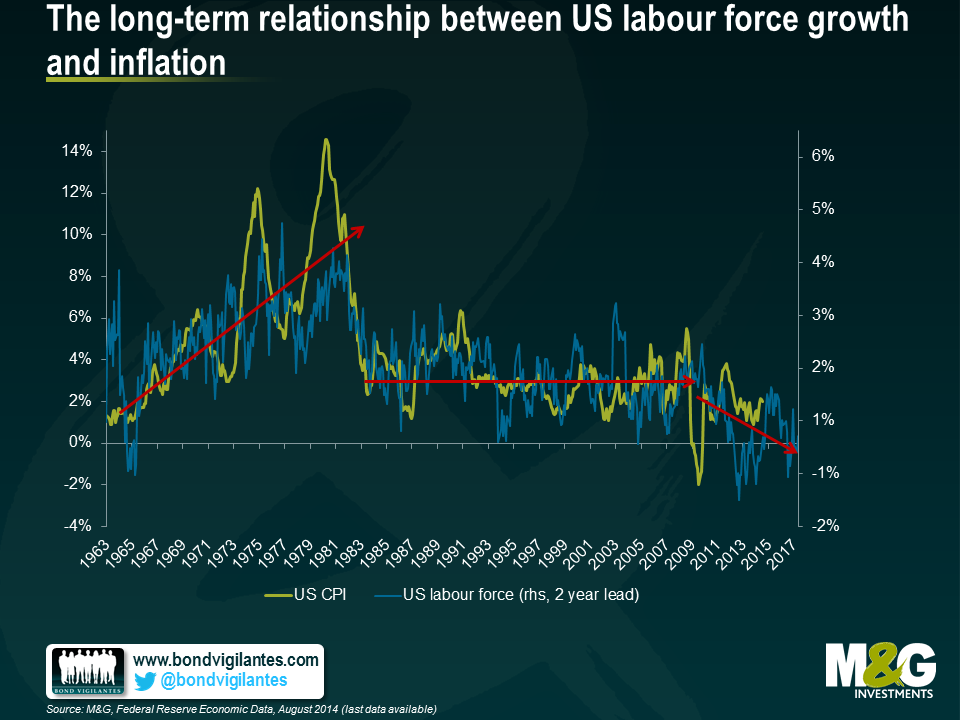
The second chart looks at the same economic indicators, this time looking at 10 year growth in the labour force against inflation. Interestingly, this chart seems to show that the baby boomers entered into the workforce around the same time as the global economy experienced a supply-side oil price shock. The influx of new workers into the US economy is likely to have contributed to the great inflation of the 1970s. For the next thirty years or so, inflation fell as the economy enjoyed the technological advantages and productivity gains generated by the baby boomers. Looking forward, it appears that long-term deteriorating labour force growth may contribute to deflationary pressures within the US economy.
I am not saying that demographics are the only reason that inflation has fallen in recent years. The massive accumulation of private and public sector debt, globalisation and technological change are also secular trends worth monitoring. Rather I believe “global greying” and the impact of demographics on inflation and the real economy is an additional secular trend worth monitoring. Can central banks do anything in the face of this great generational shift should deflation become a reality? Interest rates are at record lows, quantitative easing has been implemented and we are yet to see the large impact on inflation that many economists expected.
Lower interest rates and the yield-dampening forces that exist in the global economy is a topic I previously covered here. In terms of bond markets, deflationary pressures are a “yield-dampener” and another reason why bond yields could remain low for some time and fall further from current levels over the longer-term.
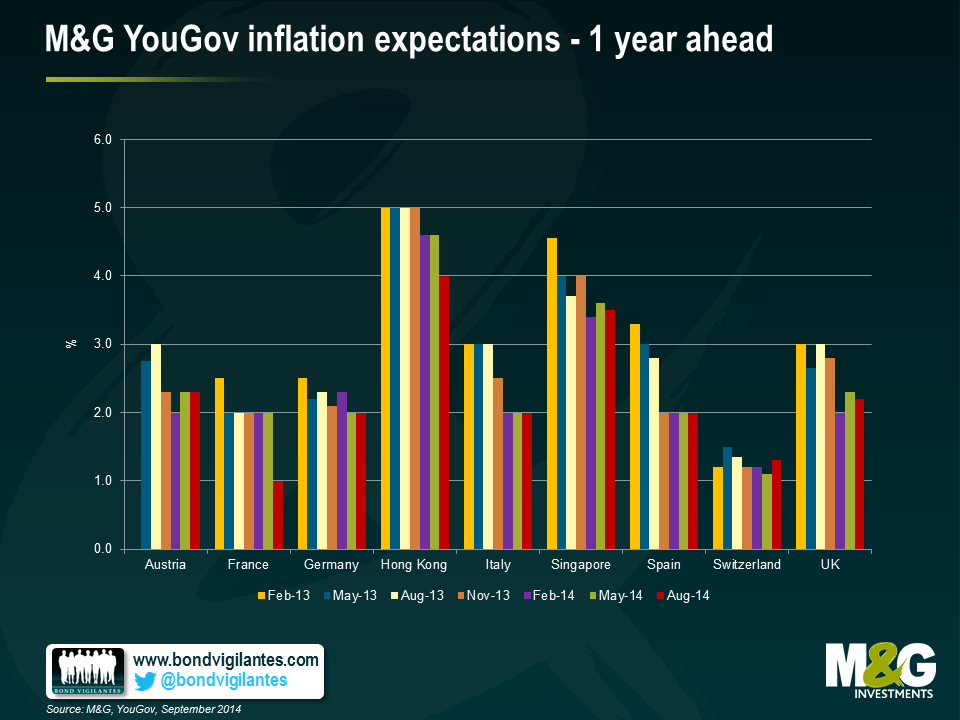
The results of the August 2014 M&G YouGov Inflation Expectations Survey suggest that inflation expectations have moderated across the UK, most European countries and Asia. Short-term inflation expectations in the UK have fallen from 2.3% to 2.2% after an upwards bounce in the May survey. However, over a five year period, expectations remain unchanged at 3.0% for the 7th consecutive quarter. UK consumers have modestly raised their confidence in the Bank of England, with 49% of respondents now expecting Mark Carney to deliver on price stability.
In Europe, short-term inflation expectations remain unchanged at 2.0% in Spain, Italy and Germany. However, in France, the expected rate of inflation for the next 12 months has dropped a full percentage point over the quarter and is now just 1.0%, the lowest level in the history of the survey. Notably, a larger proportion (48%) of French respondents believe their net income will decrease over the next 12 months, despite the fall in inflation expectations.
Over the long term, inflation expectations in all Eurozone countries surveyed except France remain above the European Central Bank (ECB) target, although there are signs of moderation in some countries. Compared to last quarter, inflation expectations have fallen across Austria, France and Italy, although not in Germany and Spain, where they have held steady at 3.0%. The downward pressure is most evident in Italy and France where long-term expectations have fallen to 2.5% and 2.0% respectively, amid an increasingly challenging political environment. The number of Italians in disagreement with their government’s current economic policy has increased notably over the quarter from 44% to 53%. Switzerland stands out as being the only country to report a rise in short-term inflation expectations (from 1.1% to 1.3%) and also for the high level of confidence that Swiss consumers continue to place on their central bank (54%).
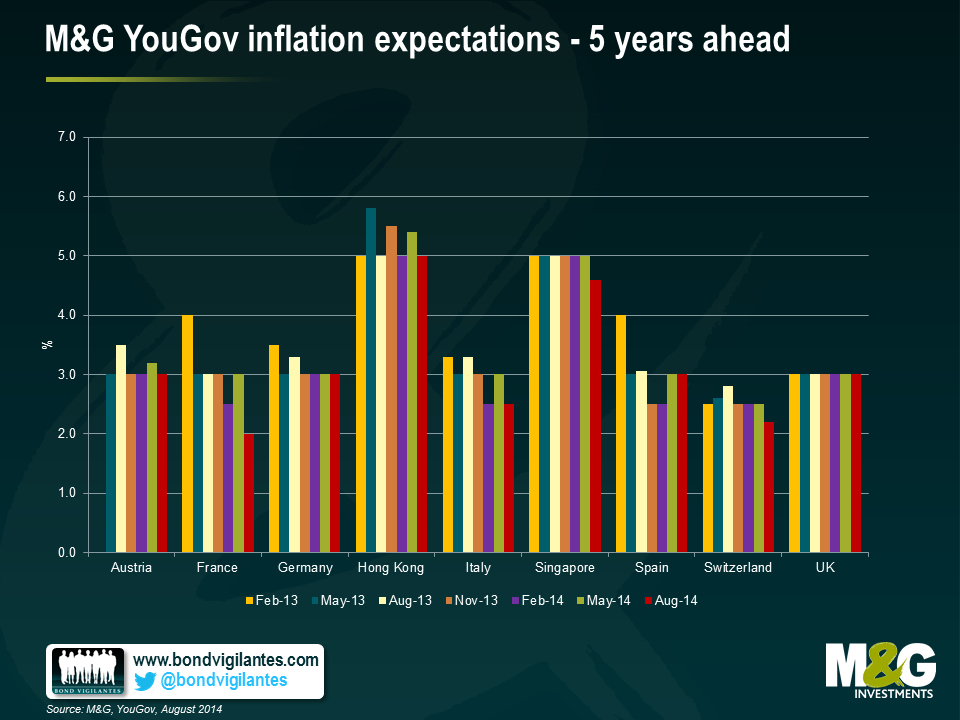
In Asia, the gauge for inflation over the short term has fallen to the lowest level since the inception of the survey (Singapore 3.4% and Hong Kong 4.0%). Interestingly, despite reporting a reasonably high level (45%) of confidence in their central bank’s ability to achieve its inflation target, consumers in Singapore nevertheless expect inflation to more than triple to 4.6% over the next five years.
The findings and data from our Q3 survey, which polled almost 8,500 consumers internationally, is available in our latest report.
Five years into the US recovery, the labour market is quickly returning to full health. Hiring activity is picking up, employers have added a robust 1.3 million jobs over the past 6 months and the unemployment rate is rapidly approaching a level that could prompt the Fed to start thinking about raising interest rates. All labour market indicators seem to have improved except for the one that workers should care most about: wages.
Indeed wage inflation has been the key missing piece of the recovery puzzle, and the lack of it appears somehow contradictory in the context of a rapidly improving economy. A valid reason could be that wages are widely known to be a pro-cyclical lagging indicator. An alternative, as Federal Reserve chairwoman Janet Yellen recently pointed out, is that wages didn’t quite adjust enough during the deep recession and will only rise once employers catch up for the “overpayments”.
As the US economic recovery marches on and corporates continue strengthening, the labour market could soon see wage growth begin to accelerate. Economic history has always been a great place to search for clues to future economic performance with the added benefit of hindsight. A look into 30 years’ worth of US labour market data reveals an interesting relationship between headline unemployment and wages, measured by hourly earnings of all employees on private nonfarm payrolls. As is shown in the chart below, wages seem to have historically accelerated whenever the US unemployment rate has touched, or come close to, a 6% level. History may not repeat itself, but it could well rhyme.
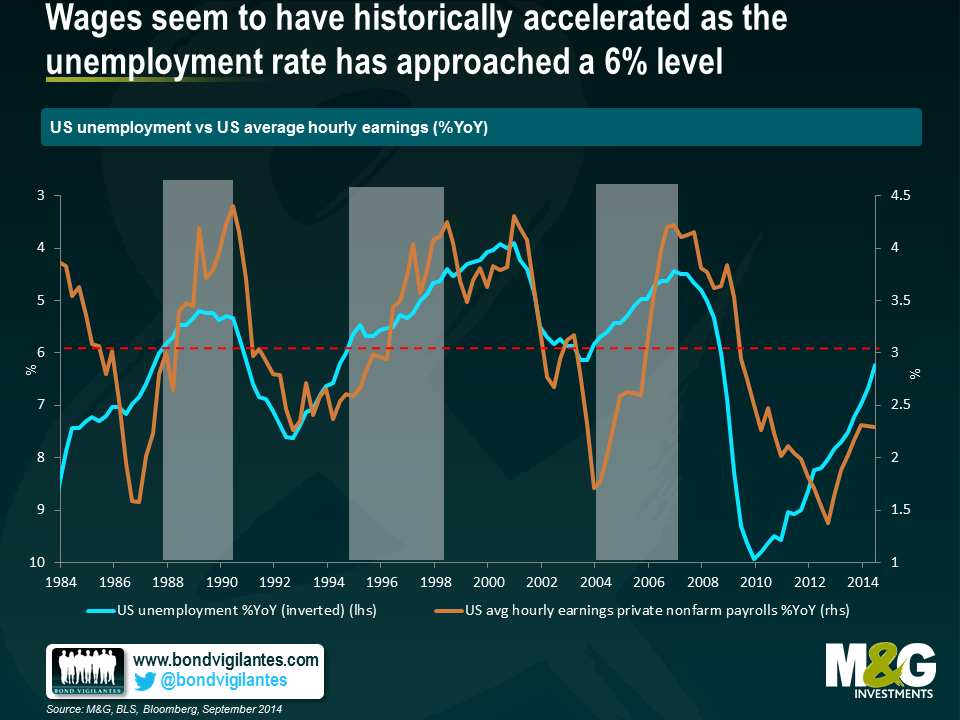
With unemployment sinking to 6.1% and nominal wages heading upwards, the US economy could be approaching full employment faster than the Fed may think. What unemployment rate is consistent with full employment is a subject very much open to debate. The Federal Open Market Committee (FOMC) estimates the current non-accelerating inflation rate of unemployment(NAIRU i.e. the level unemployment can fall to without causing capacity problems and demand pull inflation) to be at around 5.4% with concerns around labour underutilisation, but rising wages would suggest it is higher.
A further sign of emerging wage pressure can be found in the forward-looking National Federation of Independent Business(NFIB) compensation plans index, which is best known for anticipating wage increases to small businesses over the next 12 months. This index seems particularly relevant given SMEs (i.e. those with fewer than 500 employees) are the true backbone of the American economy– responsible for creating two out of three net new jobs. The chart below shows the NFIB index has been gaining momentum over the past year and is now at levels last seen prior to the recession.
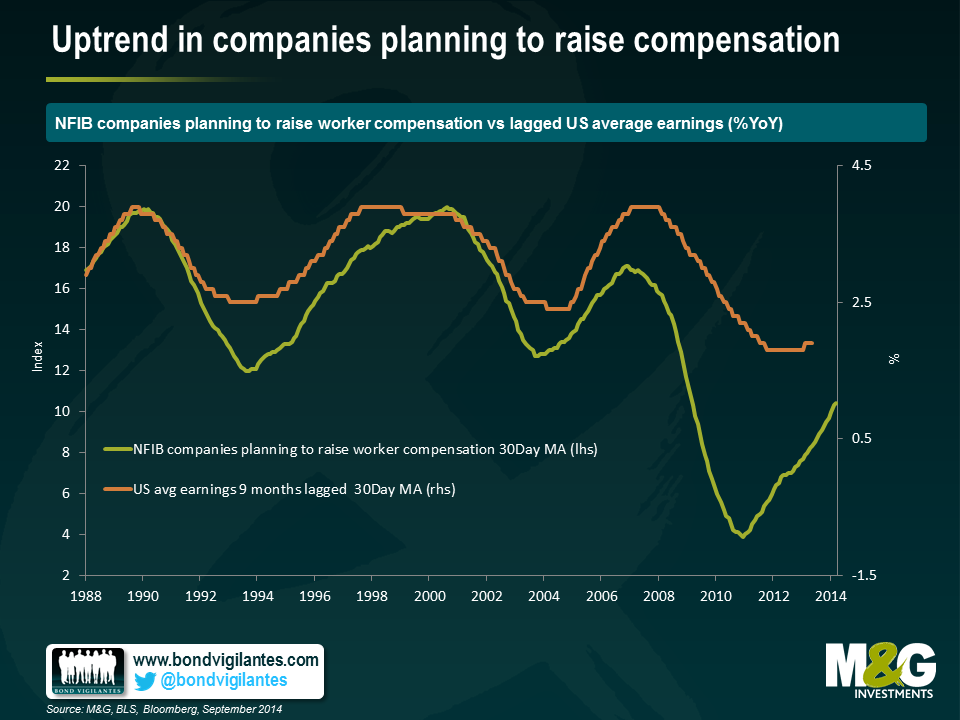
The most recent Job Openings and Labour Turnover Survey (JOLTS) report conducted by the Labour Department shows job vacancies have risen back to pre-crisis levels as a high percentage of employers are having trouble finding skilled workers. To attract the needed candidates, employers are having to raise compensation. Interestingly, comparing the NFIB index with lagged earnings data reveals a strong correlation over time. With the number of firms expecting to raise compensation on a strong upward trend, wages are likely to follow through.
As the labour market continues to tighten, it will not be surprising to see further wage growth build up. Most wage measures (including the widely followed Employment Cost Index and Unit labour costs) are on a clear uptrend today which is likely to continue unless economic growth slows or we were to see a sudden leap in productivity. Back in 1994, when the Fed had just started a series of aggressive rate hikes, US wage growth was only 2.4% YoY. Today, wage growth is 2.5%. Yet, Fed speakers have argued some slack remains in the labour market, hence the need to maintain a very patient policy stance – but could the prospect of rising wages in an economy rapidly approaching full employment be the tipping point that prompts the Fed to change rhetoric?
We are entering a new era for interest rates in the developed world. The extended period of ever looser monetary policy is starting to draw to a close. In the wake of the tapering of quantitative easing (QE) from the Federal Reserve (Fed), investors now expect to see the first interest rate hikes in many years, initially in the UK and shortly afterwards in the US. The principal focus of the debate is over the questions of “when?” and “how fast?” interest rates should rise, not “if?”. For bond investors in particular, this transition has thrown up a lot of difficult questions. Having benefited greatly from falling yields and tightening credit spreads, the move to a more hawkish cycle will create many more headwinds and challenges when it comes to delivering returns for many fixed income asset classes.
Consequently, any instrument that can help investors navigate this environment has rightly been receiving a lot of interest and attention. In the latest in our series of the M&G Panoramic Outlook, we will focus on one such instrument, the high yield floating rate bond. In recent years, this instrument has gained popularity with many issuers and the market has grown to a total US$44 billion.
A high yield floating rate note (FRN) has two key defining features: (1) a floating rate coupon that is automatically adjusted in line with changes in interest rates; (2) a relatively high credit spread that reflects the additional credit risk of a non-investment grade issuer.
It is the combination of these two features which not only enables investors to receive an attractive income stream now, but also allows them to benefit from higher coupons should interest rates increase with no associated loss to capital. This last element, the lack of a hit to capital in a rising interest rate environment, is the key difference to the traditional universe of fixed coupon bonds which suffer from price declines as yields move up.
In this issue, we will take an in-depth look at the characteristics and make-up of the high yield floating rate bond market. We will also consider the key drivers of returns, as well as some of the risks and how these can be managed.
Richard recently wrote about the exceptional times in bond markets. Despite bond yields at multi-century lows and central banks across the developed world undertaking massive balance sheet expansions the global recovery remains uneven.
Whilst the macro data in the US and UK continues to point to a decent if unspectacular recovery, the same cannot be said for the Eurozone. Indeed finding data to be overly optimistic about is no easy task. Both consumer and business confidence indicators continue to point to a subdued recovery; parts of Europe are technically back in recession and inflation readings continues to disappoint to the downside. The most recent CPI reading came in at a mere 0.4%, German breakevens currently price five year inflation at 0.6% and longer term expectations have shown signs of questioning the ECB’s ability to deliver on the inflation mandate.
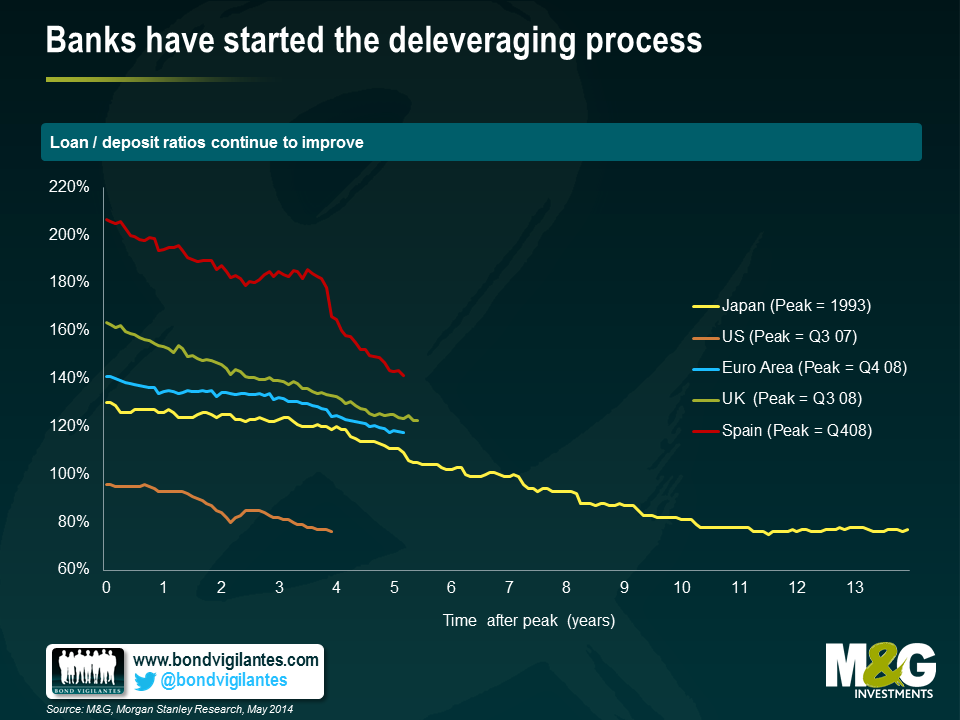
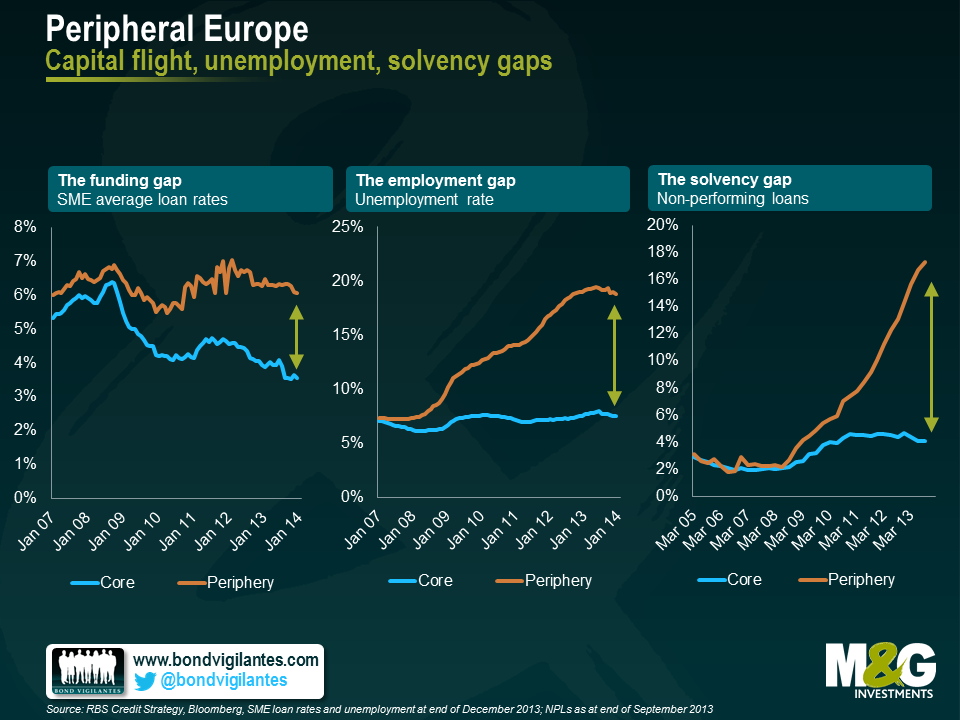
Recognising the sheer size of the Eurozone banking system remains key to understanding the challenge Eurozone policymakers face. With a banking system over three times larger than the US (relative to GDP); significantly higher non-performing loans and massive pressure to deleverage as shown in the first chart below, it is unsurprising that the so called transmission mechanism appears damaged. The failure to pump credit into the Eurozone economy, especially into the periphery, continues to weigh on funding costs for SMEs & promote exceptionally high levels of unemployment. These are only now beginning to stabilise at elevated levels as shown in the second chart below.
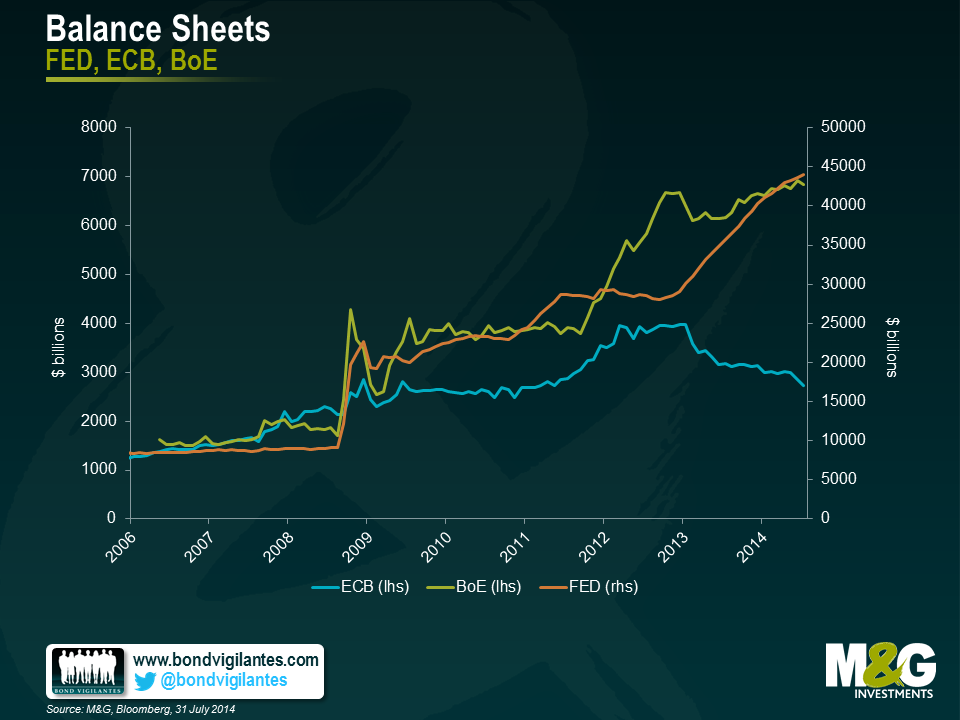
With previous demands for austerity in Europe preventing economies from running counter-cyclical fiscal policies and uneven progress in structural reform, the onus continues to fall on monetary policy and the ECB. And yet for a variety of reasons the response has fallen considerably short of that from the FED, BoE & BoJ, who have been happy to expand their balance sheets considerably.
The result has been, an overvalued Euro, imported disinflation and a lack of investment. Having offered re-financing cuts, forward guidance, massive liquidity in the form of the LTRO & TLTRO, the ECB will ultimately be forced to follow other central banks in undertaking broad asset purchases.
Whilst these broad asset purchases or QE are unlikely to be unveiled today, they are the only likely means in the near term, of ensuring that the banking system in Europe is able to extend significantly more credit to the real economy. This in turn should help to raise inflation expectations, boost potential growth and allow the ECB to fulfil its mandate.
In Europe exceptional times call for exceptional measures. The ECB isn’t done, even if certain members will have to be dragged kicking and screaming to the QE party. I expect European bond yields to stay low for quite some time.


Sign up to the Bond Vigilantes mailing list to ensure you never miss a great article from our expert Bloggers. We will email all new articles to your inbox, meaning you can stay on top of the world of Bonds.
I confirm that I would like to receive information about Bond Vigilantes and products and services from M&G Securities Limited.
We will use the email address and personal data you have shared with us to send you this information. For existing customers, submitting your contact details and requesting to receive this information from us, will replace any earlier choices you have made in respect of marketing information.
You can unsubscribe from marketing at any time, at which point we will not send any further marketing information to you, by selecting the unsubscribe link in all communications.


