
Happy Halloween. It’s time for some scary charts.
Halloween is around the corner and that can only mean one thing… scary chart time. Every year around this time, we highlight economic variables and statistics that could give central bankers nightmares. If stuff like non-performing loans, bad forecasts and big numbers scare you then it is probably time to turn off your computer screen and forget you ever saw this blog. The following is not for the faint hearted.
1. Eurozone bad debt is 9% of GDP
We’ve been waiting for the European Central Bank (ECB) asset quality review (ACR) and stress test results for some time now and they were finally released last week. Essentially, the AQR tested 130 European banks in order to find out how well the lenders could weather various degrees of economic downturn. The banks represented a combined 82% of bank assets in the Eurozone.
To cut a long story short, 25 banks failed either the AQR or the stress test. There hasn’t been much action in the bond market as those banks that failed were expected to do so. Importantly, the capital shortfall identified by the tests was only €7bn. This is an amount that appears manageable and banks with shortfalls must prepare capital plans within the next two weeks.
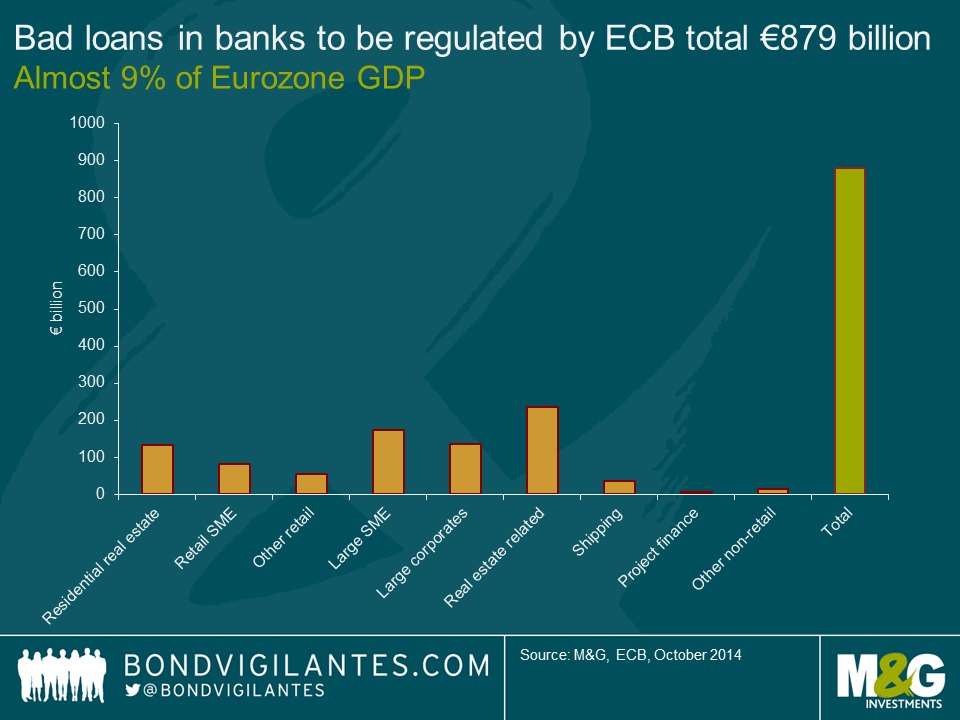
The scary part of the AQR was buried on page 67 of the report in a table that identifies non-performing exposures on the banks’ balance sheets (otherwise known as bad debts). When the European Banking Authority applied its definition of non-performing exposure rather than the commercial banks’ own internal definitions, bad debts skyrocketed by 18.3% to €879.1bn. This equates to almost 9% of Eurozone GDP.
What terrifies us about the bad debt revision is that non-performing loans are a lagging indicator. Things are probably far worse than €879.1bn of write-offs. And with the Eurozone possibly sliding into deflation (a scenario that was not tested in the AQR) and flirting with recession, we have to wonder whether bad loans will top the €1 trillion mark in the not-too-distant future. Given the large excess of bad debt that needs to be worked off in the European banking system, we are not surprised that bank loan growth in Europe is so weak. The answer could be a European bad bank.
2. Professional economists are getting worse at forecasting inflation
Since 1999, the ECB has surveyed over 75 professional economists employed by banks and financial institutions across the European Union on a quarterly basis. It does this in order to assess expectations about future economic developments and hopefully get a head-start on understanding whether they are losing policy credibility or not.
The ECB survey asks for a point forecast from the economist for inflation, real GDP growth and unemployment over different time horizons. An important question asks the economists for their inflation expectations in 12 months’ time. The ECB is looking to see whether these expectations are starting to become “unanchored”. That is, whether the forecasts are beginning to deviate substantially from the ECB’s price stability target of inflation close to 2%.
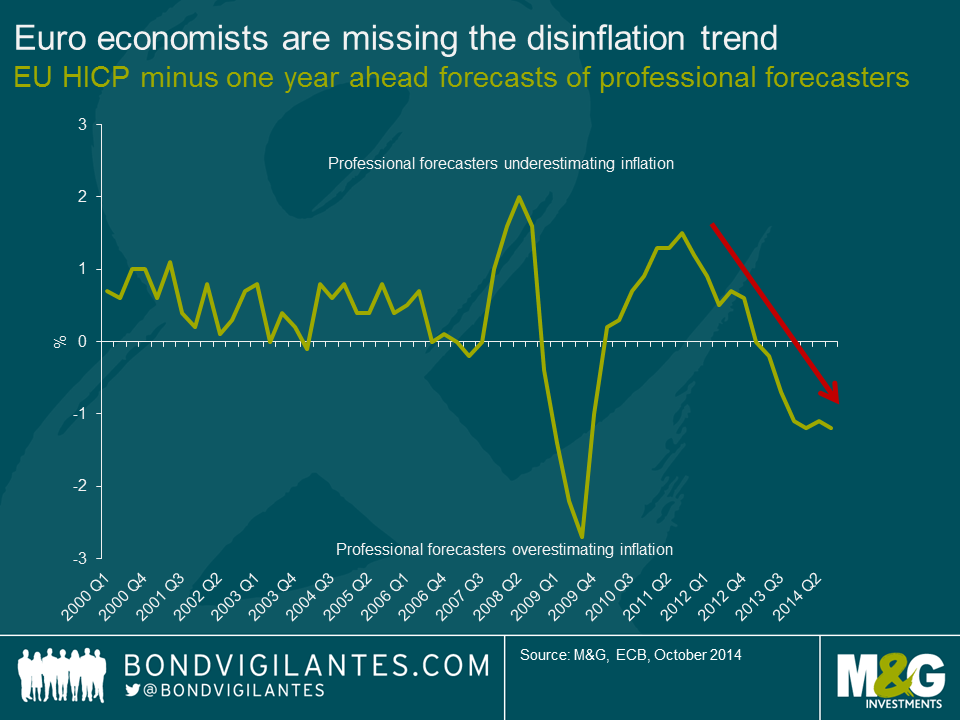
Comparing the 12 month ahead forecasts against actual inflation outcomes suggests that professional economists are seriously overestimating inflation outcomes. From 2000 until 2007, economists actually did a pretty good job of forecasting inflation. Over this period, the economists that were surveyed underestimated inflation by around 0.5%.
In 2008, all hell broke loose. Remember that the economists were making their March 2008 forecasts 12 months earlier in March 2007 so we should cut them some slack. However, economists failed to see the large spike in inflation as the oil price rose throughout 2007 and 2008 resulting in an underestimation of inflation a whopping 1.7% throughout 2008. From 2008 onwards, professional economists have been poor at forecasting inflation 12 months ahead, sometimes overestimating and sometime underestimating inflation.
What is frightening in the chart below is the fact that since 2013, economists have consistently overestimated inflation in the EU. When are European economists going to start asking themselves – “What am I missing?” The very real possibility that the Eurozone enters into a deflationary period is currently the world’s biggest problem and those tasked with monitoring the threat are missing it completely.
3. The new widow maker trade
The following extract is from a piece I wrote earlier in the year entitled “The Yield-Dampeners”.
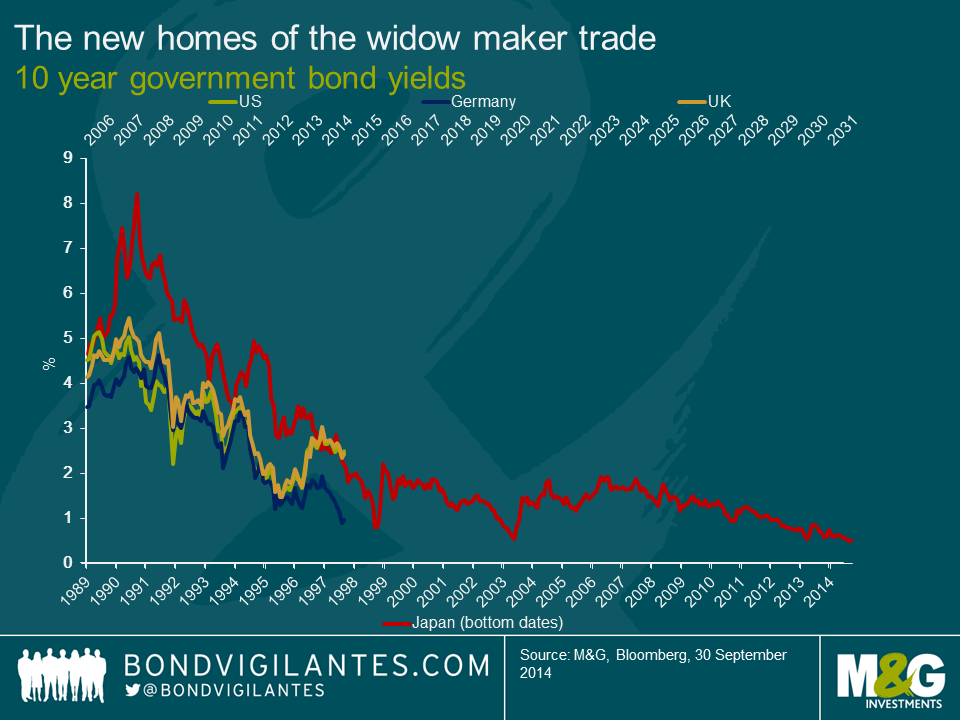
For investors, one trade that has always lost money, over any reasonable time period, has been the shorting of Japanese government bonds (JGBs). This trade, unique in its consistency, developed its own name: “the widow maker”. Over the past 24 years, JGB yields have fallen relentlessly from a peak of around 8% in 1990 to around 0.62% today. Despite the great monetary experiment of “Abenomics”, the widow maker is alive and kicking.
History might not repeat itself but it does rhyme. As shown in the accompanying chart, US, German and UK government bonds yields are following an eerily similar path to JGBs in the early 90s. The question has to be asked: is shorting developed market government bonds the new widow-maker trade?
For government bond investors or anyone short duration in their bond portfolio, the below chart is terrifying. What if the developed world is entering into a period of secular stagnation? What if returns on risk-free assets are permanently lower? What if central banks are unsuccessful in their attempts to avoid deflation?
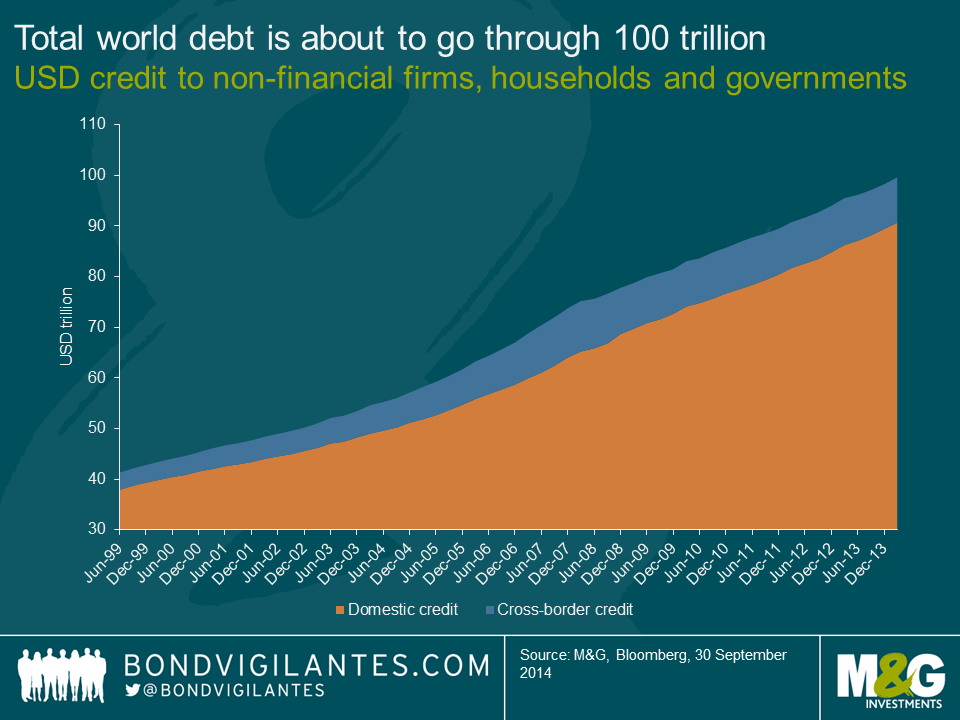
4. Total world debt equals $99,620,935,229,797.10
For the first time in history, world debt is about to burst through the 100 trillion US dollars barrier. That is pretty difficult to comprehend. So I did a quick search and came up with the following facts in an attempt to visualise the enormity of 1/100th of the world’s outstanding debt, 1 trillion US dollars. So here goes:
- $1 trillion dollar bills placed end-to-end would reach the sun (96 million miles)
- $1 trillion dollar bills is the same height as 85 billion people standing on each other’s heads
- If you can count 3 bills per second, it would take one person to live 124 lifetimes counting nonstop from birth to age 85
It is simply astonishing that the world has added another $20 trillion in debt since June 2009, a time when the global economy was recovering from a devastating financial crisis which was caused in-part by excessive leverage. Unfortunately, the financial system seems to be addicted to debt. Central banks have facilitated this addiction through quantitative easing and ultra-low monetary policy, forcing savers into riskier investments in the hope of generating a positive real return.
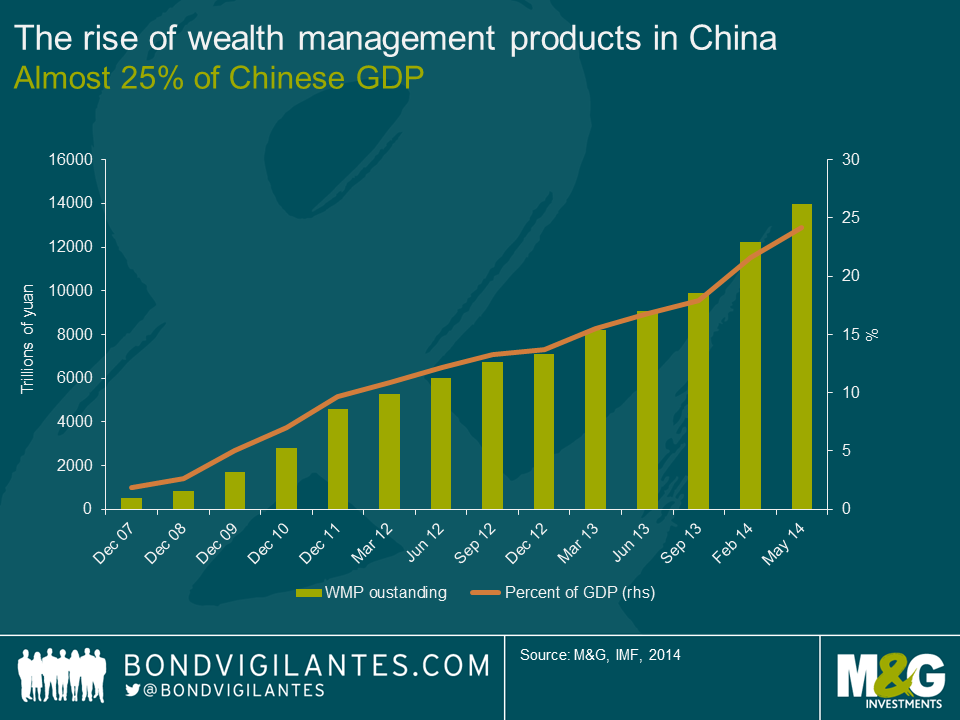
5. The rise of wealth management products in China
At 14 trillion yuan, the amount of money in Chinese wealth management products (WMP) is roughly the same size as Brazil’s entire economy (USD 2.2 trillion). Wealth management products look like time deposits to investors but aren’t necessarily guaranteed by the banks that issue them. Most invest in bonds and money markets though some use stocks, derivatives and loans to bolster returns for clients. The assets backing some WMPs are real estate or infrastructure investments.
The problem is many investors in WMPs probably don’t know what they bought and are attracted by the high rates of interest. Most Chinese investors simply do not know that WMPs are not real deposits. The vast majority of investors probably don’t actually dig around the product’s prospectus enough to find out what the actual assets are that are underpinning these investment vehicles. Often, the assets are real estate and given the Chinese real estate market has experienced a sharp downturn in recent months the pressure to deliver the stated return on the WMP is growing every day on the Chinese banks. WMPs are the world’s biggest trick or treat game.
Chinese banks have relied on WMPs to increase their deposit base. Banks then take those deposits and make real estate loans. It’s a vicious circle of doom for when the Chinese property market eventually corrects (just like the Japanese property market in the 1992). Should investors begin to lose confidence in the banks and withdraw from WMPs en-masse, a liquidity crunch would be the most likely scenario. Because of the scale and prevalence of WMPs, banks would be expected to cover losses and pay investors principal plus interest on products that had been guaranteed. These products are too big to fail. The question is to what degree this would impact the financial system and whether the smaller banks could handle a run on wealth products.
Five scary charts. Each more terrifying than the next. Hopefully all those central bankers and economists that have read this post will be able to get some sleep tonight. Don’t say I didn’t warn you.
The value of investments will fluctuate, which will cause prices to fall as well as rise and you may not get back the original amount you invested. Past performance is not a guide to future performance.
19 years of comment
Discover historical blogs from our extensive archive with our Blast from the past feature. View the most popular blogs posted this month - 5, 10 or 15 years ago!


Bond Vigilantes
Get Bond Vigilantes updates straight to your inbox