
Rolldown
A dispatch from the number crunchers – Yield curve rolldown
By Matthew Russell
15 April 2026

There is a lot of debate surrounding the future of China’s economy. There are the pessimists, who will cite the inevitable collapse of a debt-powered housing bubble. There are others that say these concerns are overblown and that despite slowing, China is still the world’s second largest economy and its growth rate is far superior than anything seen in the developed world.
From time to time we visit China in order to try and work out for ourselves what the future could hold. China is such an important part of the global economy, it is vital that investors in bond markets have some understanding of the fundamentals that drive the Chinese economy.
Our last video on China highlighted the differences in the banking systems of the US and China and what lessons policy makers in the West could learn from the Chinese authorities. More recently, Matthew Russell (M&G Fund Manager) and I went to Beijing on a research trip to find out more about the current state of the Chinese economy. In particular, we wanted to develop a better understanding of two areas which are often looked upon as potential trouble spots: China’s property market and its shadow banking sector. We’ve put together a video to share some of our thoughts on these and related issues.
Emerging market (“EM”) corporate bonds are a fast-growing segment of the fixed income market. The hard-currency (USD, EUR, GBP and CHF) EM bond market has doubled in size since 2010 and is now worth over $1.3 trillion – which makes it as big as the US high-yield market. Including local-currency bonds, the Bank of International Settlements estimated that the EM corporate bond market was worth nearly $4 trillion at year-end 2013.
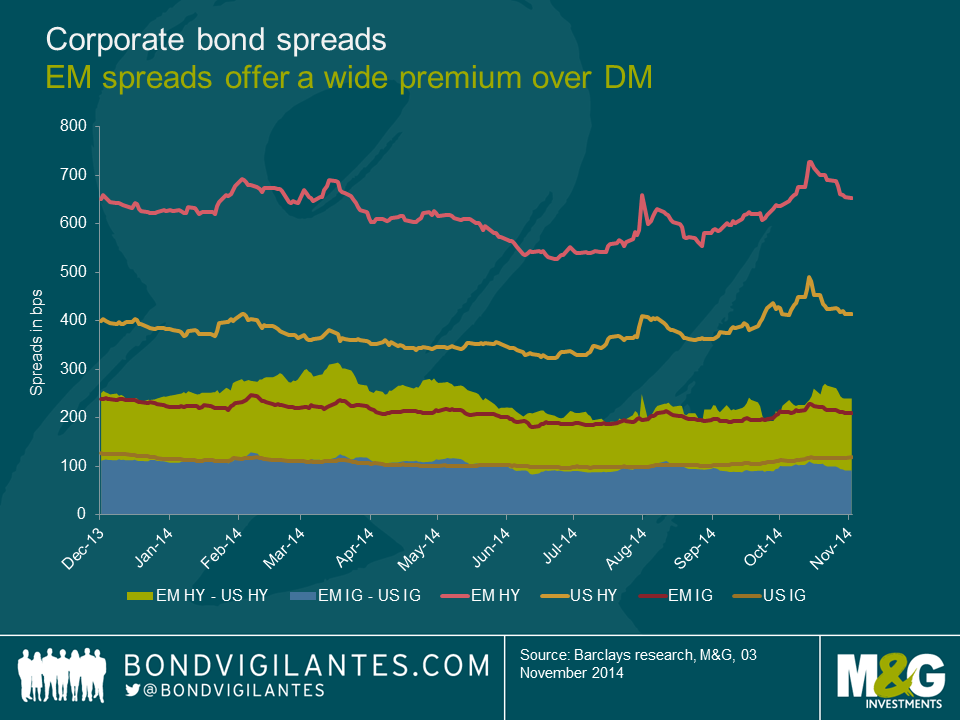
The following chart shows the recent evolution of hard-currency EM and US corporate spreads. Arguably, while the EM spread premium over the US currently looks slightly more expensive than last March or April, it nevertheless remains compelling and since December 2013 has averaged a premium of just over +100bps in investment grade credits and about +215bps in high yield corporate bonds.
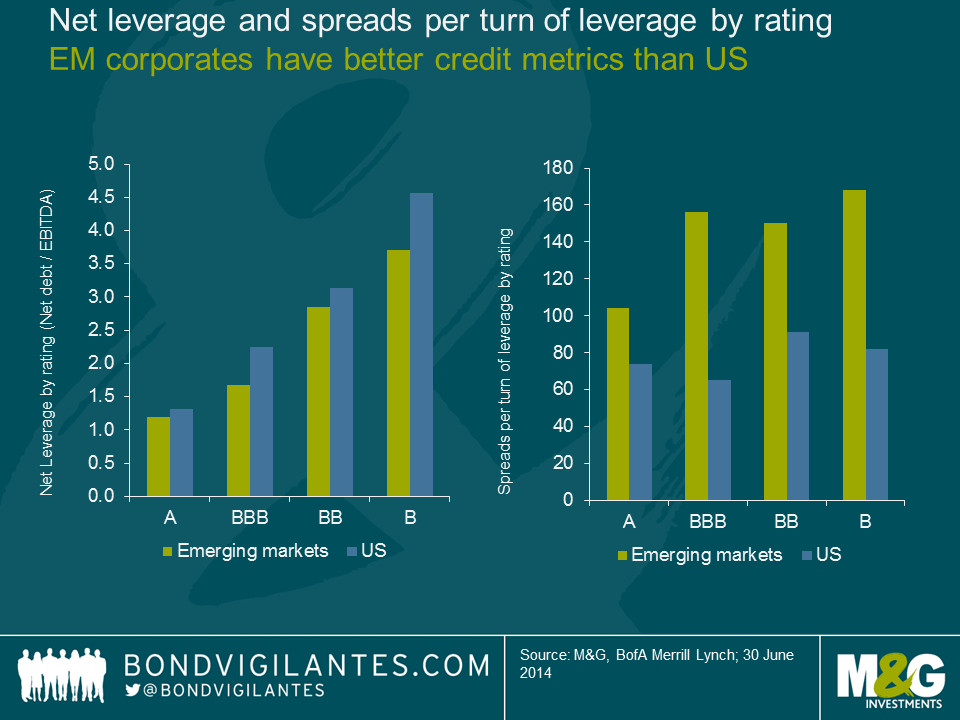
There is no doubt that higher spreads in EM comes with higher risks compared to developed markets (“DM”). However, as can be seen in the graph below, EM corporates tend to have better credit metrics than their US counterparts for a similar credit rating class, while offering much wider spreads than DM. This is because EM corporates have additional risks compared to DM issuers, such as political or country specific risks.
Bottom-up research is paramount in the EM stock selection process and investors should look to assess not only financial statements but also industry risk, corporate governance, financial disclosure, covenant package or recovery value estimates. However, a top-down approach is also critical as currency, inflation and political risks, among others, can have a significant impact on the fundamentals of a corporate bond. All of these risks, whether they are company-specific or related to the country, are in theory included in credit ratings and this is the reason why EM issuers will likely be assigned a lower credit rating by rating agencies than their US peers with similar credit metrics.
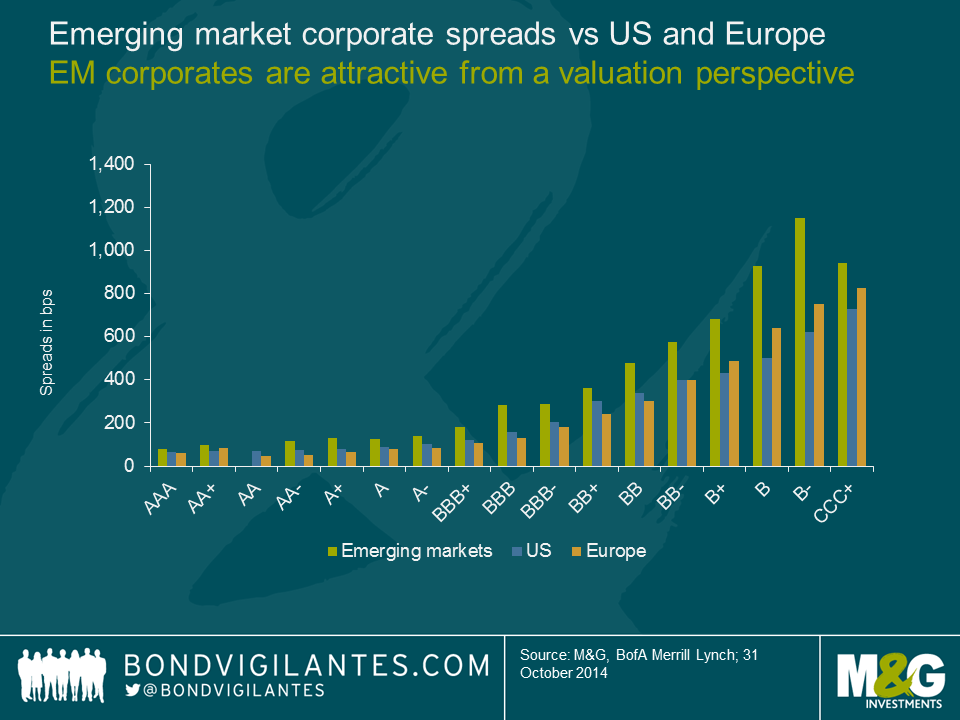
The true question therefore is to assess whether the EM spread premium over DM corporates is attractive once accounting for the additional risks involved with these instruments. The following graph shows that for a similar bond rating class EM bonds consistently offer higher spreads than US and European counterparts, implying investors get compensated for the credit risk plus get a premium for investing in EM. Why is this?
One may argue that EM bond ratings are not reliable as credit rating agencies may underestimate macro risks, in particular the issuers’ vulnerability to currency risk, or adverse bankruptcy laws for offshore bondholders in some jurisdictions where very few historical default cases have occurred. Indeed, “rating mistakes” do exist across the EM rated universe – as in DM ratings – and investors should not be looking blindly at bond ratings. However, credit rating agencies have been historically very conservative in assessing EM credit ratings and tend to be more credible when looking at the entire rated EM corporate universe.
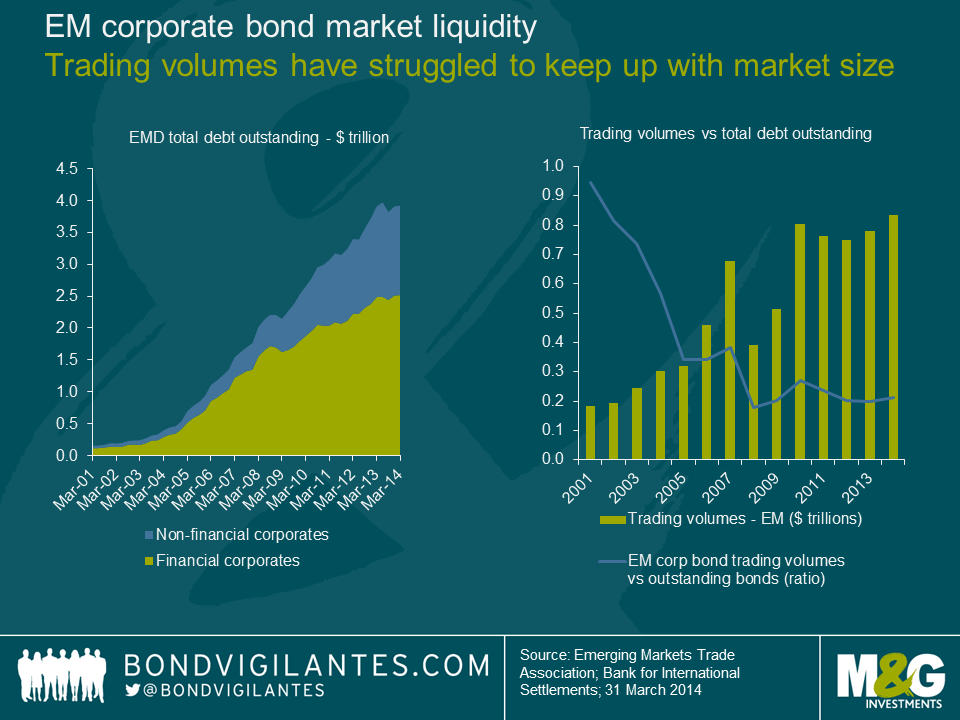
A more relevant answer, in my view, to the question of why EM spreads offer a significant risk-adjusted premium over DM is market liquidity risk because (i) it is not captured by rating agencies, and (ii) EM corporate bonds are less liquid than DM. All markets are exposed to illiquidity but emerging markets are more sensitive to liquidity risk due to the smaller average size of issues and the fact that foreign investors – a less sticky investor base than domestic investors – tend to reduce risk in times of market volatility. Liquidity in emerging markets was one of the hot topics of the Oct-2014 IMF Annual Meetings in Washington D.C. as financial regulatory reforms have led to reduced liquidity in the market, in turn becoming a source of instability for emerging market bonds. The following charts are good evidence of reduced liquidity in the EM corporate bond market, showing EM corporate bonds trading volumes increasing at a much slower pace compared to the outstanding issuance of EM corporate bonds. Last year’s taper tantrum was also symptomatic of reduced liquidity in the EM corporate bond market, although it was also the result of stretched valuations and significant unhealthy inflows by foreign investors in the twelve months ended May 2013.
While it is therefore critical to be mindful about the deteriorated liquidity in EM markets, liquidity risk nevertheless does not fully explain the compelling credit risk-adjusted spread premium of EM corporates over DM. Another component of the spread premium, I argue, comes from the fact that investors are reluctant to invest in markets they are not familiar with. People fear what they don’t know and in bond investing the unknown translates into risk, hence higher spreads. Evidence of such behaviour from investors may be seen in the fact that whenever new bonds are issued in the EM hard-currency bond market, overseas investors tend to be more demanding in terms of pricing than local investors who arguably have higher FX exposure and better knowledge of both the operating environment and the sovereign risks. Although EM liquidity has deteriorated -you are still getting generously paid compared to developed markets.
One of the many unintended consequences of structurally low interest rates over the past few years has been the emergence of mini-bonds in the UK. These are typically non-tradable debt instruments issued by companies directly to individual investors*. We’ve commented before on one such bond issued by Chilango, a London based vendor of Mexican food, and highlighted some of the risks relative to the more established institutional bond market (very limited disclosure, an absence of legal covenants, lack of call option protection and no secondary market liquidity).
Nonetheless, these instruments are proving to be popular, not least given the interest rates on offer, but also due to some of the more exotic features such as coupons in the form of goods and services. Indeed, the latest addition to the pack is Taylor Street Baristas, who are offering a bond with the choice of an 8% cash coupon or 12% store credit.
The question always intrigues us – who are buying these bonds? Looking at some of the mini bonds issued over the past 3 years and some of the non-cash coupons on offer, we can build up an interesting profile of the quintessential “mini bond” investor.
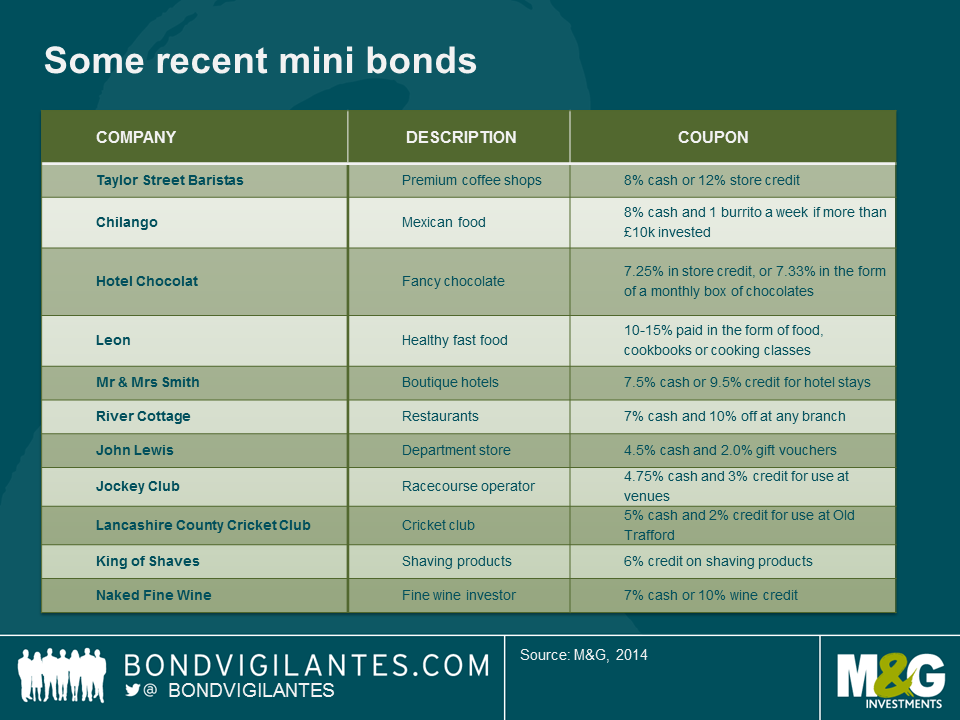
When we consider the above, this is the profile that starts to emerge:
Location – London – the food selection on offer (Taylor St Baristas, Chilango and Leon) is only of any practical use to someone who lives and works in London and can access the relevant branches on a regular basis. Until such time as these chains expand outside the capital, our quintessential mini bond buyer is almost certainly a Londoner.
Holidays – South West – the combination of the River Cottage discount (with branches mainly in the West Country) and the Mr & Mrs Smith credit means our mini bond buyer is well incentivised to spend any down-time in a boutique hotel in the South West of England.
Diet – Poor – Whilst the River Cottage and Leon may offer food at the healthier end of the spectrum, the weekly burrito, fine coffee, lots of chocolate and a steady supply of wine suggests an indulgent lifestyle.
Hobbies – Cricket / Horseracing – The numerous Jockey Club venues offer up a range of opportunities for a day at the races peppered with the odd trip up to Old Trafford.
Without going as far as saying that mini bonds are targeted at obese London based oenophiles who occasionally venture out to Newmarket, there is a more serious point to be made when we look beyond the gimmicky features of this market.
A new source of finance for businesses at a time when bank lending conditions are difficult is something to be welcomed. What we would not want, however, is this to come at the expense of investor protections for bondholders. These protections have evolved over several decades in the institutional bond market and serve an important function in protecting investor rights and indeed their capital. These protections really matter when things go wrong and we are yet to see any default in this particular market so this deficiency is yet to manifest itself.
With this in mind this is what we would like to see in any future mini-bond :
With these additional features in place, mini-bond holders would begin to share some of the beneficial features of the institutional market whilst at the same time allowing them to enjoy the more exotic coupons on offer. Otherwise, even with the extra wine and burritos, mini bond investors are getting a raw deal compared to the more established corporate bond markets.
*NB – this is in parallel to the development of the more regulated retail bond market that has emerged in the UK, Italy and Germany where issuers are subject to more stringent oversight and the bonds themselves are listed on an exchange and are transferable.
As you know, we’ve always been fascinated by the UK’s War Loans and have written about them repeatedly on this blog (here’s what we wrote in 2011 when we suggested that they should be redeemed). Bonds and war go together hand in hand, and for most of history rising government debt levels have been directly caused by the cost of financing conflicts, or the reparations afterwards. The several outstanding War Loans also tell the story of the UK’s extreme fiscal distress in the 1930s, and the quasi default that lead to a patriotic (and on the face of it voluntary) reduction in the coupon of the 5% loan down to 3.5%, and of the inflations of the 1970s and 1980s which saw the value of these undated, long duration bonds collapse to levels where their yields were higher than their prices. British Pathé has a series of great clips around the time of the £2 billion debt conversion (coupon reduction) mentioned above, including Neville Chamberlain presenting his plan on the deck of a ship. At the time he was regarded as a media genius and newsreel gold apparently – the Russell Brand of his day.
On Friday HM Treasury announced that £218 million of one of the smaller, and higher couponed, War Loans will be repaid at par (100). This bond was issued in 1927 to refinance some WW1 debt. There’s obvious speculation that the rest of the War Loans, including the £2 billion 3.5% issue, might also be redeemed if yields stay low (disclaimer: we own that, and other similar gilts, and it would be nice if it happened!).
The thing that struck me from the announcement though was the Chancellor’s comment that “we are only able to take this action today thanks to the difficult decisions that this government has taken to get a grip on the public finances … (and) the fact that we will no longer have to pay the high rate of interest on these gilts means that most important of all, today’s decision represents great value for money for the taxpayer”.
I guess the bonds have indeed been a pretty sweet deal for the taxpayer – FT Alphaville calculated that in real terms the debt was inflated away such that it is effectively being redeemed at £1.82 per £100 issued (even defaulted junk bonds typically return 40p in the pound to investors!). But it is also the case that for all the talk about creating savings for the taxpayer, if this bond is refinanced at, say, 3% per year, the Exchequer benefits by just £2 million per year, in the context of a budget deficit of nearly £100 billion per year.
Also, has the UK government really been able to repay this bond because of the “tough grip” on the public finances? Not only did the UK lose its prized AAA credit rating under the current government, but even now growth has come back, the UK’s deficit has been overshooting in most months this year, thanks to poor income tax receipts in particular. The Institute of Fiscal Studies (IFS) suggests that £37 billion of new austerity is required to get to a position of even balancing the books in the next 3 years or so. The chart below shows that the UK has actually seen much less improvement in its deficit as a percentage of GDP than its biggest economic peers. In fact, the UK national debt is £100 billion larger than it was a year ago and is heading towards £1.5 trillion.
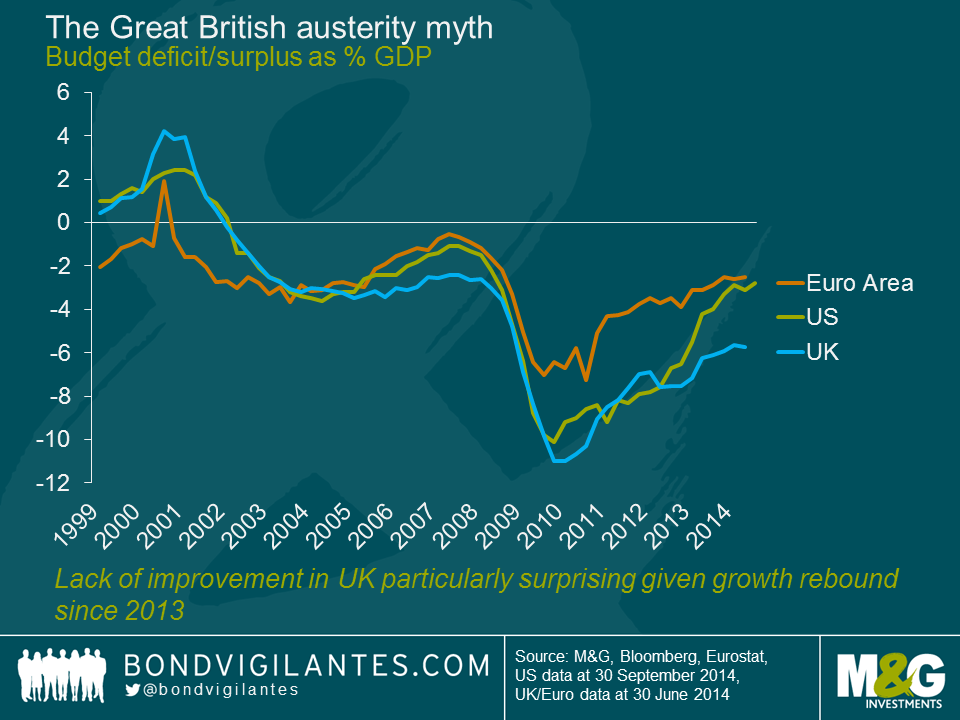
So there hasn’t been a significant improvement in the public finances in the UK. In fact, looking at the chart below you can see that the ability to refinance old perpetual bonds at low yields is nothing to do with UK specific factors. All developed market bonds have fallen in yield since the credit crisis and its aftermath. The collapse in bond yields is nothing to do with credit worthiness and all to do with a global savings glut, quantitative easing (or expectations of it in the case of Germany)and fears of secular stagnation and deflation.
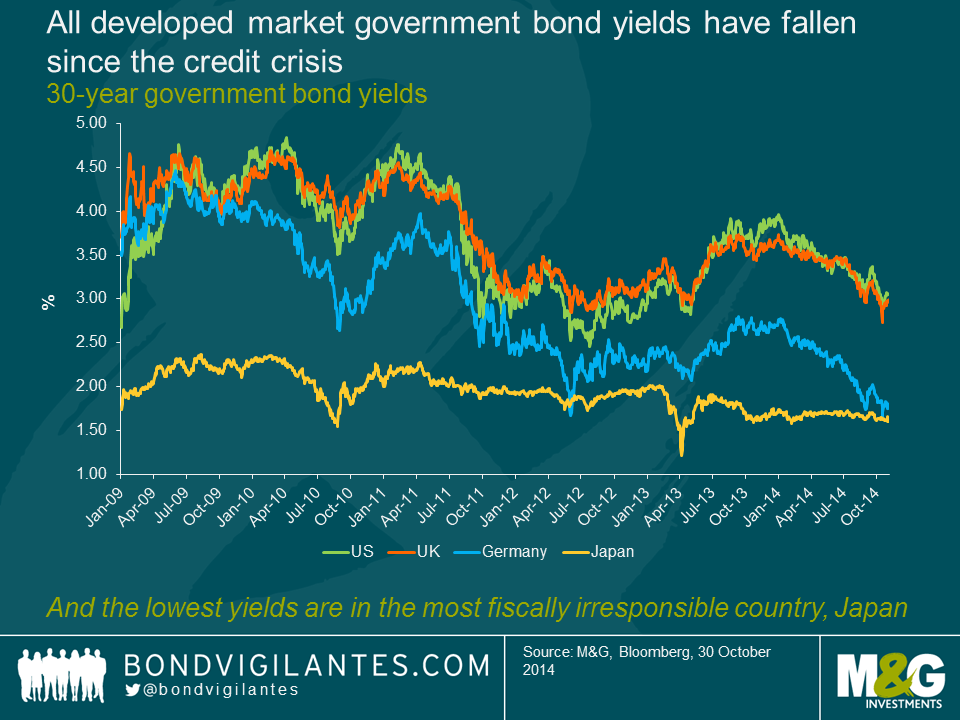
Some of the lowest bond yields in the world are in Japan – 40 year government JGBs yield 1.77%. At the same time, Japan has been one of the most fiscally irresponsible countries, with a budget deficit averaging more than 6% each year in the last 20 years, a deficit in 2013 of 9.3% of GDP, and its gross public debt/GDP ratio having soared from something like 60% in the early 1990s to more than 200% now. Very low bond yields arguably say much less about fiscal discipline, and much more about the market’s view on long term nominal growth rates – if anything, you could argue that rather than something to celebrate, low bond yields – and the redemption of the War Loans – are a worrying signal since they suggest very low economic growth potential.
Will the 3.5% War Loan go the same way as the Consol 4s? Obviously the lower coupon sets the bar a bit higher for its redemption, and the bond price at just under 92 means that investors would be gifted 8 points of capital return. The other concern that the Debt Management Office has is that bond yields could rise substantially between an announcement like Friday’s and the date when they repay the money next year, such that it looks like the bonds should have been left outstanding. So there is an “avoidance of embarrassment” factor too which means that the economic decision needs to be clear cut rather than borderline. The timing of 3.5% War Loan’s coupon payments might make an announcement in an early pre-election Budget attractive for the government if yields remain around current levels as repayment would likely be on a coupon date, redemption requires 90 days’ notice and therefore 1st June could be achievable.
US inflation has been surprisingly low for a few months after a peak in May 2014. According to the latest data released in September, core CPI (i.e. excluding food & energy) stands at just 1.7% with much of this weakness caused by declining goods prices. According to the US Bureau of Labor Statistics (BLS) the average price of imports, excluding fuel, has not increased in six months. A stronger dollar, falling commodity prices and outright price cuts have all more than offset the upward push from service sector prices. In general, over the last two years disinflation within the goods sector has tamed overall US CPI, allowing the Fed to pursue stimulative policies to get the economy back on track.
Going forward this picture is likely to change. Goods disinflation is finally receding and the strong momentum in the housing and labour markets are already putting some pressure on service sector prices. Where should we be looking? As usual, the devil is very much in the detail. There are two primary service inflation indicators which will be worth keeping a close eye on.
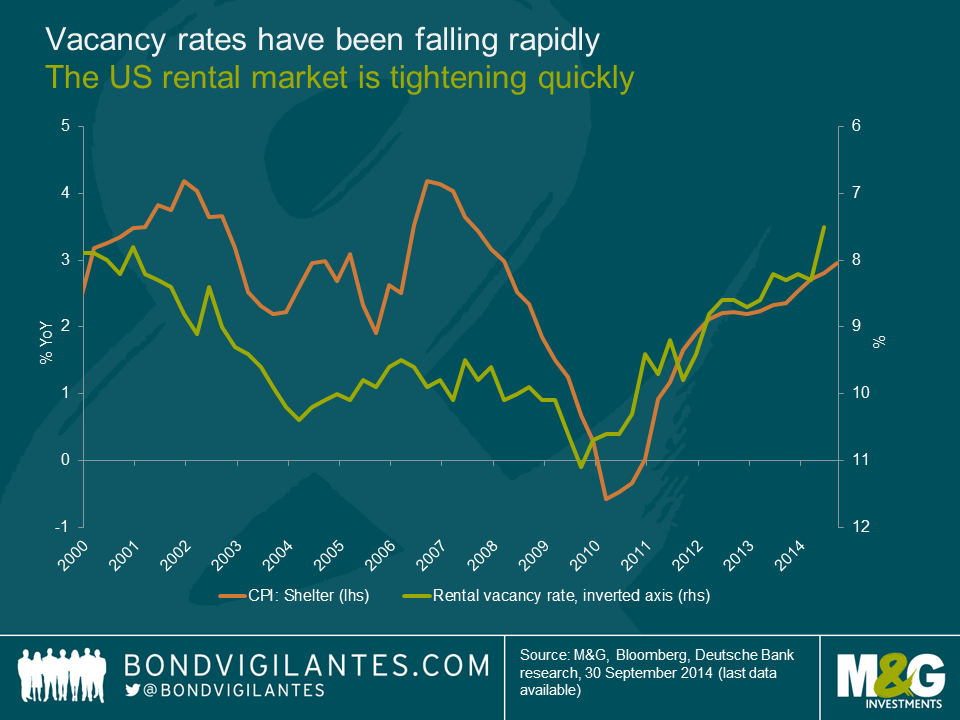
The first one is residential rents. Shelter is one of the largest components in the US core consumer price inflation, and is derived from housing costs based on rent, not home prices.
As shown in the chart below, vacancy rates have been falling rapidly and are just 7.5% today, the lowest level on record, suggesting the rental market is quickly tightening and the costs of renting will inevitably rise over the next 12-18 months. If this trend continues, current housing supply could soon become insufficient to meet the increasing demands of a stronger job market and increase in household formation.
Moreover, based on current vacancy rates, housing rents could rise at 4 to 4.5% over the next 12 months. And since rents account for roughly 40% of the core CPI, higher rents could push the annual inflation rate up significantly.
The second indicator worth paying attention to is healthcare costs. This is the largest component of the personal consumption expenditure index, or ”PCE deflator” (i.e the one the Federal Open Market Committee (FOMC), tends to follow), as it accounts for approximately 20%.
Medical inflation is also likely to benefit from a stronger job market. With jobless claims at multi-year lows and private non-farm payrolls now above the pre-crisis peak, the demand for healthcare should rise. Furthermore, according to the US Department of Health and Human Services, the new “Obamacare” plan is likely to increase healthcare expenditures as previously uninsured individuals have now been granted access to medical care. Over time, the increased demand for healthcare against a relatively constant supply, should put upward pressure on medical prices.
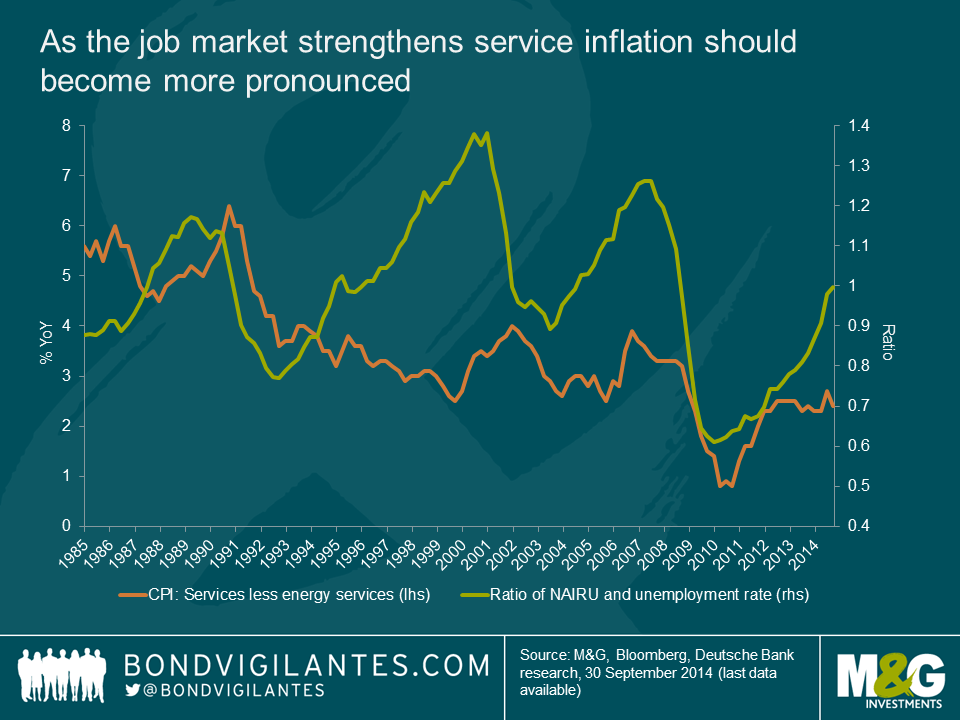
For the last three years, service-related prices have been consistently running above 2%. Going forward, as the job market strengthens, and wage pressures become more evident, service inflation should become more pronounced. The graph below shows how the correlation between the two has been reasonably strong since the great financial crisis.
So far, the biggest drag on inflation has been the downward pressure on goods prices coming from overseas. However, given service sector inflation has three times the weight of goods inflation in core CPI, it would take an unusually large decline in the latter to prevent inflation from trending higher from here.


Sign up to the Bond Vigilantes mailing list to ensure you never miss a great article from our expert Bloggers. We will email all new articles to your inbox, meaning you can stay on top of the world of Bonds.
I confirm that I would like to receive information about Bond Vigilantes and products and services from M&G Securities Limited.
We will use the email address and personal data you have shared with us to send you this information. For existing customers, submitting your contact details and requesting to receive this information from us, will replace any earlier choices you have made in respect of marketing information.
You can unsubscribe from marketing at any time, at which point we will not send any further marketing information to you, by selecting the unsubscribe link in all communications.


