


Either longer dated index linked gilts are very vulnerable, or the UK economy is
If at the beginning of 2014 you had made a list of what you thought would be the best performing fixed income asset classes globally for the coming year, it’s very unlikely you’d have put UK index-linked gilts at the top. It’s probably even less likely that you’d have put Argentina’s (hard currency) bond market in second place, especially if you had been told that Argentina would default in 2014.
Given the startling 19.9% performance from inflation-linked gilts* this year, you might think that the UK has some kind of inflation problem. In fact it has been quite the opposite. Last year the UK Consumer Price Index (CPI) rose by 2%, bang on the Bank of England’s target, but data released on Tuesday showed that CPI inflation was just 1.0% in the year to the end of November 2014. Meanwhile longer term market implied inflation expectations have also slumped – taking the 10 year breakeven inflation rate, the UK bond market is pricing in an average annual inflation rate for the Retail Price Index (RPI) of about 2.6% for the next decade, down from above 3.1% at the beginning of the year (RPI is the inflation rate used for linkers). Assuming an RPI-CPI long term wedge of 1.3% as per the Bank of England’s estimate (see p34), this equates to an average CPI rate over the next decade of roughly 1.3%, which is 0.7% below the Bank of England’s 2.0% target rate.
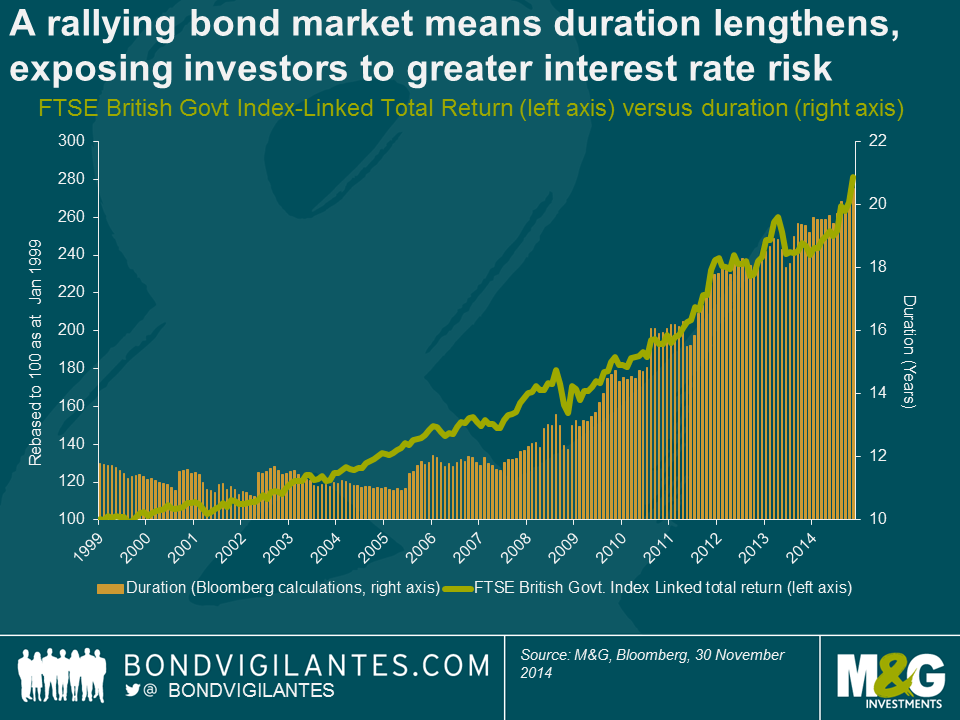
The primary reason for the index-linked gilt market’s phenomenal return is that the asset class has become an exceptionally long duration asset class at a time when government bond yields have plummeted, where duration is the sensitivity of a bond’s price to a change in yields. In essence, therefore, index-linked gilt funds have been behaving like high beta conventional gilt funds.
The reasons for the dramatic duration lengthening of the inflation linked gilt market are twofold. Firstly, as illustrated in the chart below, the market has become longer and longer duration as the market has rallied, but to a large extent it’s because the market has rallied. In a big bond bull market, such as the one that the linker market has had for close to 20 years, longer dated bonds tend to outperform owing to their longer duration. Long dated bonds therefore form an increasing portion of a market weighted index, meaning that the duration of the overall index rises as the market rises. Therefore, you end up with the rather uncomfortable situation whereby a rallying market means that the interest rate risk (duration) of the asset class is increasing at the same time as the potential returns fall as yields head towards zero (inflation linked bonds is that yields can, and have, sailed through the zero bound, but in the absence of rising inflation expectations, real yields will by definition struggle to move lower when nominal yields hit the zero bound).
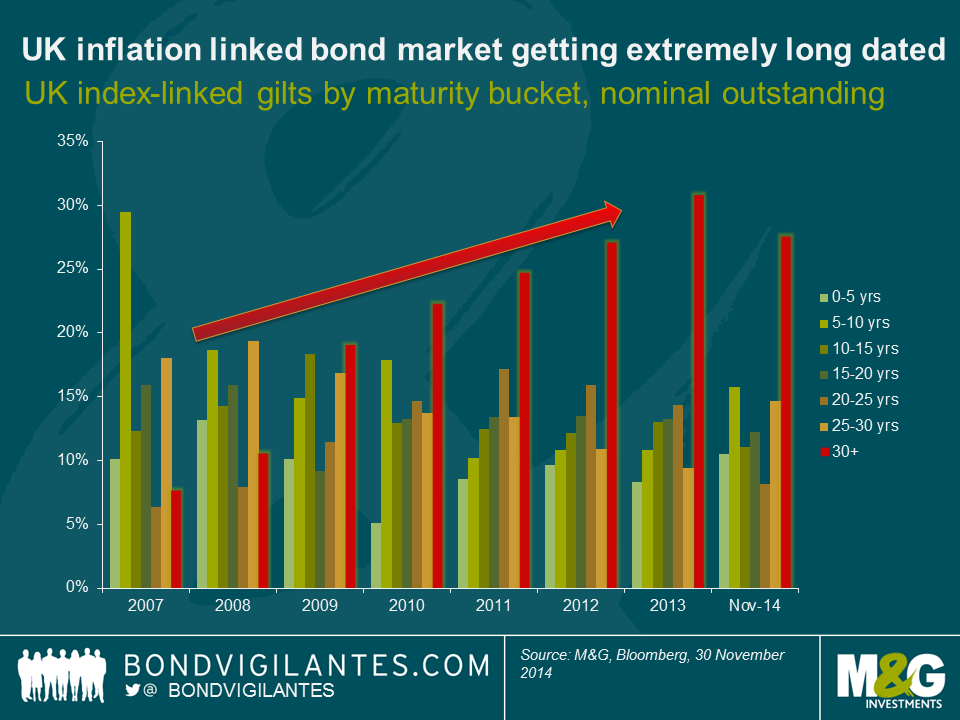
The second reason why the duration lengthening in the index linked gilt market has been particularly acute is because of the sheer quantity of issuance of long and ultra-long dated inflation linked gilts, as the UK’s Debt Management Office has sensibly attempted to feed the insatiable demand from domestic pension funds et al for long dated inflation hedges. The chart below plots the evolution of the linker market by maturity band, taking the nominal amount of debt outstanding, and it’s notable how the 30 year + maturity bucket has more than trebled since 2007.
Today, the longest dated index-linked gilt has a maturity of 2068, and has a duration of 52 years. The bond’s real yield started this year at +0.04% and had dropped to -0.73% by the end of yesterday, resulting in a year to date price return alone (i.e. excluding interest) of +48.7%. Who said bonds were boring?
Long dated real yields at such negative levels are disturbing. Perhaps the market is completely mispriced and we’re set for a return to an era of positive real yields again. If this happened, it would hand investors hefty losses (if the real yield on the linker 2068 went from -0.73% to +1%, the bond’s price would fall by almost 60%).
But if the inflation linked gilt market is accurately reflecting fundamentals, it paints an exceptionally bleak picture of the UK’s long run growth potential. The bond markets are clearly buying the secular stagnation argument (see here for further reading). As shown on a previous blog (see first chart here), there has been a reasonably close correlation between UK nominal GDP growth rates and long term nominal gilt yields going back over a century. Inflation linked gilts have only been around since the early 1980s, but it follows that there should also be a relatively close correlation between UK real GDP growth rates and long term real yields. Long dated index-linked gilt yields are -0.7%, but these are priced off RPI, not CPI – so applying the 1.3% RPI-CPI wedge as per above gives you a real yield of about +0.6% in CPI terms.
If the bond market is right, and the UK’s long term growth potential is only +0.6% per year, then Japan’s experience of the last two decades will end up looking like a relatively good outcome.
* The FTSE UK Index Linked All Stocks Index had returned 19.9% up to yesterday in GBP terms, while the slightly more commonly used FTSE UK Index Linked Over 5 year Index had returned 22.5%.
The value of investments will fluctuate, which will cause prices to fall as well as rise and you may not get back the original amount you invested. Past performance is not a guide to future performance.
19 years of comment
Discover historical blogs from our extensive archive with our Blast from the past feature. View the most popular blogs posted this month - 5, 10 or 15 years ago!


Bond Vigilantes
Get Bond Vigilantes updates straight to your inbox