


Is now the time to buy long-dated USD IG corporate bonds?
Credit curves are usually upwards sloping; as you’d expect, investors require more of a credit risk term premium for lending for a long time than for a short time, all else being equal. As the charts below show however, the steepness of USD IG non-financial credit curves has become rather extreme in 2014. At year end, the asset swap (ASW) spread differential between c. 25 years and c. 2 years weighted average life (WAL), a simple measure for curve steepness, had risen to 129 bps, which is within the top quartile of monthly readings over the past decade. In contrast, the EUR IG credit curve steepness has not followed a clear trajectory in 2014, bouncing back and force between values in the high-50s to mid-60s bps range (c. 14 years into c. 2 years WAL).

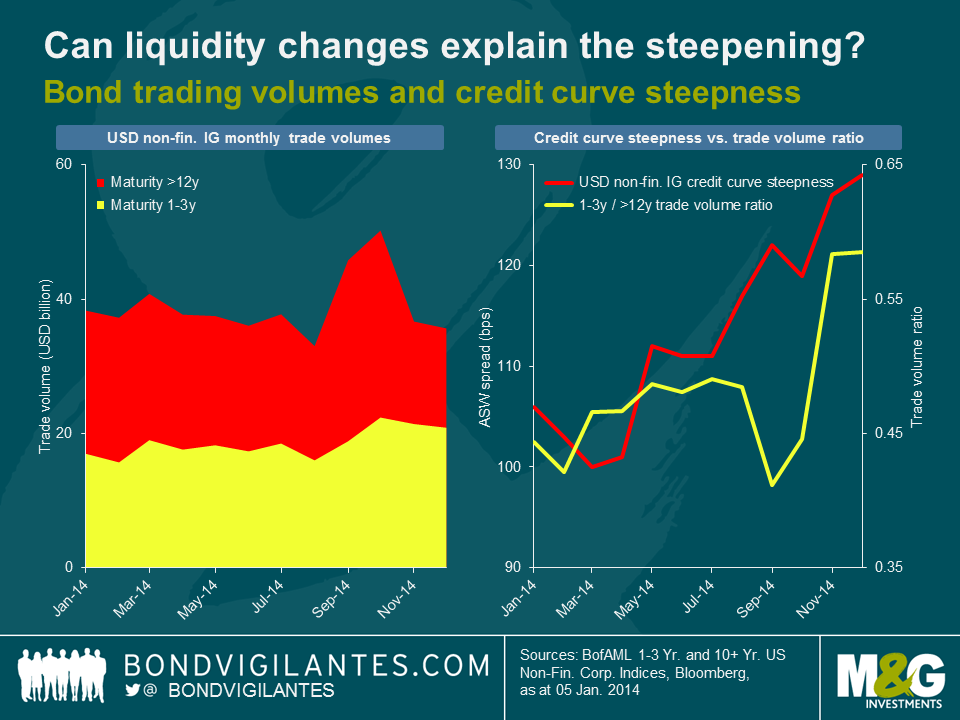
So what has been driving the steepening of the USD IG credit spread curve? We first took a look at liquidity levels of USD IG non-financial corporate bonds, using TRACE (Trade Reporting and Compliance Engine) market flow data as a proxy. As shown in the charts below, the ratio of short-dated to long-dated bond trade volumes has ticked up in the course of last year. The steepening of the credit curve might therefore be partially explained by investors calling for an increasing spread differential between long- and short-dated bonds as reimbursement for the relative liquidity decrease at the long end compared to the short end. Liquidity considerations cannot be the only relevant factor, of course. From August to October, for example, credit curve steepness and trade volume ratio moved in opposite directions. Also, our trade volume based liquidity measure does not take into account whether bond buying or selling dominates. Therefore, higher liquidity levels do not necessarily translate into lower credit spreads, and vice versa.
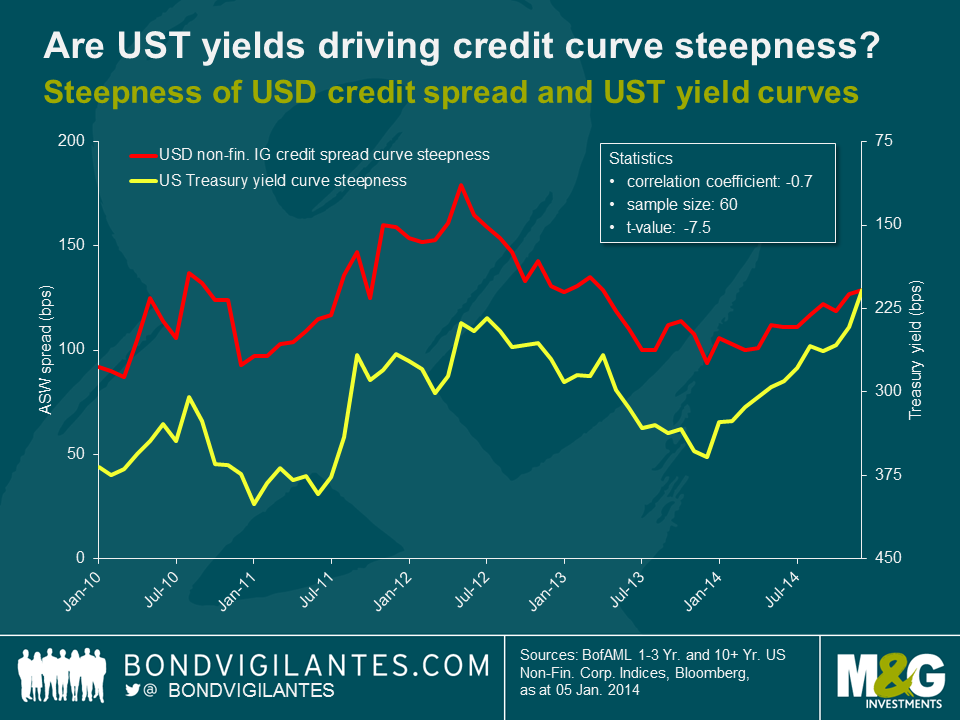
It is quite possible that in fact the focus on yield of USD credit investors has been the major reason for the steepening of the credit spread curve. The chart below shows the evolution of credit curve steepness and, on an inverted vertical axis, U.S. Treasury (UST) yield curve steepness (difference between 30 year and 2 year generic UST yields) over the past 5 years. The curves show a remarkably strong negative correlation (-0.7), i.e., a flattening of the yield curve usually coincides with a steepening of the credit curve, and vice versa. Hence, the steepening of the USD IG credit curve throughout the past year might have actually been driven to a large extent by yield investors demanding a higher and higher spread premium for long-dated credit exposure to get compensated for the lower and lower UST yield pick-up, which has dropped from nearly 330 bps in January 2014 to c. 210 bps at year end.
Corporate bond investors have to take the inverse relationship between credit curve and UST yield steepness into account. On the one hand, they can pick up an extra credit spread of c. 130 bps at the long end. But on the other hand, the extra yield on 30 year vs. 2 year Treasuries has shrunk considerably. Currently, the differential amounts to only around 195 bps, the lowest steepness reading since January 2009. However, if investors are able to take pure credit risk exposure, for instance using a UST futures overlay, long-dated USD IG credit does look rather appealing at the moment. The question is, whether the steepening of the credit spread curve is likely to continue or not. If the shape of the UST yield curve is indeed the dominant factor, then a lot will depend on how the yield curve reacts to possible (and widely anticipated) rate hikes by the Federal Reserve in 2015. Unsurprisingly, rate hikes in the past have usually been accompanied by a flattening of the UST yield curve. So there is a chance that the credit spread curve continues to steepen against this backdrop. However, as UST yield curve steepness has already fallen by c. 120 bps in 2014 (and another c. 15 bps in January 2015), arguably the effects of gentle rate hikes in 2015 have already been priced in to a large extent by now.
The value of investments will fluctuate, which will cause prices to fall as well as rise and you may not get back the original amount you invested. Past performance is not a guide to future performance.
19 years of comment
Discover historical blogs from our extensive archive with our Blast from the past feature. View the most popular blogs posted this month - 5, 10 or 15 years ago!


Bond Vigilantes
Get Bond Vigilantes updates straight to your inbox