
Rolldown
A dispatch from the number crunchers – Yield curve rolldown
By Matthew Russell
15 April 2026

We have frequently written about investment grade (IG) credit spreads over the course of the past year. Today I’m going to dissect the IG universe further and take a look at quality spreads, i.e., the additional risk premium investors can earn when switching from one credit rating band into the next lower band.
The chart below shows how the differential in asset swap (ASW) spread between AA and single A rated industrials, both in USD and in EUR, has evolved over the past three years. In addition, the difference between AA/A quality spreads in USD and EUR is given.
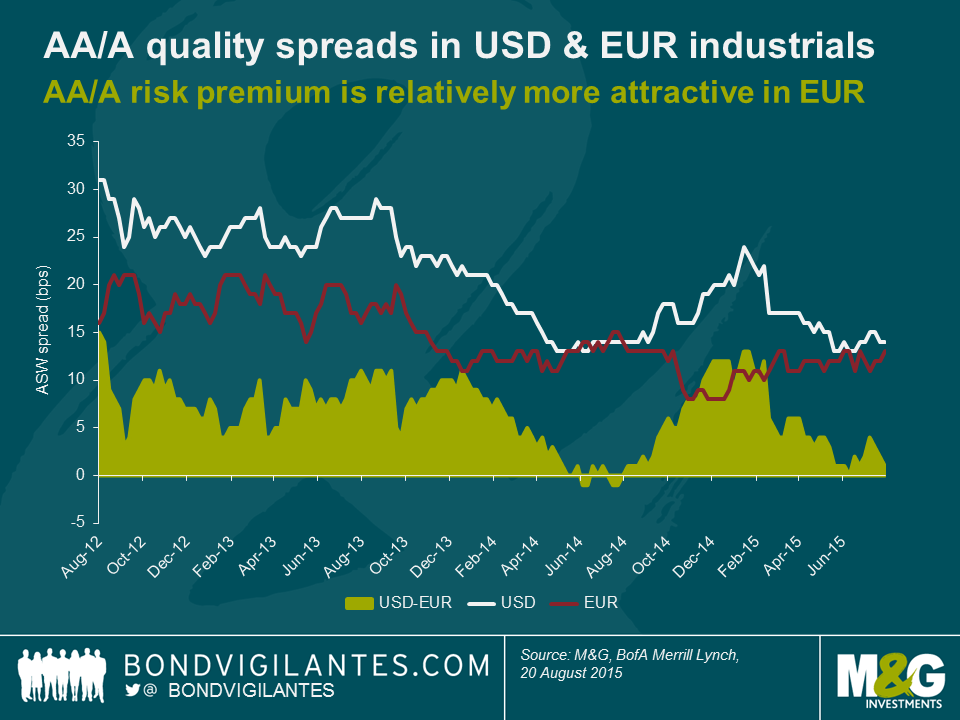
Here are our three key takeaways:
The chart below illustrates a very similar analysis compared to the one above. Only this time we have focused on A/BBB quality spreads in USD and EUR.
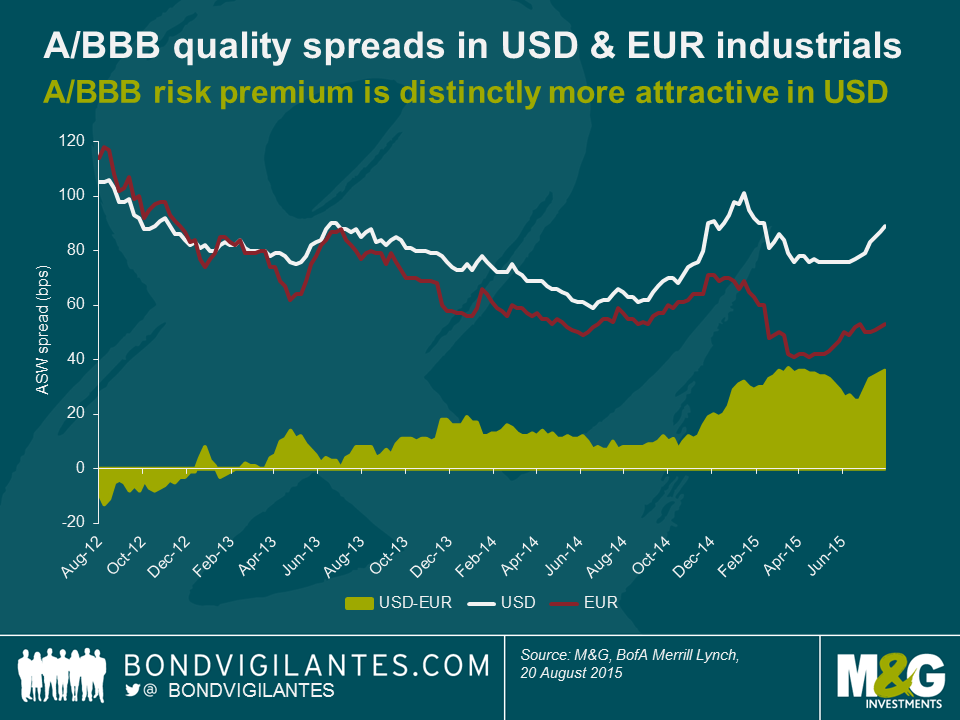
These are our three main conclusions:
There are some caveats to this analysis, though. First, we have only been looking at broad credit rating bands. This approach ignores the profound disparity of risk exposures within these bands, particularly between strong BBB+ and weak BBB- corporate bonds. Second, there are duration mismatches between the EUR industrials indices used to calculate quality spreads. In terms of effective duration, the EUR AA index is 0.9 years longer than the single A index, which in turn is 0.4 years longer than the BBB index. Therefore, both the EUR AA/A and the EUR A/BBB quality spread figures above are slightly understated as differences in term premium are ignored. In contrast, the USD industrials indices differ only marginally in their effective duration levels.
General limitations like these aside, how are quality spreads going to evolve in the future? Let’s take a look at two key factors.
In conclusion, we see good relative value in IG credit spreads at the moment. In terms of credit rating bands, although it is of course always a case-by-case decision, we believe that in general the AA/A quality risk premium is relatively more appealing in EUR, whereas the A/BBB quality risk premium is currently distinctly more attractive in USD.
On the 7th of September £38bn worth of UK gilts (4.75% 2015) will mature. The Bank of England (BoE) own just under half the issue, having purchased the bonds through its £375bn quantitative easing (QE) programme. At this point in time, the BoE have indicated that they are committed to keeping the size of the QE program at £375bn. As a result of the 2015 bonds maturing, the bank will therefore have about £17bn to invest back into the UK government bond market.
In my view, this is the equivalent to an easing of monetary policy. This is because the average duration of the BoE’s gilt holdings will increase, and therefore the £17bn re-investment in gilts will have a larger (downward) effect on gilt yields than it currently does today.
The BoE has helpfully laid out a few rules as to how they execute this sort of reinvestment. Firstly, the cash will be invested equally (£5.6bn) across three maturity buckets; 3-7yr, 7-15yr and 15+ yrs. Secondly, the BoE has stated that they will not purchase more than 70% of an individual bond issue.
All else being equal, an inflow of £17bn into the gilt market will clearly put downward pressure on yields along the length of the curve – and that doesn’t even take into account the other £21bn that private investors will have to find a home for. As there are fewer bonds in the 7-15yr bucket than either the short or long dated buckets my feeling is that the reinvestment should have a disproportionately positive effect on this part of the yield curve.
The individual bonds that the bank will buy and hence which yields could be the most squeezed is -unsurprisingly – something of a debate within the gilt market. Focusing on just the 7-15yr maturity bucket, we can see below that the bank own a substantial amount of the 4.25% 2027’s whilst owning a very small percentage (or none at all) of some of the other outstanding gilt issuance.
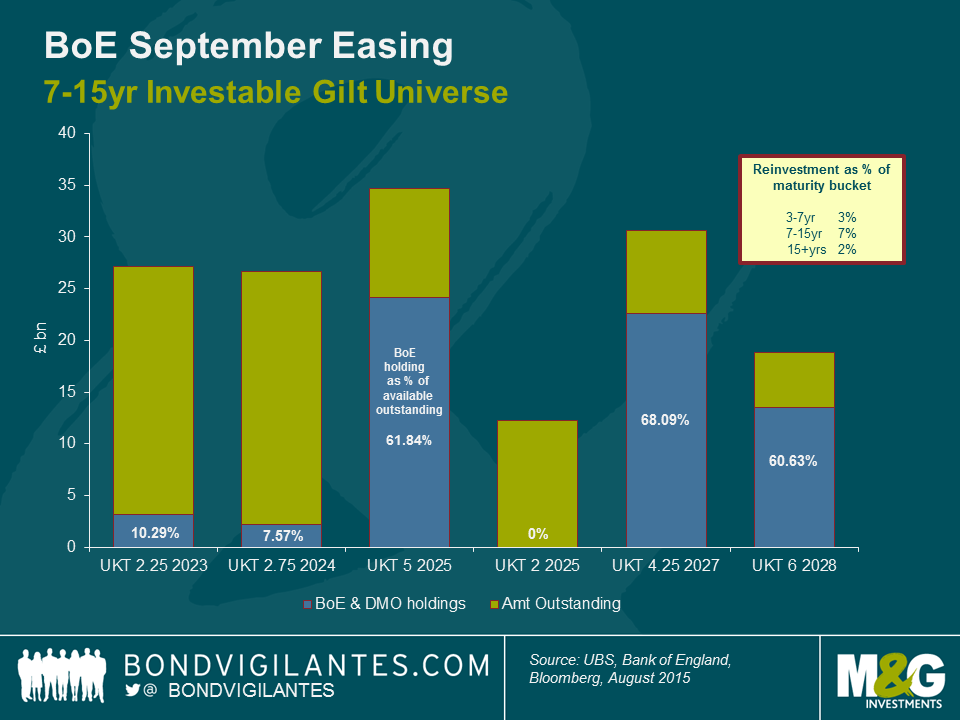
My view is that the gilts that the BoE already has a fairly large holding in (over 60%), but not so large that there isn’t much room for them to buy more before hitting their 70% ceiling are likely to benefit the most (such as the 5% 2025s and 6% 2028s). Given these technical dynamics, gilt investors could benefit from lengthening duration and focusing on the belly of the gilt curve in coming weeks.
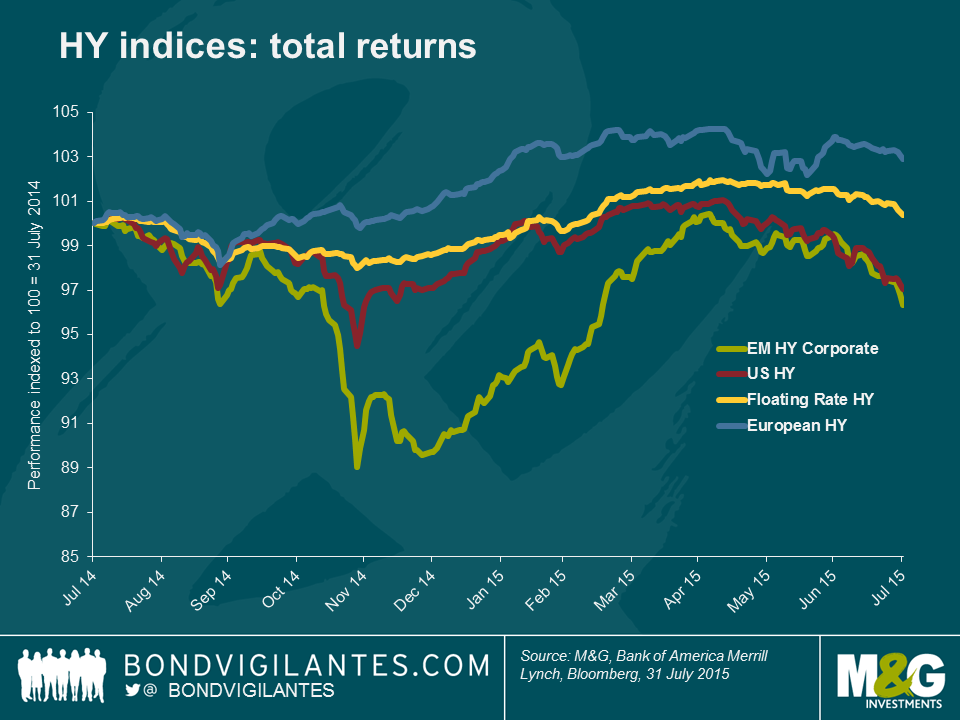
We have seen a fairly swift and deep sell off in both commodities and emerging market equities over the past few months. The recent moves are now feeding through into a more broad-based sell off in risk assets. It appears an opportune time to take stock and see how exposed the various high yield markets are to these trends.
In order to assess any impact, I will firstly consider direct exposure, defined as the proportion of the market that is emerging market domiciled (i.e. exposure to the potential double whammy of both a slow-down in growth and a currency depreciation) or those parts of the market that are engaged in the commodity space (defined as issuers within the energy, mining and steel sectors). Secondly I will look at indirect exposure, or to put it another way, how vulnerable the respective high yield markets could be to a more general re-pricing of risk given the differences in terms of duration, credit rating and capital structure. For the sake of brevity I will use four broad indices (all published by Bank of America Merrill Lynch), the US High Yield Index, the European Currency High Yield Index, the High Yield Emerging Markets Corporate Plus Index (a hard currency index) and the Global Floating Rate High Yield Index. This is by no means exhaustive and there are instances of overlap between them but when trying to consider the broad outlines of the US, European, EM hard currency and Floating Rate high yield markets we see them as reasonable proxies.
High yield market direct exposure
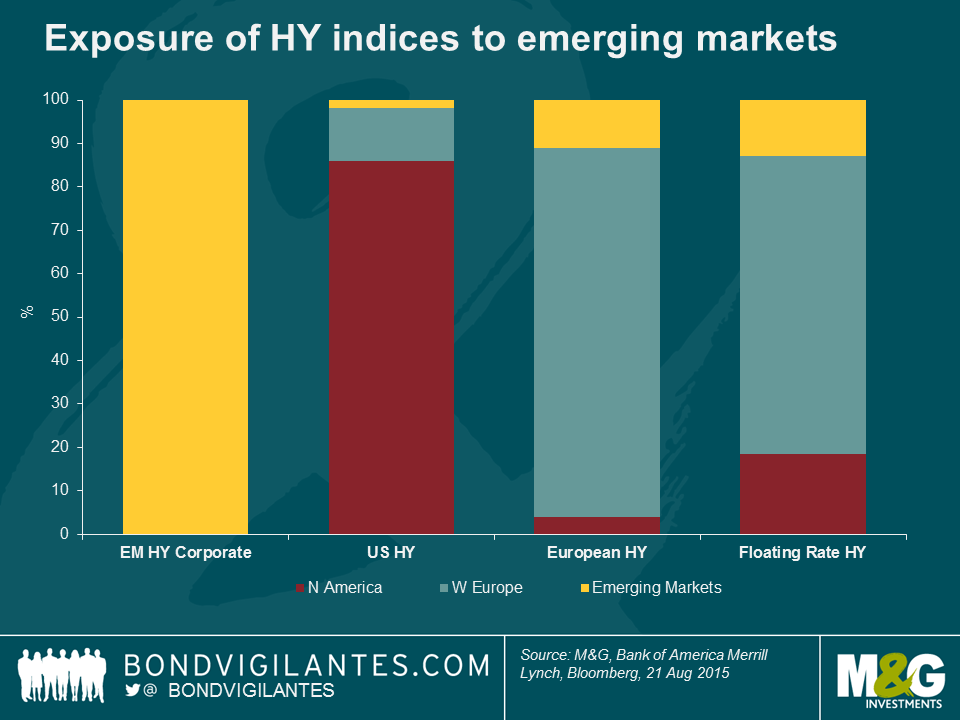
By definition the Emerging Market index is the most exposed, but what is perhaps more interesting is the relative exposure within other markets. The US High Yield market has very little direct exposure but due to a difference in index rules, emerging market issuers issuing in European currencies are eligible for inclusion in the European high yield index with the same being true for the Floating Rate index. Hence there is a comparatively higher level of direct exposure, albeit it’s still fairly limited in absolute terms at 11% and13% respectively.
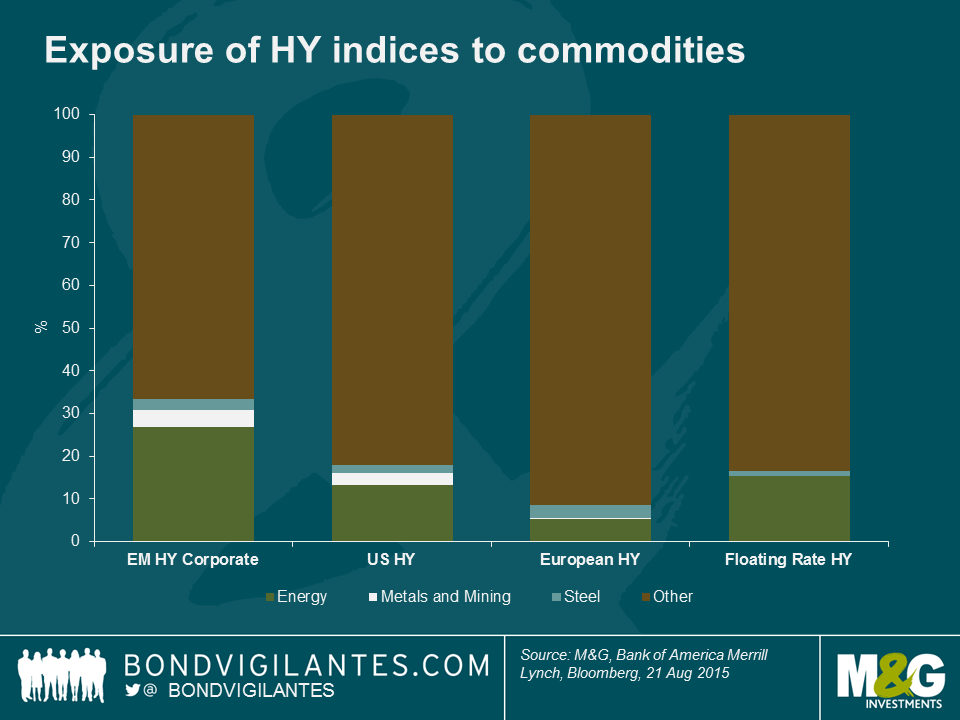
In terms of direct commodity exposure, the Emerging Market index is the most exposed with 34% of the market classified within energy, metals and mining or steel. The US market follows with 18% exposure given and the Floating Rate market is close behind at 17%. The European market is far less exposed at a little under 9%.
High yield market indirect exposure
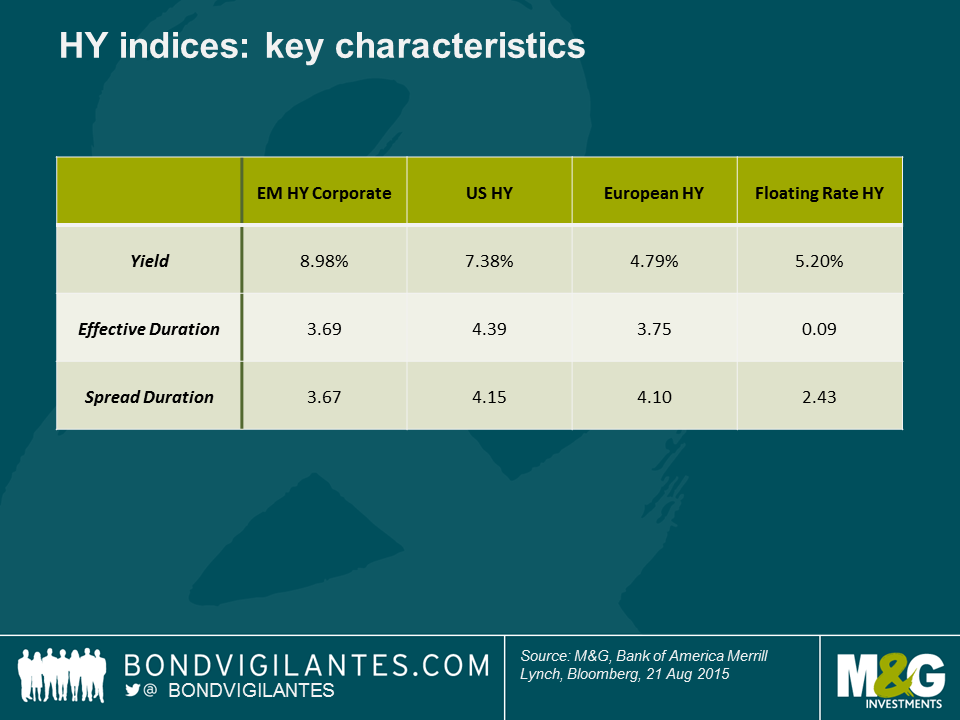
The key metric to consider when looking at the exposure to broader market moves for credit indices is spread duration. Broadly defined this is the capital loss in % for every 1% move in credit spreads. So assuming all credit markets traded 100bps wider, the US High Yield Market would see a capital loss of approximately 4.1%. Of course, this sort of move is never uniform but on this measure both the US market and the European markets have more credit risk “beta” than the EM High Yield market and the most defensive is the Floating Rate high yield market with only 2.4 years of spread duration.
Interest rate duration (effective duration below) should also not be ignored. Credit spreads and government bond yields have historically maintained an inverse relationship (albeit less so in the era of quantitative easing). Accordingly a flight to quality that pushes down government bond yields should help lower some of the price volatility caused by spread moves. The exception to this is the Floating Rate market which has very limited interest rate duration – short term price moves are almost entirely driven by credit spreads alone. Nevertheless, we would expect spread moves to dominate any move in the government bond market when it comes to the high yield markets, hence the focus on spread duration.
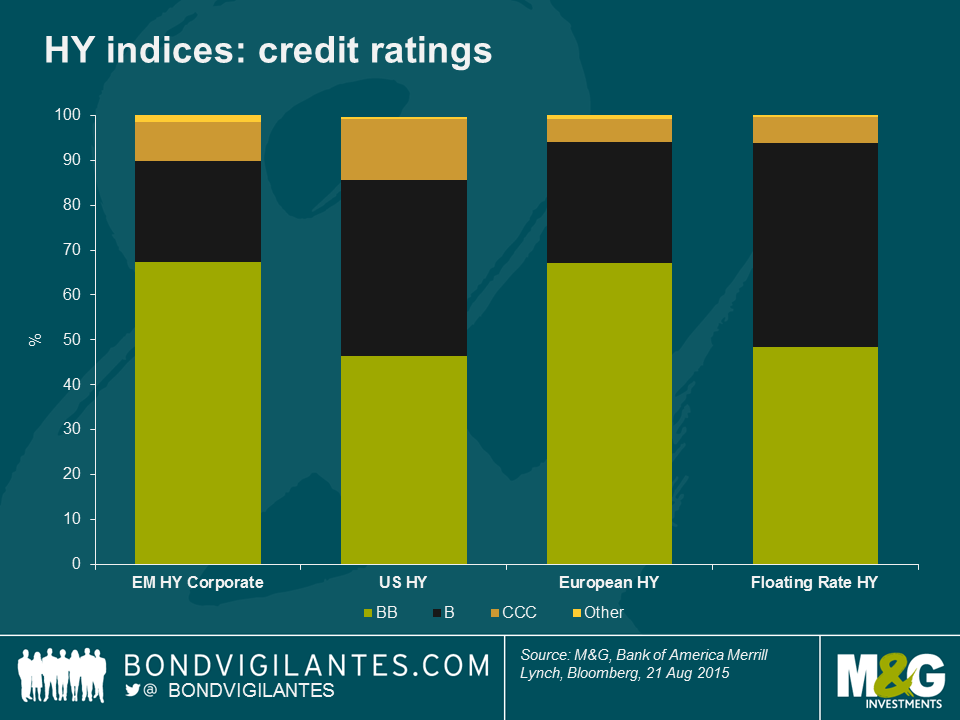
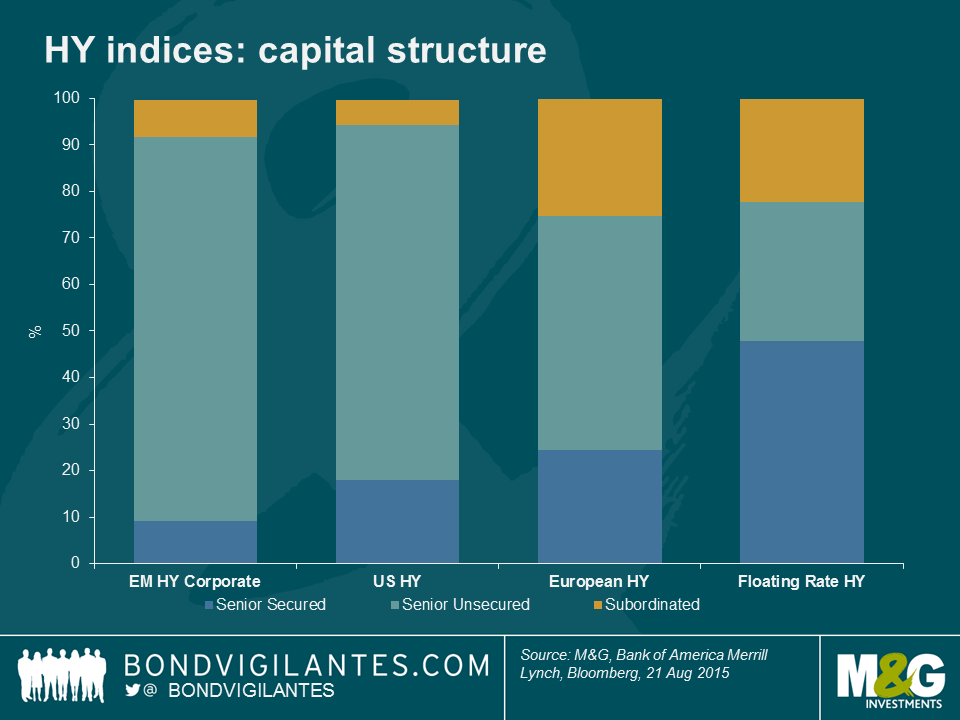
How about differences in credit risk? The chart below shows that in terms of rating the highest quality market on this measure is in fact the EM index with the European market very closely behind. Both the US and Floating Rate markets have a higher proportion of B rated bonds relative to less risky BB bonds. However, we should also consider capital structure differences as this can have a big impact in terms of credit losses during a default. On this measure the Floating Rate market is the most defensive with just under half the index classified as “senior secured” whereas both the US and EM markets are dominated by “unsecured” bonds which rank lower in terms of creditor preference and so are perceived by the market to be more risky.
Bringing it all together, when we consider all the factors above, the European high yield market is probably the least exposed fundamentally to both commodity and emerging market risk and indeed is the least risky in terms of credit rating. However, in terms of capital structure and credit “beta” (spread duration), the Floating Rate market is the most defensive. Accordingly it shouldn’t come as a huge surprise that the European and the floating rate markets have held up relatively well during this sell off as shown in the below chart. Consequently, any major further weakness in either the Floating Rate or European market due to an emerging market or commodity related correction could be an interesting opportunity.
Turning to US and EM markets, with its well-publicised exposure to shale credits, the US market has already taken some pain following the correction in WTI prices as we have previously written about. Nevertheless, when we look at the fundamentals we need to remember it is still dominated by both domestic and non-commodity related issuers –this is where the more interesting value is starting to emerge. In contrast, it could be argued that the EM market looks vulnerable given it has seen a very similar price dynamic but with far more fundamental risk when it comes to domestic emerging market economies and indeed with more exposure to commodity related sectors.
I keep hearing the argument that the Fed needs to hike, so that if the US economy slows down again it will have room to cut rates once more. In other words it needs to get away from the zero bound so that the traditional monetary policy tool of rate cutting comes back into play in the future. In less cerebral moments I may have made this argument myself, but I’m struggling to remember why it might be a good idea. Surely for this to make sense you’d have to argue that a, say, 50 bps hike from 0.25% to 0.75% is less powerful in slowing the economy than a 50 bps cut from 0.75% to 0.25% is in stimulating it? Or believe that hiking rates is a sign of confidence in the economy and is therefore stimulative (on the other hand a later emergency cut back down from 0.75% if growth stalled might not send the best signal either). I don’t know – does the “hike so that you can cut” argument make any sense?
Next up, your robot digest. You can’t move for robot stories on Twitter at the moment. There’s lumbersexual Google forest-running robot, and Erica, a realistic looking android from Japan who has been made even more humanistic by saying “hmmmm” and frowning if she doesn’t have a proper answer in her data chips to answer your questions. We have Martin Ford’s new book, The Rise of the Robots, out in a couple of weeks, and to counter all the “robots are stealing our jobs” stories, Deloitte has published a study showing that technology is a “job creating machine” increasing spending power and demand in the economy. But whilst the headlines are obsessed with the “humanisation of robots”, more scary is the “robotisation of humans”. The negative headlines that Amazon received this week about its working practices as a result of a New York Times article lead me to this horrifying Mother Jones article from 2012, “I was a Warehouse Wage Slave”.
Talking of the rate of robotisation, here’s a chart showing the number of robots per 10,000 manufacturing humanoid employees. You can see that Japan leads the way in the large economies with a 2012 robot density of 332, Germany isn’t far behind, but the US and especially China have much lower densities. On the same chart I have put forecast demographic dependency ratios – in other words the retired as a percentage of people of working age by 2035. You can see that there’s a decent relationship. Is robot building driven by future expected working population declines? The UK population is growing, largely from immigration (+500,000 in 2014, more than half of which was net migration). Perhaps the well discussed productivity weakness in the UK is due to our low robotisation rate, which in turn comes from our high labour force growth relative to those countries with more robots?

Finally a summer book recommendation for you. I hadn’t read any geeky sci-fi for some time, but Ready Player One by Ernest Cline – set in a future obsessed by 1980s popular culture (computer games, music) – is brilliant. I’d recommend some good new music too, but that hasn’t been any so far in 2015. Not one bar of it. Hang on, maybe the Hookworms LP came out this year…*checks*…nope, 2014, as you were.
We recently highlighted a bond covenant that benefited fixed income investors. After the good, this week we have seen the bad. In this case, a bond covenant may impact bondholders in a detrimental way. Both examples are evidence of how critical it is to have a thorough understanding of bond documentation ahead of investing in a bond.
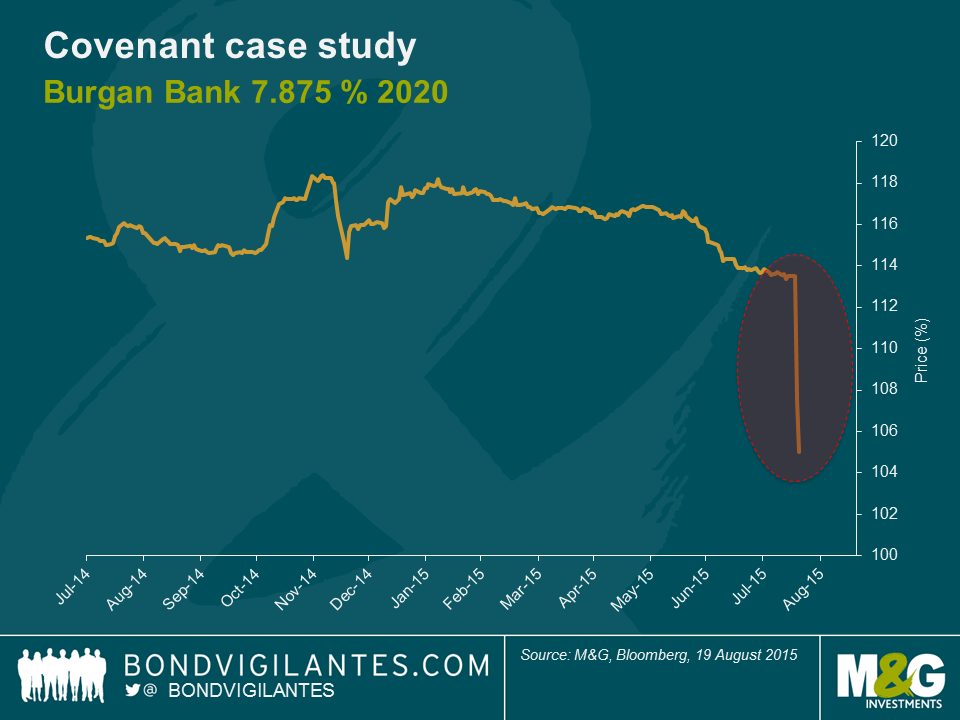
Kuwait’s third largest bank, Burgan Bank, announced in a regulatory filing that they had received approval from the Central Bank of Kuwait to redeem $400 million of outstanding subordinated bonds. In Burgan Bank’s instance, the 2020 subordinated bond – old-style Tier 2 capital – cannot be redeemed prior to 29th September 2015. These bonds were trading at a cash price of 113 as of Monday 17th August 2015.
Approval was granted by the central bank on the “redemption for regulatory capital treatment reasons” covenant. This clause is very common in bank bond documents. It gives the issuer the option to redeem at par or 101 any outstanding bonds that have lost their regulatory capital status in case of a change of regulation.
The Central Bank of Kuwait had announced the transition to Basel III capital adequacy in early 2014, with old-style Tier 2 capital not benefiting of any phase-out period unlike in Europe where there is grandfathering. The implementation of Basel III was effective in June 2014. Hence, nothing new here.
However, the Burgan Bank 7.875% 2020 bond document states on page 25 and 26 that:
Redemption for regulatory capital treatment reasons
If at any time after the date of issue of the Notes a Regulatory Event occurs, subject to the prior written approval of the Central Bank of Kuwait, the Guarantor may on or after 29 September 2015, by written notice, require the Issuer to, having given not less than 30 nor more than 60 days’ prior notice to the Noteholders (which notice shall be irrevocable), redeem in whole, but not in part, the Notes in accordance with these Conditions at their principal amount together with interest accrued to the date fixed for redemption, provided that both at the time when the notice of redemption is given and immediately following such redemption, the Guarantor is or will be (as the case may be) in compliance with the Applicable Regulatory Capital Requirements (except to the extent that the Financial Regulator no longer so requires).”
“Regulatory Event” means an event where, as a result of any change of any law or regulation occurring after the date of issue of the Notes, the Loan ceases to be eligible to qualify in full as Tier 2 Capital for the purpose of the Capital Regulations, provided that no Regulatory Event shall be deemed to have occurred if such non-qualification is as a result of either (a) any applicable limitation on the amount of such capital as applicable to the Guarantor, or (b) such capital ceasing to count towards the Guarantor’s capital base through any amortisation or similar process or any changes thereto (including any amortisation or similar process imposed through any grandfathering arrangements)”
In light of the above clause, Burgan Bank received from the Central Bank of Kuwait the approval to redeem their 2020 subordinated bonds on or after 29 September 2015. The covenant also states that the bonds are redeemable at par, which would result in a potential loss of around 13 points for existing bondholders should the bonds be redeemed.
At this stage, Burgan Bank has not officially announced whether it will or won’t call the bond. Given the high coupon on the bond (7.875%) and the current significant cash position of the bank, one might think the subordinated bonds will likely be called as it will materially reduce interest expenses and be in favour of shareholders. As of today, the bond is quoting 105 mid- price (101.3 / 108.7), reflecting a high probability (more than 50%) – assigned by the market – of the bonds being called.
Existing bondholders will not be happy should Burgan Bank call the bonds at par. This is why other options should not be ruled out. While very unlikely, the bank may choose not to redeem the bond as it has other outstanding bonds, such as a deeply subordinated hybrid security (a 7.25% perpetual), and may fear bondholders’ negative reaction. Another more plausible option is to launch a tender offer on the bonds at a price lying between par and where it was trading a few days ago, i.e. 113. In this instance, existing holders would get compensation for the loss of value. Credit Suisse had chosen this latter option when it called its Tier 1 7.875% hybrid in early February 2015. The bank offered to buy-back the notes at 103, while the notes were trading at 107 prior to the announcement.
This Burgan Bank example highlights how important it is to investors to perform covenant and regulatory due-diligence in order to avoid an ugly outcome.
*Please note we have no economic interest in Burgan Bank debt
How did the UK go from a manufacturing powerhouse in the 1950s, to economic destitution in the 1970s? Is the history of post-war UK economics one of policy mistake after policy mistake? And are Britain’s political and financial institutions better placed today to make good, long term decisions than they were in the past? In the latest of our series of interviews with authors of new economic books (see here for past editions with Ed Conway, Diane Coyle and Richard Koo) I spoke to David Smith, economics editor of the Sunday Times, about “Something Will Turn Up – Britain’s Economy, Past, Present and Future”. I loved this book, and it should be required reading for all students of the UK economy. Here’s the video interview.
We are also running a competition to win one of ten copies of David’s book. To win, send your answer to the question to bondvigilantes@mandg.co.uk by midday Tuesday 25 August. This competition is now closed.
Question: in the 1980s, the Leaviss family bucked the trend for owning good quality foreign made cars by owning only British Leyland/Rover/Austin produced models. At various times we had a Mini, two Metros, two Princesses, a big Rover with an automatic choke (remember chokes?) that never worked properly, and finally an MG badged Montego that we had to drive to Solihull to collect when it got hotwired at Rugby railway station and raced around West Midlands fields. Here is a picture of another British built car that we owned during that period. What (the hell) is it?

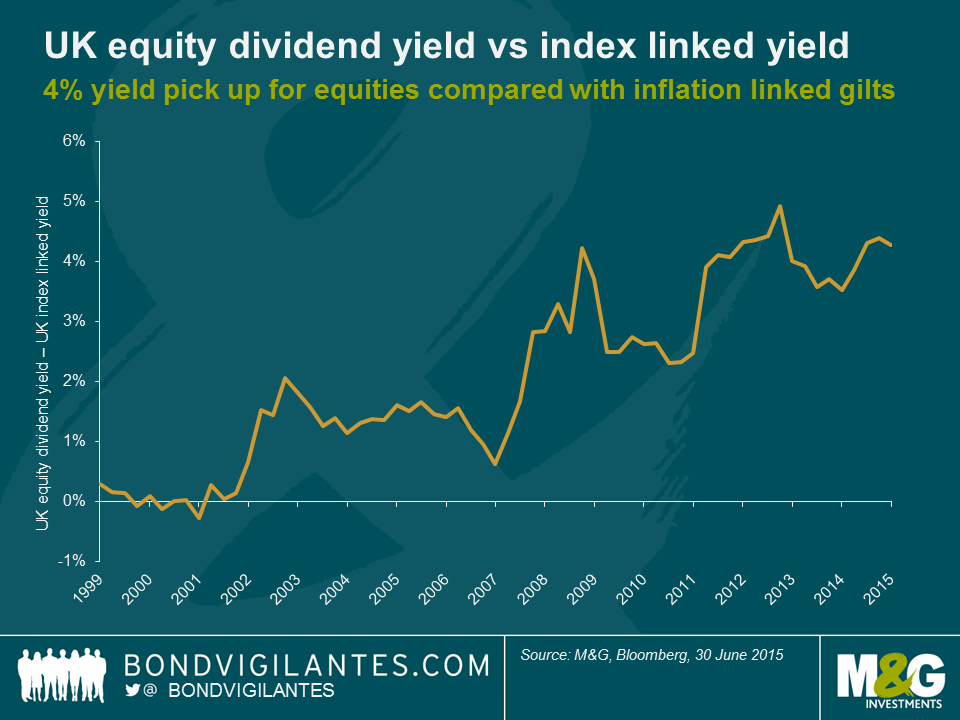
There ought to be a relationship between yields available on equities (earnings or dividend yields) and those on index-linked gilts and other inflation-linked bonds. Ex-ante, and adjusted for risk, expected returns should be similar across asset classes. In the case of equities and index-linked bonds, both asset classes give you exposure to “real” returns on both income and capital. For index-linked bonds this is explicit in the bond contract – coupons and final redemption proceeds are uplifted by the RPI in the UK, and CPI in most other markets. For equities the link is less firm, but still exists. Buying a share should give you exposure to the “real” economy. As inflation rises, companies are able to increase prices of the goods that they sell, and the assets that they own (inventories, equipment, property, patents) should also increase in price. Some of their liabilities – for example debt – will shrink in real terms (others won’t, for example wages, RPI linked pensions). But as owning a share in a company is like owning a share in the real economy, earnings and dividends should increase as inflation increases.
Therefore the yields on linkers and shares should be related over the medium term. But the chart below shows that the dividend yield on the FTSE 350 is currently over 400 bps higher than that available on the 10 year index-linked gilt (which currently has a negative yield). Back at the height of the dotcom boom, the relationship briefly reversed – you received a higher yield on UK government debt than on riskier equities, but since then the trend has been for equity yields to rise relative to bond yields.
This large valuation discrepancy could signal a significant increase in the perceived riskiness of shares relative to bonds over the past decade. But in fact credit spreads are around their lows for the cycle (so the high dividend yield probably doesn’t mean that the stock market expects companies to default in large numbers) and the VIX index, a measure of implied volatility in equities, is also near record lows. It’s worth remembering that in the 1970s, when inflation was out of control, equities did terribly, despite the link between dividends and inflation. Whilst dividends did rise, returns were destroyed by a collapse in the P/E multiple of equities. Could this be the reason for the gap between equity and linker yields – the expectation of high inflation causing multiples to fall? Unlikely again – over the next ten years the market expects RPI inflation to be around 2.5% (and this has fallen from 2.8% in June as the oil price weakens again). Neither do markets anticipate a deflationary future, with dividends being cut. Final explanations for the 4% yield pick-up therefore probably need to reflect the extraordinary monetary policy actions around the world (including QE), with negative nominal yields amid a savings glut dragging real bond yields down with them; and linked to those savings gluts we have extraordinary demand from pension funds for certainty. Having been structurally on the wrong side of the equity/bond trade (owning too many shares relative to their benchmarks linked to bond yields and inflation) over the years, pension fund de-risking is taking place as defined benefit schemes become mature. Index-linked bonds have structural demand, especially in the UK and the Netherlands.
As a trading tool, the chart above wouldn’t have helped you much – perhaps you would have sold equities at the start of the last decade, but when would you have bought them back? 2003? 2009? 2013? The market has kept making new yield spread highs thanks to the relentless rally in index-linked gilts. But on a valuation basis, you might well prefer the dividend yield of 3.8% plus growth on the FTSE 350 to the inflation linked -0.8% per year on 10 year index-linked gilts.
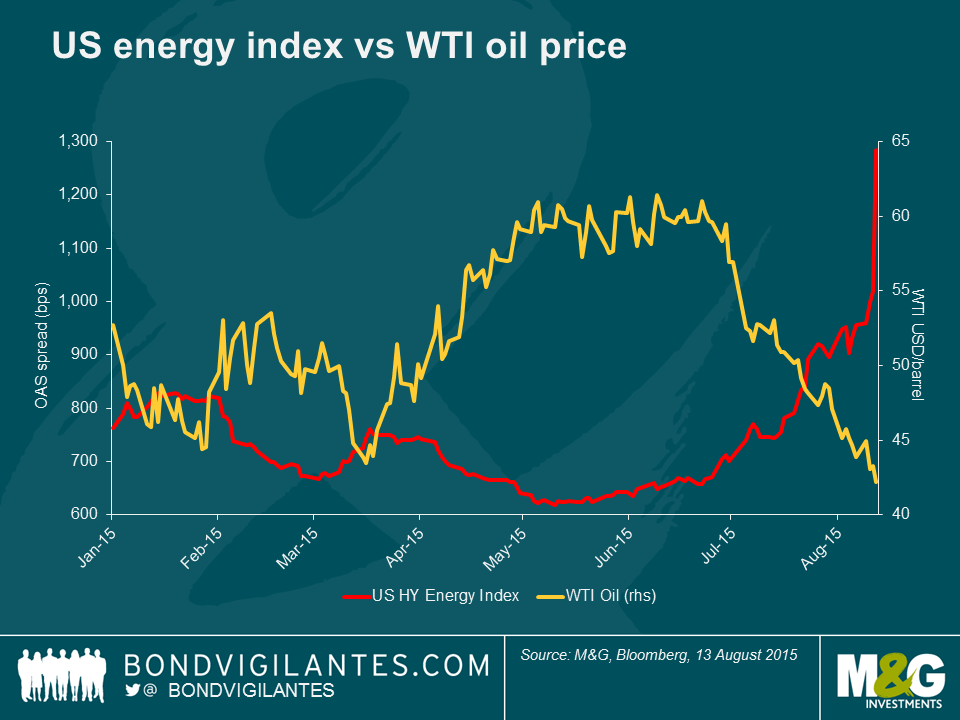
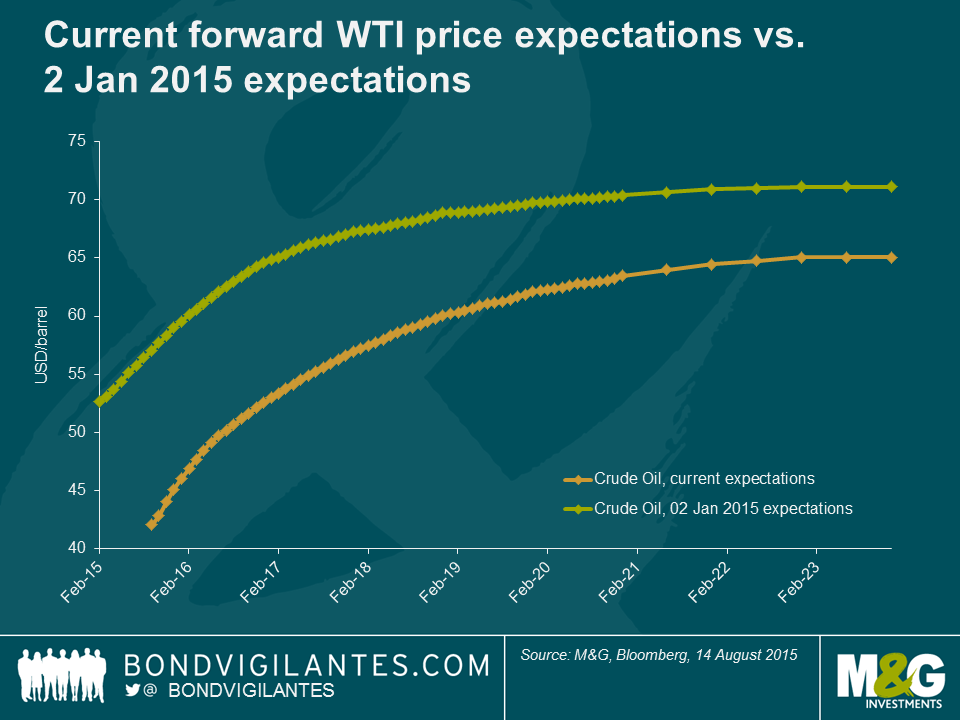
U.S. high yield energy bonds have sold off recently, virtually reversing their Q1/Q2 rally. The main culprit is, again, oil prices. The recent re-re pricing in oil has led to energy bonds trading at levels worse than the last time oil sold-off at the beginning of 2015. In fact, the BAML U.S. high yield energy index this week reached its widest levels (in terms of spreads) since April 2009 at 1019 bps.
While oil prices were trending lower throughout 2014 on slow global growth expectations, the sharp decline in late 2014 was prompted by OPECs decision to not curb production. Oil prices recovered briefly in Q2 as U.S. production cuts were expected to stabilise supply and support prices in the latter part of the year. So what has prompted oil to sell-off this time around? Well, global growth remains subdued and China’s outlook has worsened. Additionally, the devaluation of the yuan will exacerbate the pressure on commodity prices. Plus, U.S. production cuts have not been enough to offset unexpected supply from the Middle East including Iraq, while Saudi Arabia and Kuwait both posted record production levels last month. Oil prices also moved lower on the anticipation of new supply from Iran next year (estimates as high as 900k/bbd) on the back of sanctions potentially being lifted following the recent, tentative, nuclear accord.
There are a few reasons why high yield energy bonds have sold off more dramatically this time around.
Firstly, several energy companies that issued bonds secured by their assets (called Second Lien bonds) in Q1 and Q2 to extend their financial liquidity profiles have seen these bonds underperform massively. This has scared investors to the extent that this potential source of funding is effectively closed to other companies that would benefit from additional liquidity. This has had a knock-on effect on investor sentiment, with investors even abandoning bonds of companies that were not expected to need this additional liquidity.
Secondly, the forward oil curve has flattened. Previously, the market was expecting a fairly robust rebound in prices in the second half of 2015 and 2016; now forward price expectations are more subdued. With many companies well-hedged for 2015 they were effectively insulated from the drop in oil prices and had time to wait for the oil price environment in improve. However, hedges eventually roll-off and the sector as a whole is, generally speaking, less-hedged in 2016. This suggests that companies will have to operate in a low-cost environment longer-than-previously expected without the benefit of hedges which is likely to impair earnings and stretch liquidity.
Finally, with the Second Lien market basically closed barring a rebound in WTI, this places greater burden on companies RBLs (Reserve Backed Lines – their asset-backed bank credit facilities) to provide liquidity. These RBLs are re-valued by the companies’ bank groups generally in October; and a lower forward curve suggests that the borrowing capacity of these facilities will be trimmed precisely at the time that earnings and cash flow are under additional pressure, stretching companies’ liquidity profiles.
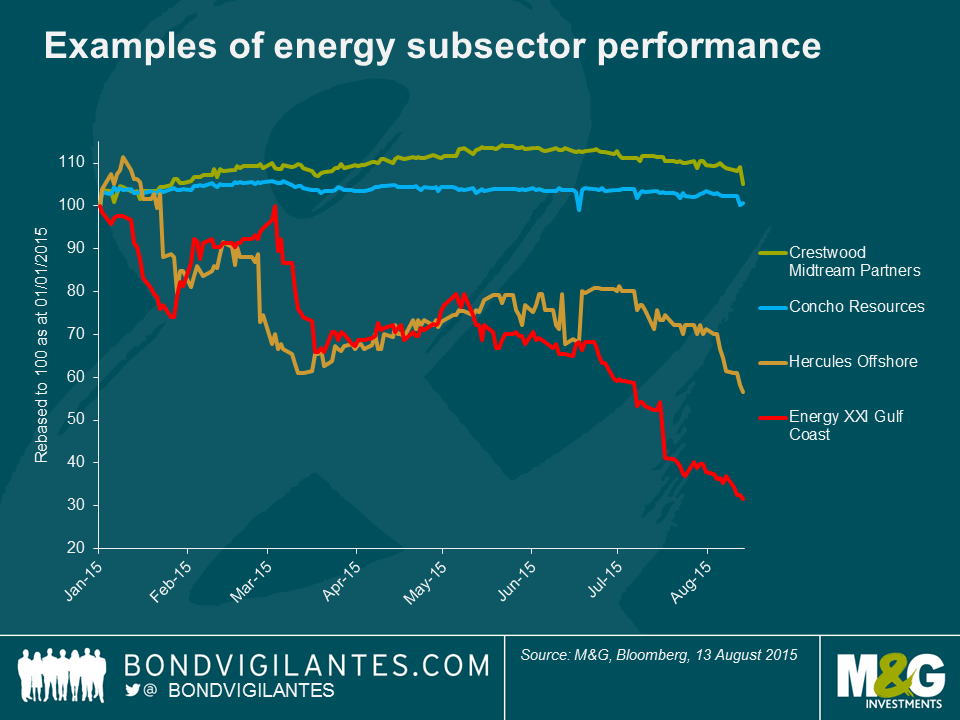
Now to be fair, the market hasn’t punished all companies indiscriminately. Service providers, offshore producers and highly-indebted exploration & production (E&P) companies have sold-off more dramatically than stable midstream (pipeline) and E&P companies with sound balance sheets and low operating costs.
The following demonstrates the price action of a few of the bonds within these individual subsectors:
So how should bond investors approach this space? With energy-related bonds accounting for 13.5% of the broader U.S. high yield index (off from its’ peak, but still the largest component of the index), it is difficult for investors to completely avoid the energy sector. Shunning it entirely now may result in missing out on any eventual recovery.
Despite the carnage, there is still some opportunity for patient investors to capitalise on those names that have been too severely punished and are likely to survive what now looks to be an extended low oil-price environment. In particular, investors should focus on:

We continue to avoid the service and offshore companies as, despite the extremely low prices, the risk of further downside is still high and bond volatility will be exacerbated by the entrance of aggressive, distressed investors playing in these bonds.
Will oil prices recover? It’s hard to say, but probably not in the near-term; China data, supply levels and the forward price curve suggests that oil prices will remain depressed for some time. One potential positive catalyst could be if the Iranian nuclear deal fails to pass the U.S. Congress (a real possibility), but this is likely to have only a moderate impact on oil prices given the relatively small impact on worldwide production/supply levels.
The People’s Bank of China (PBoC) has announced this morning that it is improving the pricing mechanism of the daily fixing rate of the renminbi. It will do this by referencing the previous day’s closing rate and by taking into account “demand and supply conditions in the foreign exchange markets” as well as exchange rate movements of other major currencies. As a result, the USDCNY (US dollar to Chinese Yuan Renminbi rate) was fixed higher by 1.9% as a one-off adjustment and represents a record weakening of the Chinese currency. It is the first weakening in the exchange rate by the PBoC since 1994.
The announcement of the PBoC that it will increase yuan flexibility suggests the daily fixing of the currency will be much more dependent on the market. As a result, it is unlikely that the yuan will continue to exhibit relatively low volatility and may continue to depreciate over the medium term as the authorities grapple with a slowdown in economic growth.
There are a number of implications of a weakening yuan over the medium term. Firstly, any move to weaken the yuan against the USD is likely to be bullish for US treasuries at the margin, resulting in lower yields. If the yuan depreciates in value, then China will have more USD to invest in US treasuries through foreign reserve accumulation, suggesting a strengthening in demand. However, unless we see a sustained weakening in the yuan in the weeks ahead then this move is unlikely to have a large impact in the demand for US treasuries in the short-term.
Secondly, this move will put downward pressure on already low inflation rates in the developed economies. Import prices for developed economies are likely to fall, suggesting lower producer and consumer prices. A substantial amount of Chinese manufactured goods consumed in the developed world are now cheaper and could cheapen further, resulting in lower costs for inputs which could lead to lower consumer prices.
Thirdly, the fall in the yuan will mean the purchasing power of Chinese businesses and households will deteriorate. It will also make raw material prices, which are largely denominated in USD, more expensive. The suggests further downward pressure on commodity prices and further pressure on commodity-rich export nations like Australia, New Zealand and Brazil. A weakening yuan suggests weakening demand and could result in lower growth for economies that export to China and weaker growth for the Asian region.
Any move to liberalise the determination of exchange rates should be viewed positively for the global economy. Given China’s level of importance as a key manufacturer of goods and its huge cache of foreign reserves, it is unsurprising that large moves in the exchange rate can have significant spillover effects for other economies and financial assets. Any further evolution of the determination of the daily fixing rate of the renminbi will continue to be closely watched, especially in an environment where the Chinese economic growth profile continues to be questioned.
The high yield primary market can be a battleground between issuers and investors to determine which covenants (the legal language that protects the right of bondholders) are included or excluded in the bond documentation. For investors, this can offer the opportunity to influence the structure of deals, and include valuable protections in the terms of the offering memorandum, which sets out the terms of the bonds.
The power balance between issuers and investors is, amongst other things, a function of supply and demand. In times of increasing demand for high yield bonds terms of the documentation can get permissive, disadvantaging investors. When there is decreasing demand, the balance may shift to favour investors. At such times, the inclusion of creditor-friendly covenants, or for that matter exclusion of creditor-unfriendly covenants, can make all the difference.
A recent secured bond from a sponsor deal had an exception to the Restricted Payments basket which was unusual and extremely aggressive, as seen from the investors’ perspective. We’ve referred to the importance of covenants in high yield before, and to Restricted Payments in particular. The Restricted Payments covenant typically restricts the payment of dividends (but also prepayment of subordinated debt, equity repurchases and certain investments) out of a Restricted Group, other than that which is permitted, excepted or earned.
During the roadshow for the secured bond, the Restricted Payment definition contained the following exception:
‘dividends or distributions paid to any Parent Holding Company in respect of Indebtedness of such Parent Holding Company which is guaranteed by the Company or any Restricted Subsidiary’
This exception effectively allows the sponsor (owner) the ability to issue debt at the Parent Holding Company level and upstream cash out of the Restricted Group to service it, almost without conditions (other than it be guaranteed by the Restricted Group).
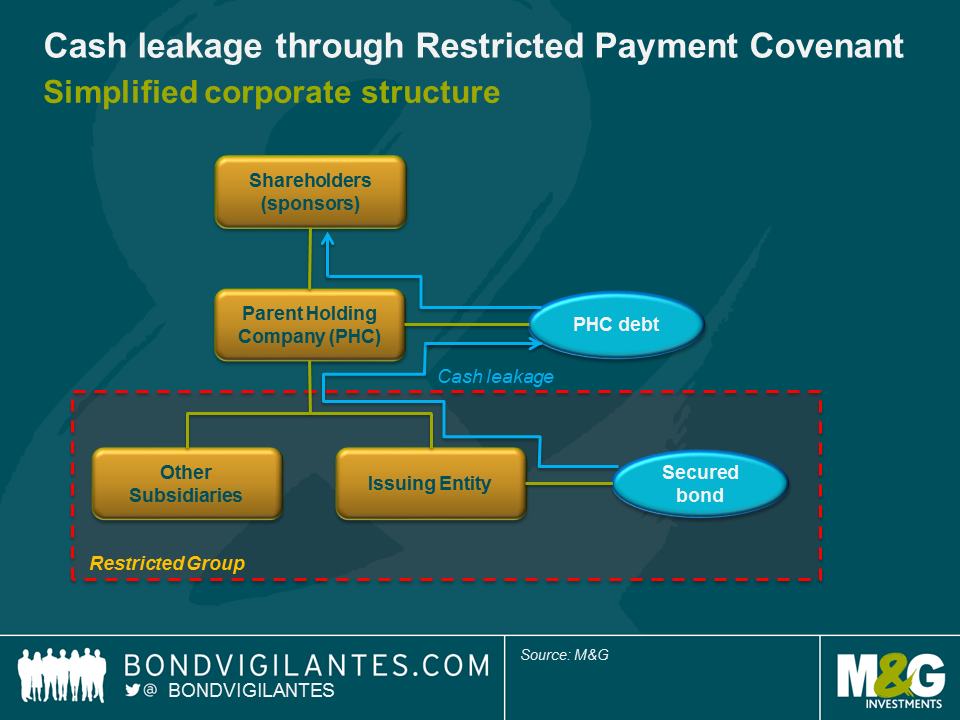
This is objectionable from an investors’ perspective for a number of reasons. Debt raised at the Parent Holding Company level:
Whilst this exception to Restricted Payments is included in some deals, it is rare, contentious and represents a significant loss of investor protections. In fact, it inverts the normal order of priority inherent in high yield, in this case allowing debt outside the Restricted Group to have equal dibs on cashflow as the secured counterpart inside the Restricted Group. Moreover, allowing this clause in the documentation would perpetuate a dangerous precedent.
During the roadshow feedback process investors were able to resist this egregious weakening of covenants. As a result, the exception was eliminated from the language of the docs. From a drafting point of view, this was as simple as omitting the two lines from the language of the document; two very important lines.
To be clear, a number of stars have to align for this feedback process to work in favour of investors. Battles over terms in high yield documentation between investors and issuers are commonplace on a number of fronts. This example, however, represents an important line in the sand, and illustrates that when engaging constructively with banks an active high yield investor base can have influence and drive the outcome of the shape of a transaction, enhancing the protections afforded to bondholders.


Sign up to the Bond Vigilantes mailing list to ensure you never miss a great article from our expert Bloggers. We will email all new articles to your inbox, meaning you can stay on top of the world of Bonds.
I confirm that I would like to receive information about Bond Vigilantes and products and services from M&G Securities Limited.
We will use the email address and personal data you have shared with us to send you this information. For existing customers, submitting your contact details and requesting to receive this information from us, will replace any earlier choices you have made in respect of marketing information.
You can unsubscribe from marketing at any time, at which point we will not send any further marketing information to you, by selecting the unsubscribe link in all communications.


