


Commodity carnage and mayhEM – how exposed are High Yield markets?
We have seen a fairly swift and deep sell off in both commodities and emerging market equities over the past few months. The recent moves are now feeding through into a more broad-based sell off in risk assets. It appears an opportune time to take stock and see how exposed the various high yield markets are to these trends.
In order to assess any impact, I will firstly consider direct exposure, defined as the proportion of the market that is emerging market domiciled (i.e. exposure to the potential double whammy of both a slow-down in growth and a currency depreciation) or those parts of the market that are engaged in the commodity space (defined as issuers within the energy, mining and steel sectors). Secondly I will look at indirect exposure, or to put it another way, how vulnerable the respective high yield markets could be to a more general re-pricing of risk given the differences in terms of duration, credit rating and capital structure. For the sake of brevity I will use four broad indices (all published by Bank of America Merrill Lynch), the US High Yield Index, the European Currency High Yield Index, the High Yield Emerging Markets Corporate Plus Index (a hard currency index) and the Global Floating Rate High Yield Index. This is by no means exhaustive and there are instances of overlap between them but when trying to consider the broad outlines of the US, European, EM hard currency and Floating Rate high yield markets we see them as reasonable proxies.
High yield market direct exposure
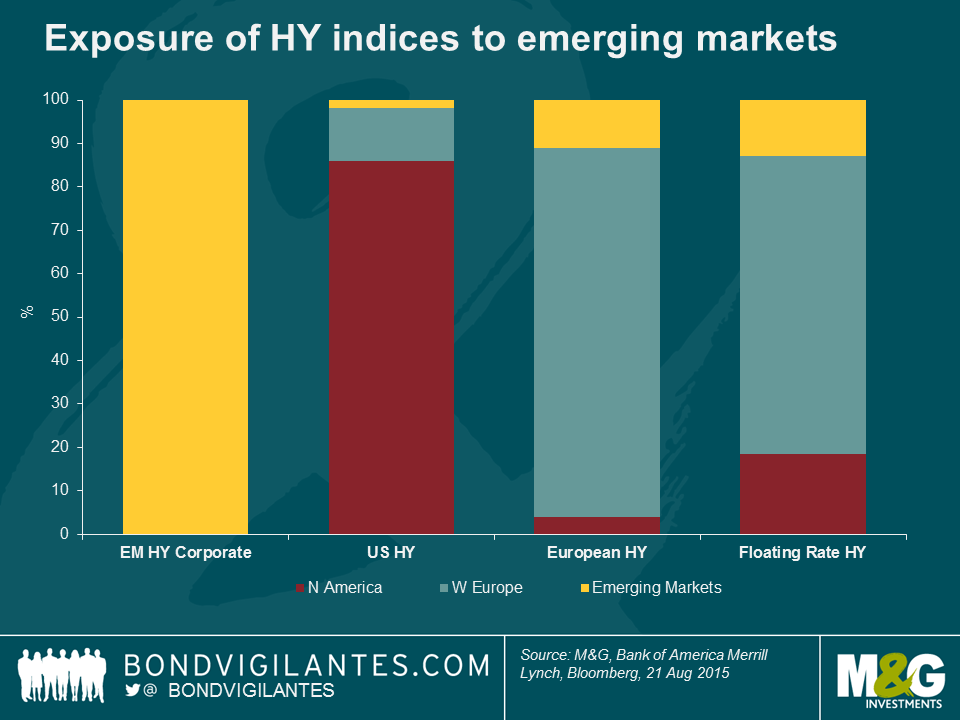
By definition the Emerging Market index is the most exposed, but what is perhaps more interesting is the relative exposure within other markets. The US High Yield market has very little direct exposure but due to a difference in index rules, emerging market issuers issuing in European currencies are eligible for inclusion in the European high yield index with the same being true for the Floating Rate index. Hence there is a comparatively higher level of direct exposure, albeit it’s still fairly limited in absolute terms at 11% and13% respectively.
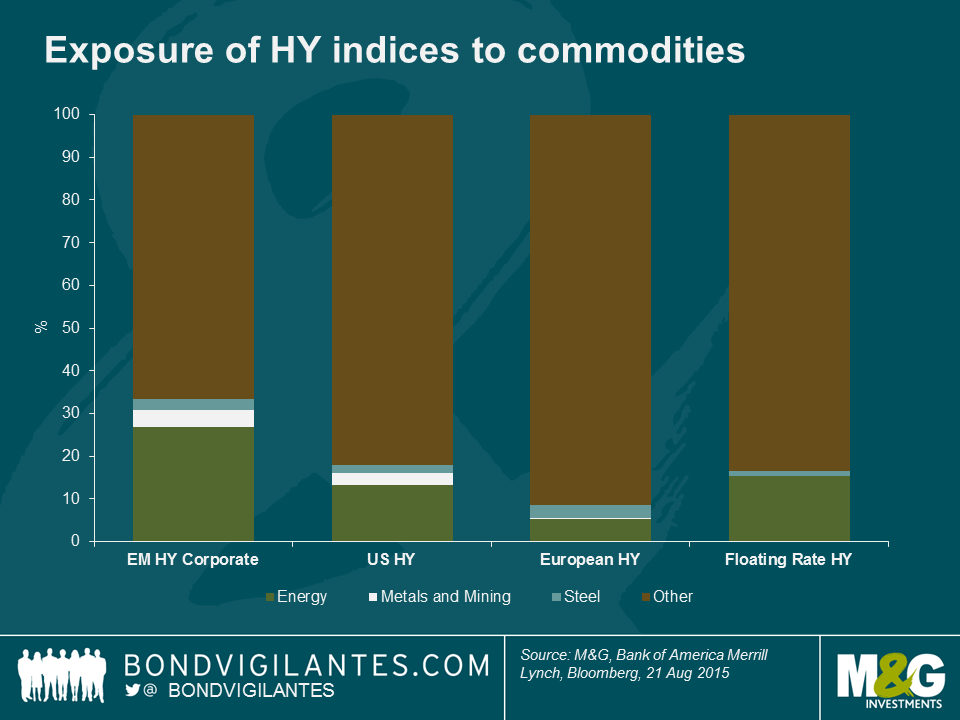
In terms of direct commodity exposure, the Emerging Market index is the most exposed with 34% of the market classified within energy, metals and mining or steel. The US market follows with 18% exposure given and the Floating Rate market is close behind at 17%. The European market is far less exposed at a little under 9%.
High yield market indirect exposure
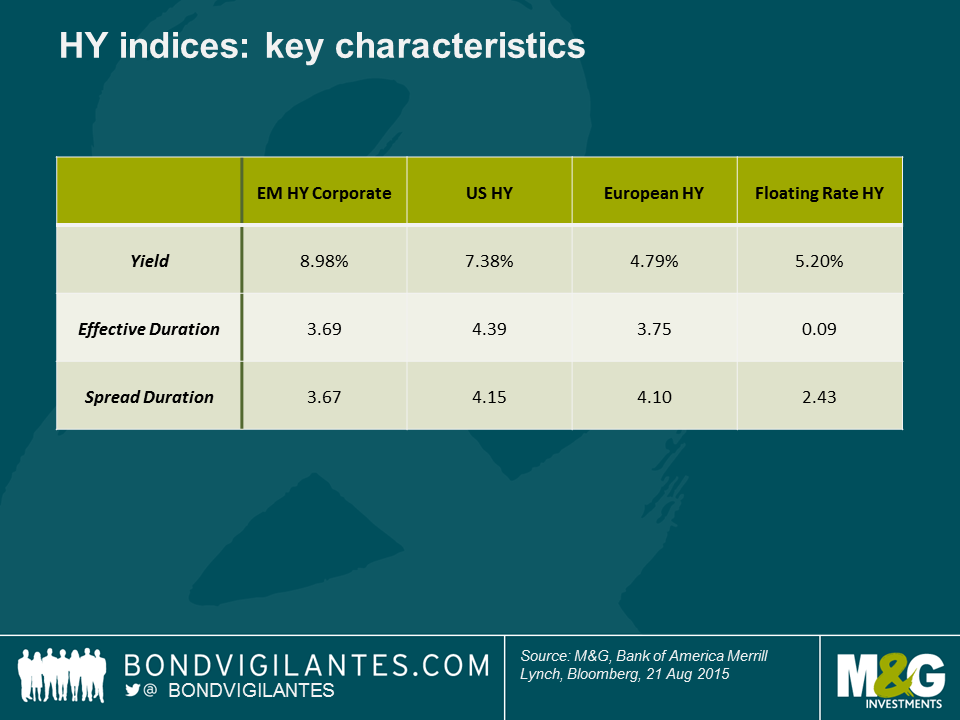
The key metric to consider when looking at the exposure to broader market moves for credit indices is spread duration. Broadly defined this is the capital loss in % for every 1% move in credit spreads. So assuming all credit markets traded 100bps wider, the US High Yield Market would see a capital loss of approximately 4.1%. Of course, this sort of move is never uniform but on this measure both the US market and the European markets have more credit risk “beta” than the EM High Yield market and the most defensive is the Floating Rate high yield market with only 2.4 years of spread duration.
Interest rate duration (effective duration below) should also not be ignored. Credit spreads and government bond yields have historically maintained an inverse relationship (albeit less so in the era of quantitative easing). Accordingly a flight to quality that pushes down government bond yields should help lower some of the price volatility caused by spread moves. The exception to this is the Floating Rate market which has very limited interest rate duration – short term price moves are almost entirely driven by credit spreads alone. Nevertheless, we would expect spread moves to dominate any move in the government bond market when it comes to the high yield markets, hence the focus on spread duration.
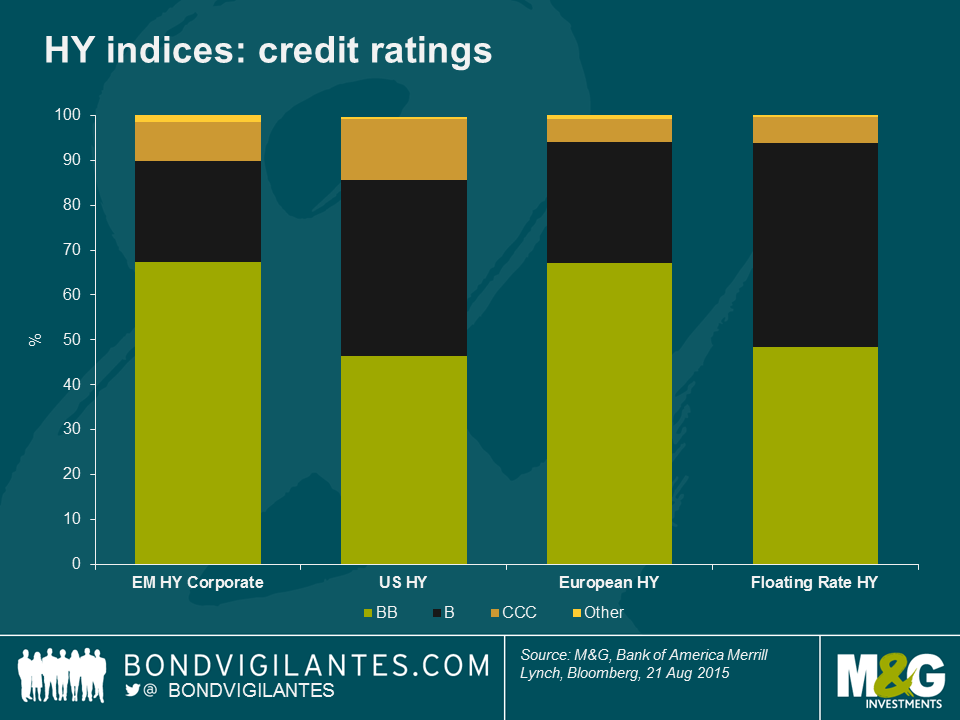
How about differences in credit risk? The chart below shows that in terms of rating the highest quality market on this measure is in fact the EM index with the European market very closely behind. Both the US and Floating Rate markets have a higher proportion of B rated bonds relative to less risky BB bonds. However, we should also consider capital structure differences as this can have a big impact in terms of credit losses during a default. On this measure the Floating Rate market is the most defensive with just under half the index classified as “senior secured” whereas both the US and EM markets are dominated by “unsecured” bonds which rank lower in terms of creditor preference and so are perceived by the market to be more risky.
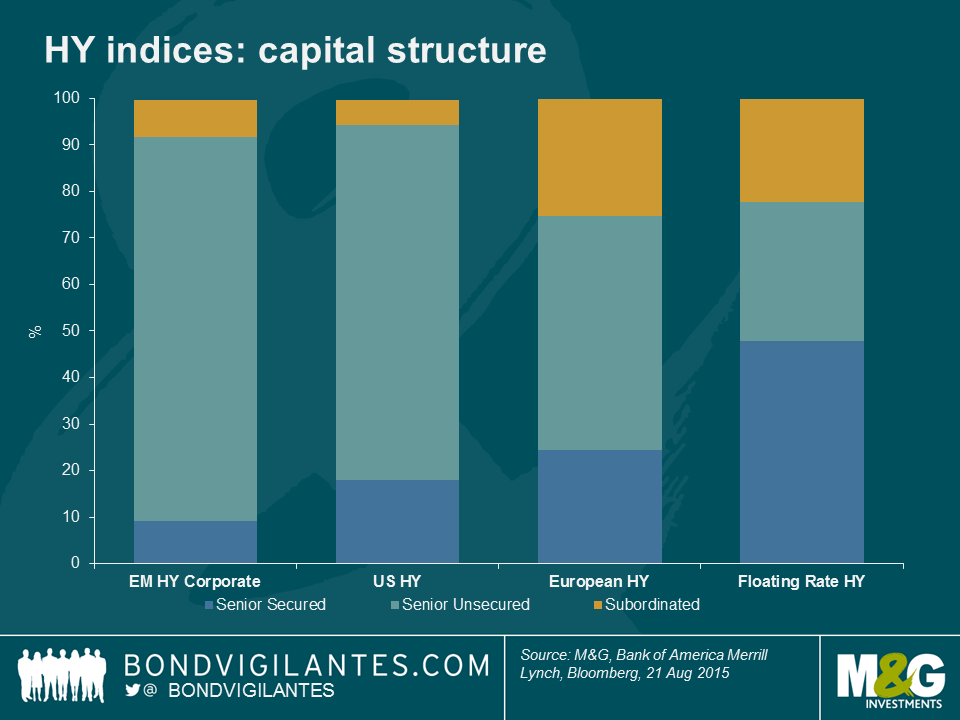
Bringing it all together, when we consider all the factors above, the European high yield market is probably the least exposed fundamentally to both commodity and emerging market risk and indeed is the least risky in terms of credit rating. However, in terms of capital structure and credit “beta” (spread duration), the Floating Rate market is the most defensive. Accordingly it shouldn’t come as a huge surprise that the European and the floating rate markets have held up relatively well during this sell off as shown in the below chart. Consequently, any major further weakness in either the Floating Rate or European market due to an emerging market or commodity related correction could be an interesting opportunity.
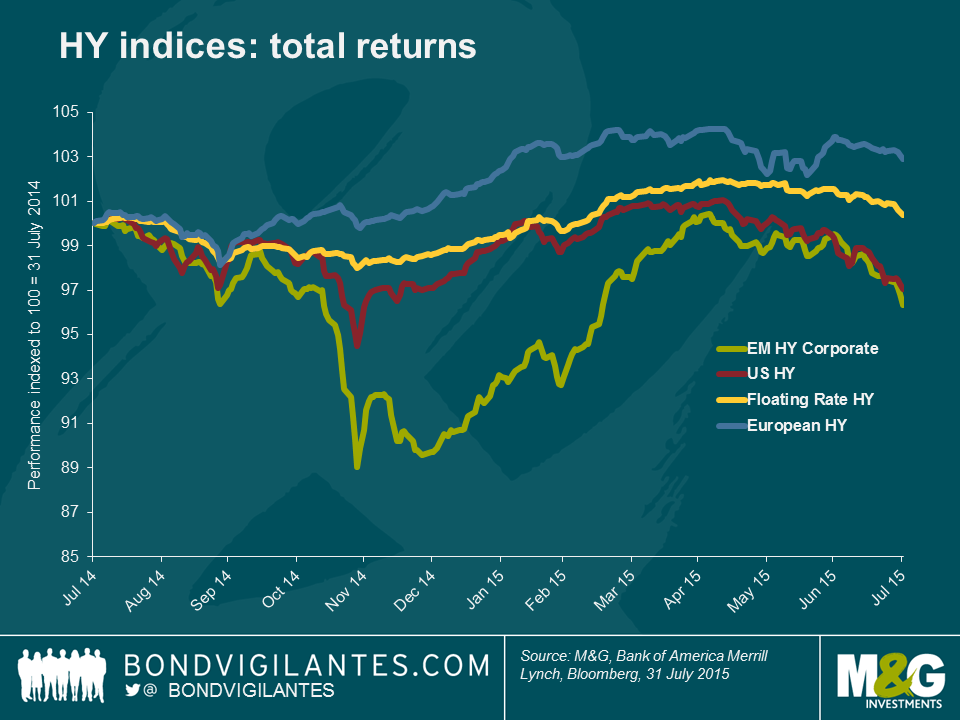
Turning to US and EM markets, with its well-publicised exposure to shale credits, the US market has already taken some pain following the correction in WTI prices as we have previously written about. Nevertheless, when we look at the fundamentals we need to remember it is still dominated by both domestic and non-commodity related issuers –this is where the more interesting value is starting to emerge. In contrast, it could be argued that the EM market looks vulnerable given it has seen a very similar price dynamic but with far more fundamental risk when it comes to domestic emerging market economies and indeed with more exposure to commodity related sectors.
The value of investments will fluctuate, which will cause prices to fall as well as rise and you may not get back the original amount you invested. Past performance is not a guide to future performance.
19 years of comment
Discover historical blogs from our extensive archive with our Blast from the past feature. View the most popular blogs posted this month - 5, 10 or 15 years ago!


Bond Vigilantes
Get Bond Vigilantes updates straight to your inbox